Concordia, NJ Map & Demographics
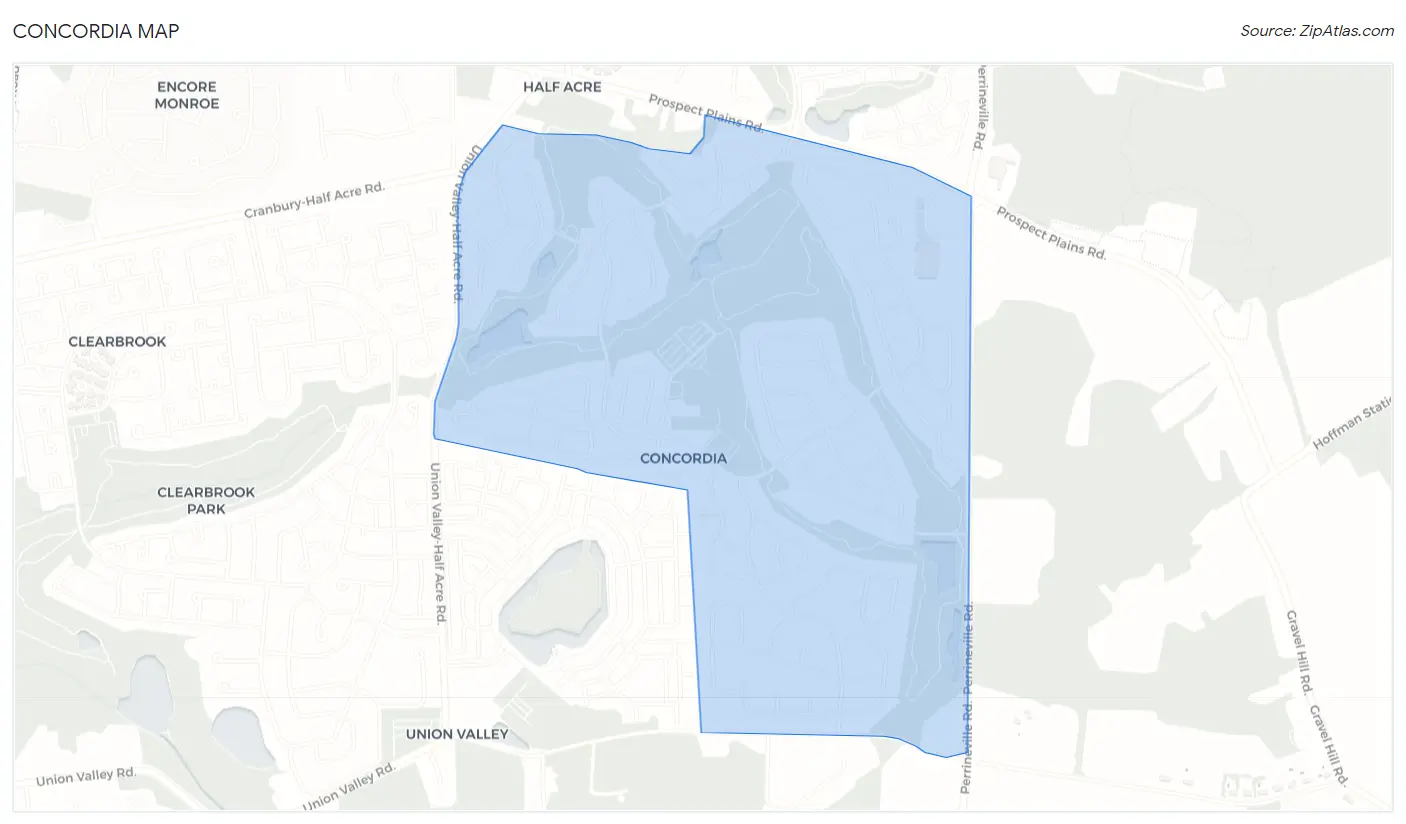
Concordia Map
Concordia Overview
$50,055
PER CAPITA INCOME
$70,673
AVG FAMILY INCOME
$52,114
AVG HOUSEHOLD INCOME
17.5%
WAGE / INCOME GAP [ % ]
82.5¢/ $1
WAGE / INCOME GAP [ $ ]
0.43
INEQUALITY / GINI INDEX
2,710
TOTAL POPULATION
1,125
MALE POPULATION
1,585
FEMALE POPULATION
70.98
MALES / 100 FEMALES
140.89
FEMALES / 100 MALES
72.4
MEDIAN AGE
2.0
AVG FAMILY SIZE
1.6
AVG HOUSEHOLD SIZE
894
LABOR FORCE [ PEOPLE ]
33.0%
PERCENT IN LABOR FORCE
11.3%
UNEMPLOYMENT RATE
Income in Concordia
Income Overview in Concordia
Per Capita Income in Concordia is $50,055, while median incomes of families and households are $70,673 and $52,114 respectively.
| Characteristic | Number | Measure |
| Per Capita Income | 2,710 | $50,055 |
| Median Family Income | 924 | $70,673 |
| Mean Family Income | 924 | $104,613 |
| Median Household Income | 1,703 | $52,114 |
| Mean Household Income | 1,703 | $79,866 |
| Income Deficit | 924 | $0 |
| Wage / Income Gap (%) | 2,710 | 17.46% |
| Wage / Income Gap ($) | 2,710 | 82.54¢ per $1 |
| Gini / Inequality Index | 2,710 | 0.43 |
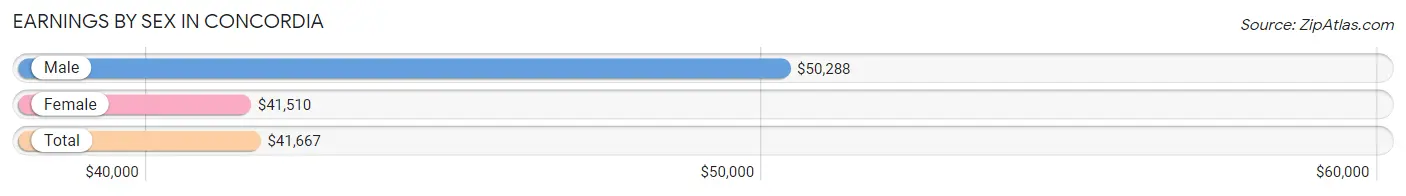
Earnings by Sex in Concordia
Average Earnings in Concordia are $41,667, $50,288 for men and $41,510 for women, a difference of 17.5%.
| Sex | Number | Average Earnings |
| Male | 471 (51.4%) | $50,288 |
| Female | 445 (48.6%) | $41,510 |
| Total | 916 (100.0%) | $41,667 |
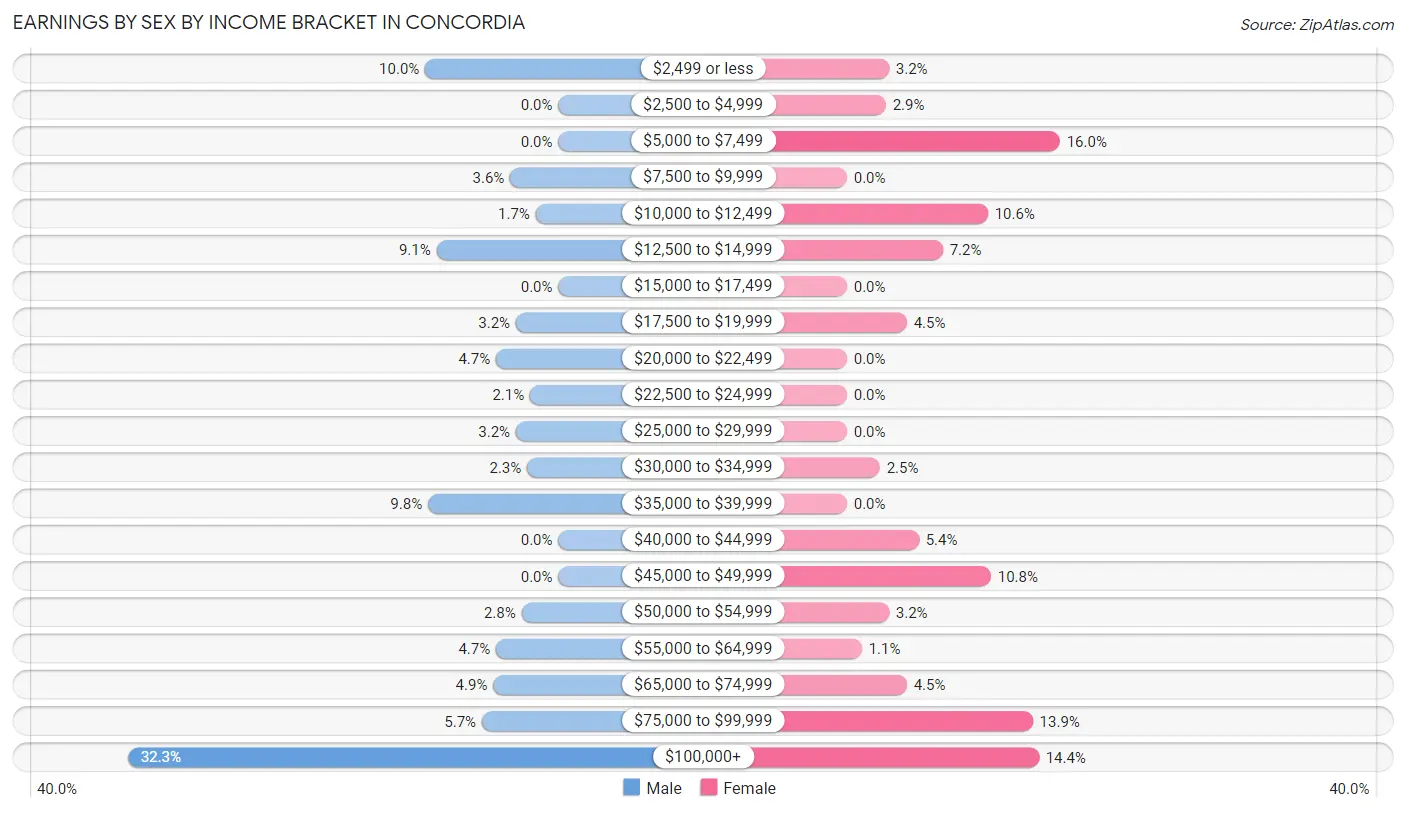
Earnings by Sex by Income Bracket in Concordia
The most common earnings brackets in Concordia are $100,000+ for men (152 | 32.3%) and $5,000 to $7,499 for women (71 | 16.0%).
| Income | Male | Female |
| $2,499 or less | 47 (10.0%) | 14 (3.2%) |
| $2,500 to $4,999 | 0 (0.0%) | 13 (2.9%) |
| $5,000 to $7,499 | 0 (0.0%) | 71 (16.0%) |
| $7,500 to $9,999 | 17 (3.6%) | 0 (0.0%) |
| $10,000 to $12,499 | 8 (1.7%) | 47 (10.6%) |
| $12,500 to $14,999 | 43 (9.1%) | 32 (7.2%) |
| $15,000 to $17,499 | 0 (0.0%) | 0 (0.0%) |
| $17,500 to $19,999 | 15 (3.2%) | 20 (4.5%) |
| $20,000 to $22,499 | 22 (4.7%) | 0 (0.0%) |
| $22,500 to $24,999 | 10 (2.1%) | 0 (0.0%) |
| $25,000 to $29,999 | 15 (3.2%) | 0 (0.0%) |
| $30,000 to $34,999 | 11 (2.3%) | 11 (2.5%) |
| $35,000 to $39,999 | 46 (9.8%) | 0 (0.0%) |
| $40,000 to $44,999 | 0 (0.0%) | 24 (5.4%) |
| $45,000 to $49,999 | 0 (0.0%) | 48 (10.8%) |
| $50,000 to $54,999 | 13 (2.8%) | 14 (3.2%) |
| $55,000 to $64,999 | 22 (4.7%) | 5 (1.1%) |
| $65,000 to $74,999 | 23 (4.9%) | 20 (4.5%) |
| $75,000 to $99,999 | 27 (5.7%) | 62 (13.9%) |
| $100,000+ | 152 (32.3%) | 64 (14.4%) |
| Total | 471 (100.0%) | 445 (100.0%) |
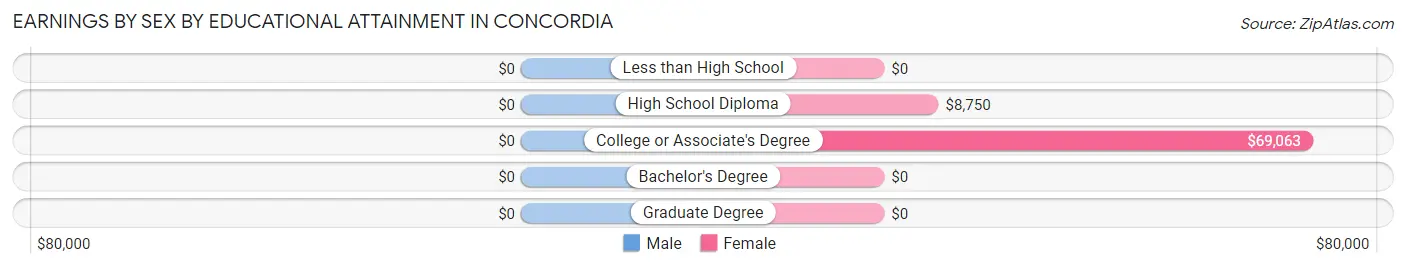
Earnings by Sex by Educational Attainment in Concordia
| Educational Attainment | Male Income | Female Income |
| Less than High School | - | - |
| High School Diploma | - | - |
| College or Associate's Degree | - | - |
| Bachelor's Degree | - | - |
| Graduate Degree | - | - |
| Total | $50,288 | $41,510 |
Family Income in Concordia
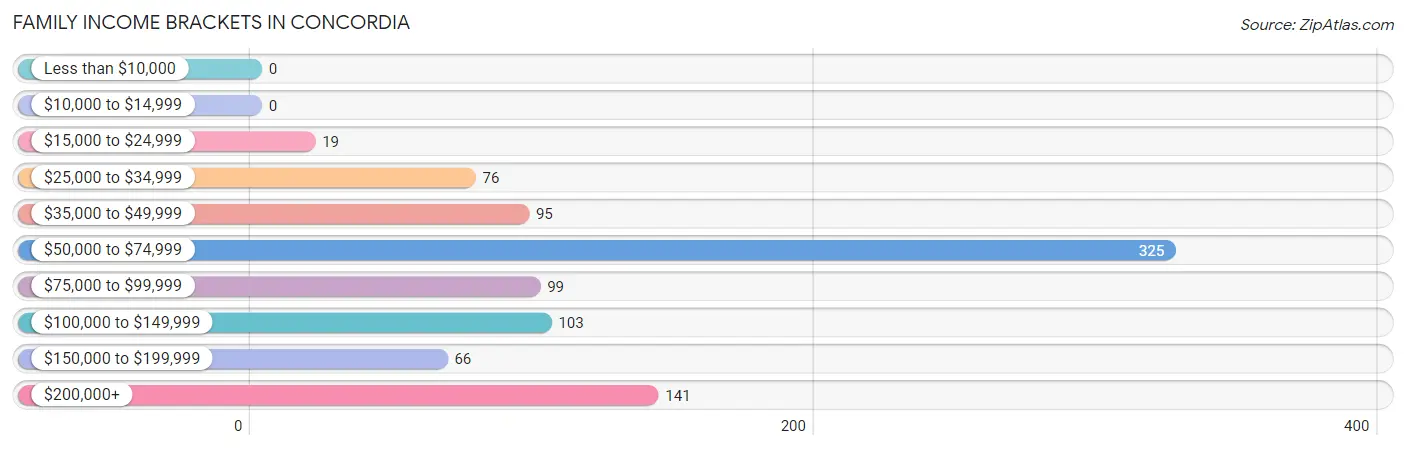
Family Income Brackets in Concordia
According to the Concordia family income data, there are 325 families falling into the $50,000 to $74,999 income range, which is the most common income bracket and makes up 35.2% of all families.
| Income Bracket | # Families | % Families |
| Less than $10,000 | 0 | 0.0% |
| $10,000 to $14,999 | 0 | 0.0% |
| $15,000 to $24,999 | 19 | 2.1% |
| $25,000 to $34,999 | 76 | 8.2% |
| $35,000 to $49,999 | 95 | 10.3% |
| $50,000 to $74,999 | 325 | 35.2% |
| $75,000 to $99,999 | 99 | 10.7% |
| $100,000 to $149,999 | 103 | 11.1% |
| $150,000 to $199,999 | 66 | 7.1% |
| $200,000+ | 141 | 15.3% |
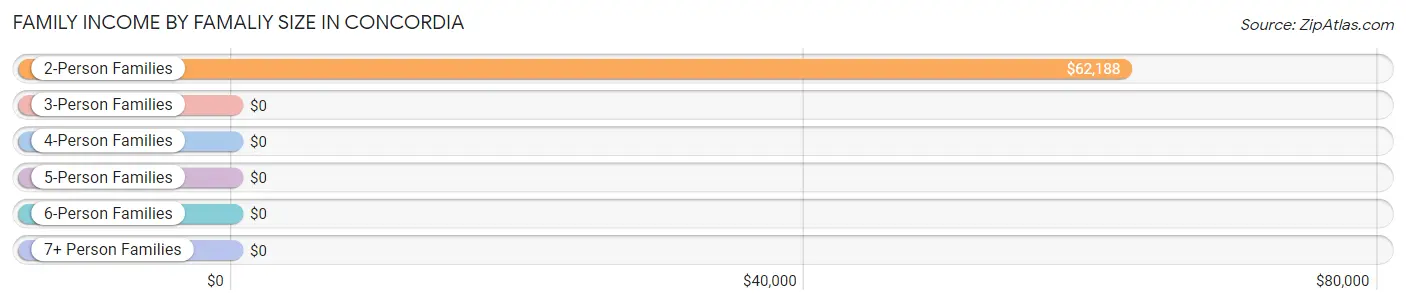
Family Income by Famaliy Size in Concordia
2-person families (903 | 97.7%) account for the highest median family income in Concordia with $62,188 per family, while 2-person families (903 | 97.7%) have the highest median income of $31,094 per family member.
| Income Bracket | # Families | Median Income |
| 2-Person Families | 903 (97.7%) | $62,188 |
| 3-Person Families | 21 (2.3%) | $0 |
| 4-Person Families | 0 (0.0%) | $0 |
| 5-Person Families | 0 (0.0%) | $0 |
| 6-Person Families | 0 (0.0%) | $0 |
| 7+ Person Families | 0 (0.0%) | $0 |
| Total | 924 (100.0%) | $70,673 |
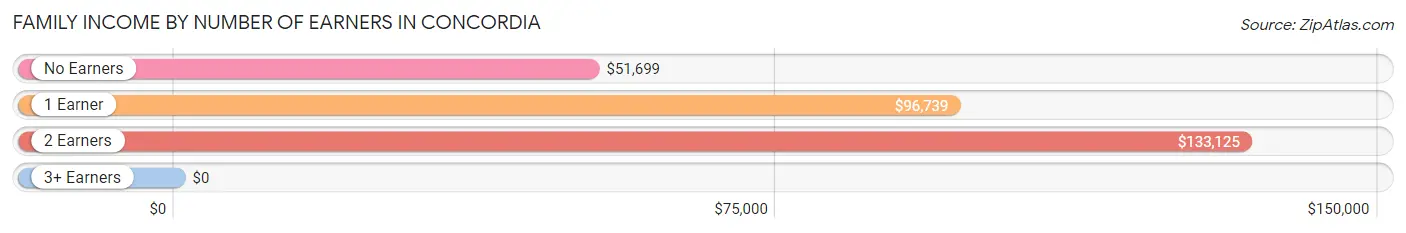
Family Income by Number of Earners in Concordia
| Number of Earners | # Families | Median Income |
| No Earners | 450 (48.7%) | $51,699 |
| 1 Earner | 312 (33.8%) | $96,739 |
| 2 Earners | 162 (17.5%) | $133,125 |
| 3+ Earners | 0 (0.0%) | $0 |
| Total | 924 (100.0%) | $70,673 |
Household Income in Concordia
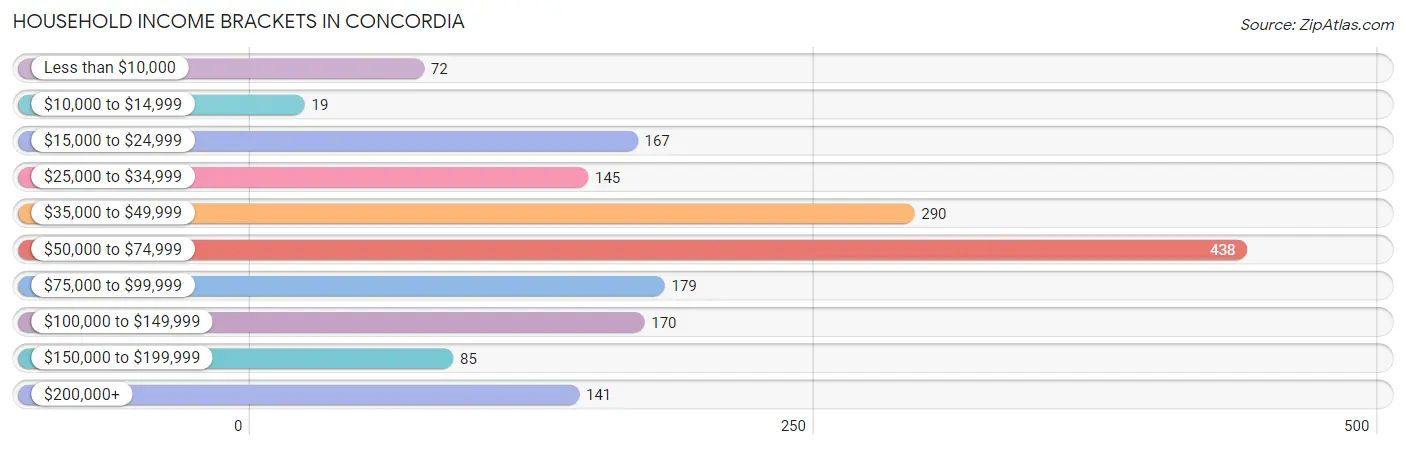
Household Income Brackets in Concordia
With 438 households falling in the category, the $50,000 to $74,999 income range is the most frequent in Concordia, accounting for 25.7% of all households. In contrast, only 19 households (1.1%) fall into the $10,000 to $14,999 income bracket, making it the least populous group.
| Income Bracket | # Households | % Households |
| Less than $10,000 | 72 | 4.2% |
| $10,000 to $14,999 | 19 | 1.1% |
| $15,000 to $24,999 | 167 | 9.8% |
| $25,000 to $34,999 | 145 | 8.5% |
| $35,000 to $49,999 | 290 | 17.0% |
| $50,000 to $74,999 | 438 | 25.7% |
| $75,000 to $99,999 | 179 | 10.5% |
| $100,000 to $149,999 | 170 | 10.0% |
| $150,000 to $199,999 | 85 | 5.0% |
| $200,000+ | 141 | 8.3% |
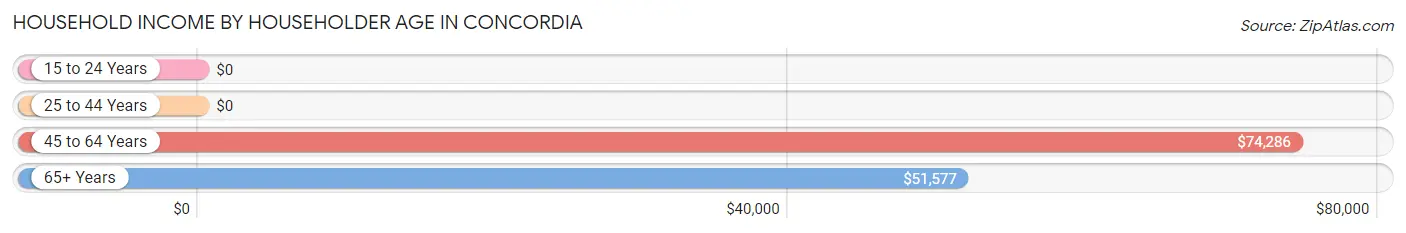
Household Income by Householder Age in Concordia
The median household income in Concordia is $52,114, with the highest median household income of $74,286 found in the 45 to 64 years age bracket for the primary householder. A total of 278 households (16.3%) fall into this category.
| Income Bracket | # Households | Median Income |
| 15 to 24 Years | 0 (0.0%) | $0 |
| 25 to 44 Years | 0 (0.0%) | $0 |
| 45 to 64 Years | 278 (16.3%) | $74,286 |
| 65+ Years | 1,425 (83.7%) | $51,577 |
| Total | 1,703 (100.0%) | $52,114 |
Poverty in Concordia
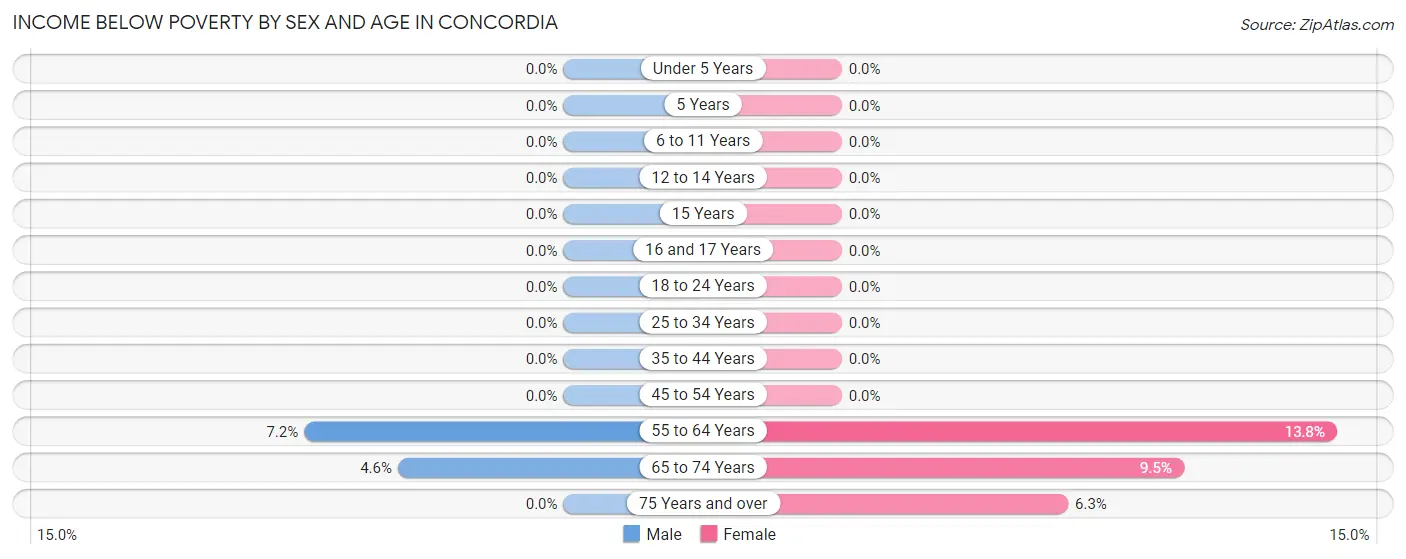
Income Below Poverty by Sex and Age in Concordia
With 2.9% poverty level for males and 8.8% for females among the residents of Concordia, 55 to 64 year old males and 55 to 64 year old females are the most vulnerable to poverty, with 14 males (7.2%) and 31 females (13.8%) in their respective age groups living below the poverty level.
| Age Bracket | Male | Female |
| Under 5 Years | 0 (0.0%) | 0 (0.0%) |
| 5 Years | 0 (0.0%) | 0 (0.0%) |
| 6 to 11 Years | 0 (0.0%) | 0 (0.0%) |
| 12 to 14 Years | 0 (0.0%) | 0 (0.0%) |
| 15 Years | 0 (0.0%) | 0 (0.0%) |
| 16 and 17 Years | 0 (0.0%) | 0 (0.0%) |
| 18 to 24 Years | 0 (0.0%) | 0 (0.0%) |
| 25 to 34 Years | 0 (0.0%) | 0 (0.0%) |
| 35 to 44 Years | 0 (0.0%) | 0 (0.0%) |
| 45 to 54 Years | 0 (0.0%) | 0 (0.0%) |
| 55 to 64 Years | 14 (7.2%) | 31 (13.8%) |
| 65 to 74 Years | 19 (4.6%) | 72 (9.5%) |
| 75 Years and over | 0 (0.0%) | 36 (6.3%) |
| Total | 33 (2.9%) | 139 (8.8%) |
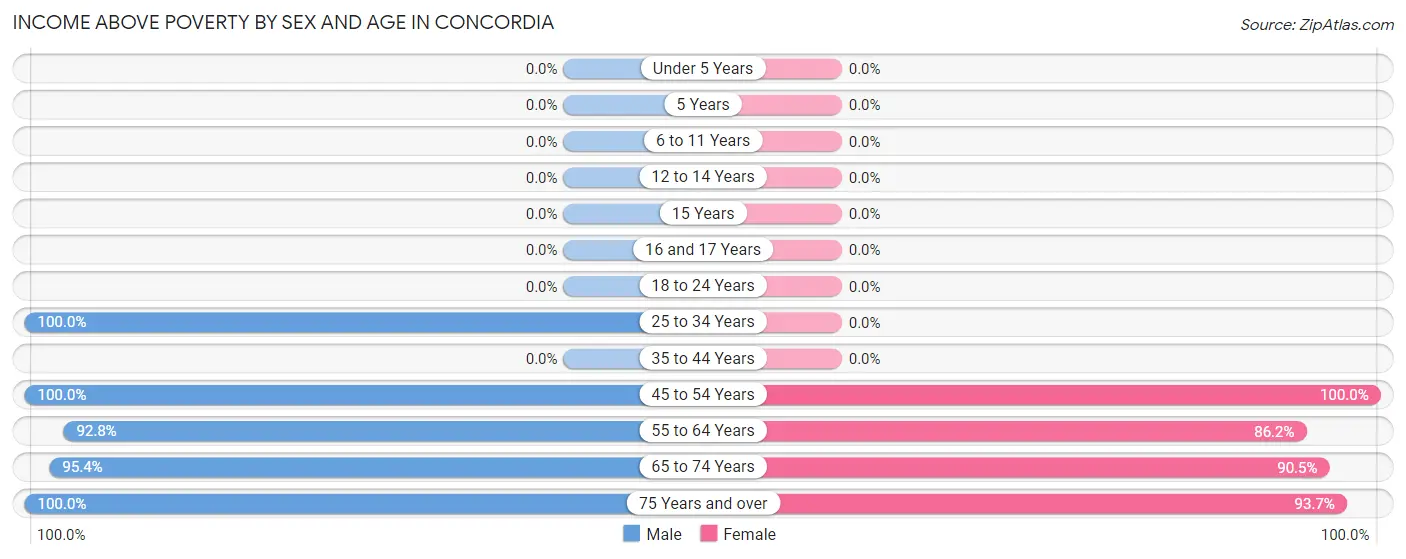
Income Above Poverty by Sex and Age in Concordia
According to the poverty statistics in Concordia, males aged 25 to 34 years and females aged 45 to 54 years are the age groups that are most secure financially, with 100.0% of males and 100.0% of females in these age groups living above the poverty line.
| Age Bracket | Male | Female |
| Under 5 Years | 0 (0.0%) | 0 (0.0%) |
| 5 Years | 0 (0.0%) | 0 (0.0%) |
| 6 to 11 Years | 0 (0.0%) | 0 (0.0%) |
| 12 to 14 Years | 0 (0.0%) | 0 (0.0%) |
| 15 Years | 0 (0.0%) | 0 (0.0%) |
| 16 and 17 Years | 0 (0.0%) | 0 (0.0%) |
| 18 to 24 Years | 0 (0.0%) | 0 (0.0%) |
| 25 to 34 Years | 22 (100.0%) | 0 (0.0%) |
| 35 to 44 Years | 0 (0.0%) | 0 (0.0%) |
| 45 to 54 Years | 35 (100.0%) | 33 (100.0%) |
| 55 to 64 Years | 180 (92.8%) | 194 (86.2%) |
| 65 to 74 Years | 393 (95.4%) | 684 (90.5%) |
| 75 Years and over | 462 (100.0%) | 535 (93.7%) |
| Total | 1,092 (97.1%) | 1,446 (91.2%) |
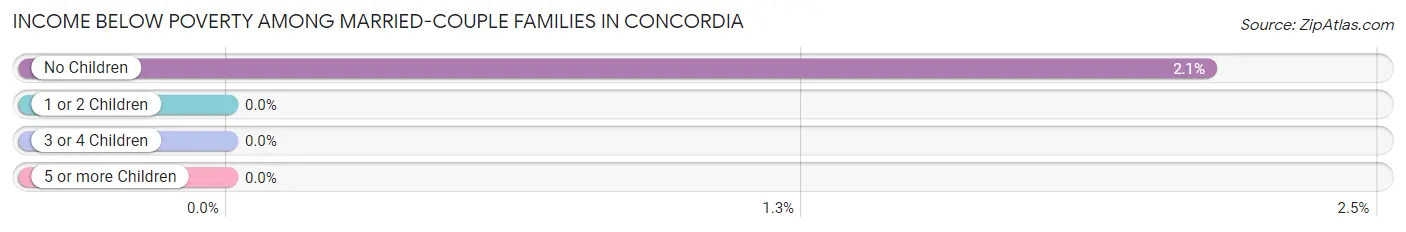
Income Below Poverty Among Married-Couple Families in Concordia
The poverty statistics for married-couple families in Concordia show that 2.1% or 19 of the total 891 families live below the poverty line. Families with no children have the highest poverty rate of 2.1%, comprising of 19 families. On the other hand, families with no children have the lowest poverty rate of 2.1%, which includes 19 families.
| Children | Above Poverty | Below Poverty |
| No Children | 872 (97.9%) | 19 (2.1%) |
| 1 or 2 Children | 0 (0.0%) | 0 (0.0%) |
| 3 or 4 Children | 0 (0.0%) | 0 (0.0%) |
| 5 or more Children | 0 (0.0%) | 0 (0.0%) |
| Total | 872 (97.9%) | 19 (2.1%) |
Income Below Poverty Among Single-Parent Households in Concordia
| Children | Single Father | Single Mother |
| No Children | 0 (0.0%) | 0 (0.0%) |
| 1 or 2 Children | 0 (0.0%) | 0 (0.0%) |
| 3 or 4 Children | 0 (0.0%) | 0 (0.0%) |
| 5 or more Children | 0 (0.0%) | 0 (0.0%) |
| Total | 0 (0.0%) | 0 (0.0%) |
Income Below Poverty Among Married-Couple vs Single-Parent Households in Concordia
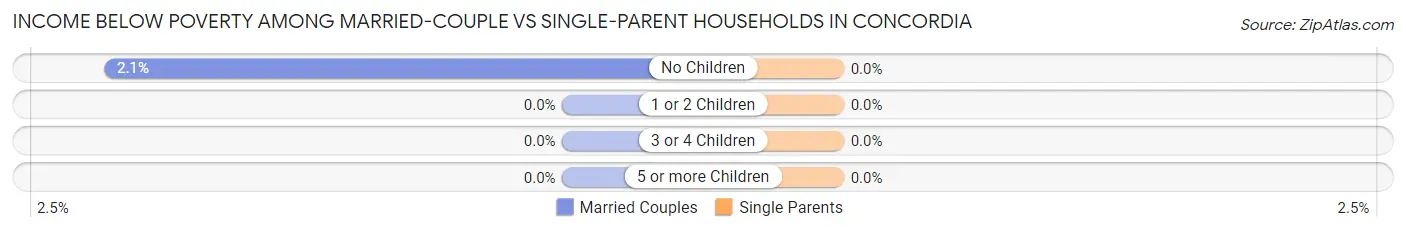
| Children | Married-Couple Families | Single-Parent Households |
| No Children | 19 (2.1%) | 0 (0.0%) |
| 1 or 2 Children | 0 (0.0%) | 0 (0.0%) |
| 3 or 4 Children | 0 (0.0%) | 0 (0.0%) |
| 5 or more Children | 0 (0.0%) | 0 (0.0%) |
| Total | 19 (2.1%) | 0 (0.0%) |
Race in Concordia
The most populous races in Concordia are White / Caucasian (2,394 | 88.3%), Hispanic or Latino (146 | 5.4%), and Black / African American (141 | 5.2%).
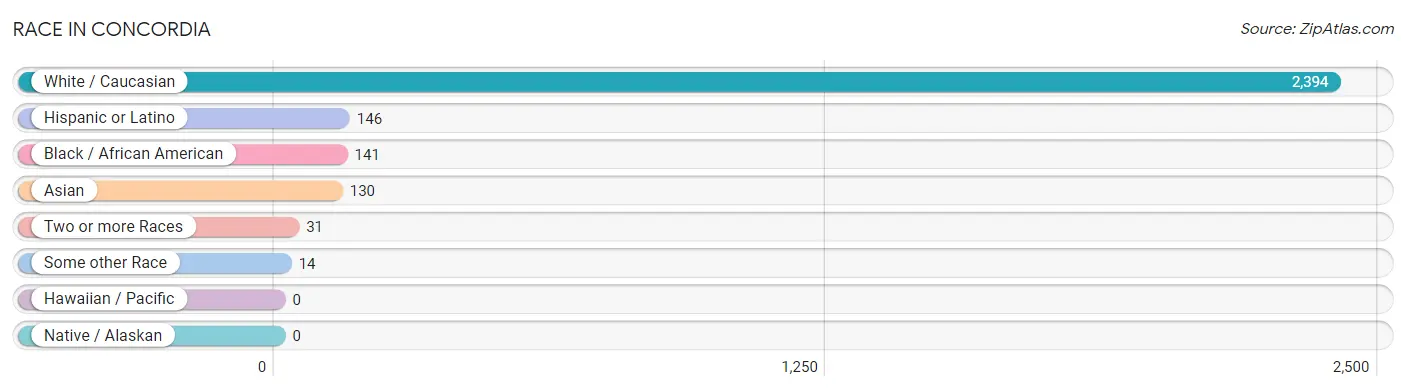
| Race | # Population | % Population |
| Asian | 130 | 4.8% |
| Black / African American | 141 | 5.2% |
| Hawaiian / Pacific | 0 | 0.0% |
| Hispanic or Latino | 146 | 5.4% |
| Native / Alaskan | 0 | 0.0% |
| White / Caucasian | 2,394 | 88.3% |
| Two or more Races | 31 | 1.1% |
| Some other Race | 14 | 0.5% |
| Total | 2,710 | 100.0% |
Ancestry in Concordia
The most populous ancestries reported in Concordia are Eastern European (505 | 18.6%), Polish (307 | 11.3%), Italian (297 | 11.0%), Irish (227 | 8.4%), and Russian (204 | 7.5%), together accounting for 56.8% of all Concordia residents.
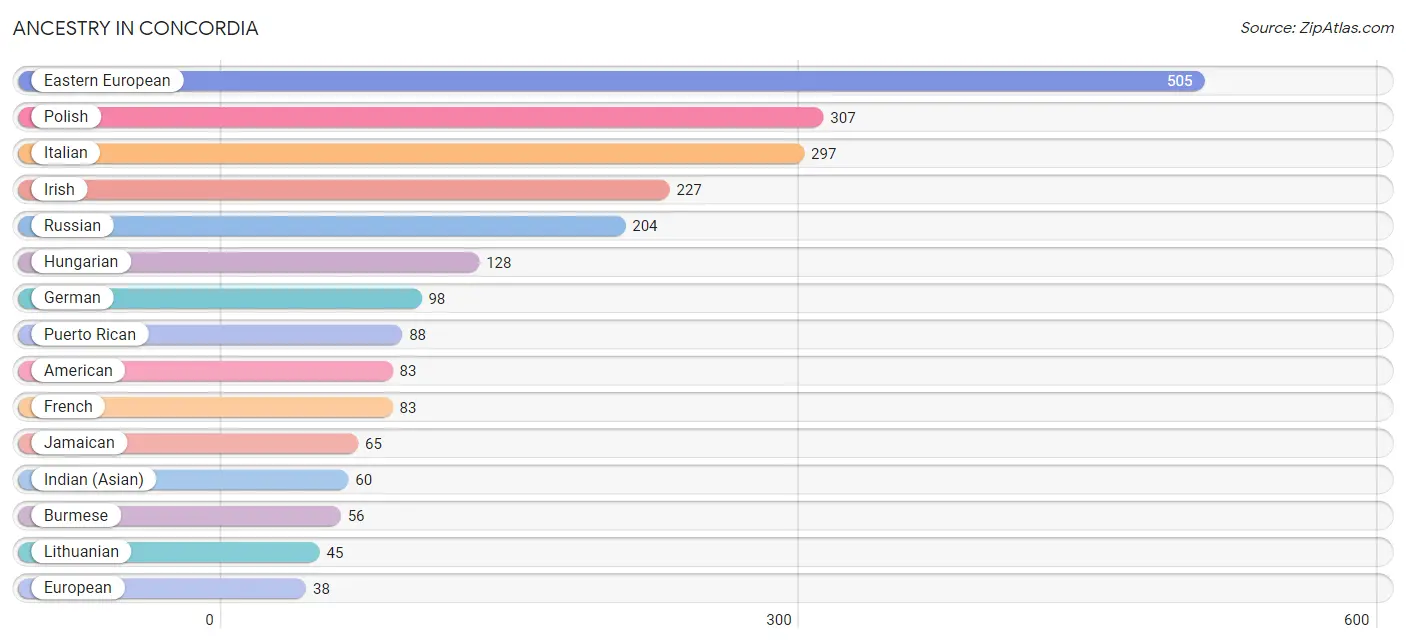
| Ancestry | # Population | % Population |
| American | 83 | 3.1% |
| Arab | 21 | 0.8% |
| British | 15 | 0.5% |
| Burmese | 56 | 2.1% |
| Central American | 13 | 0.5% |
| Colombian | 14 | 0.5% |
| Cuban | 31 | 1.1% |
| Danish | 11 | 0.4% |
| Eastern European | 505 | 18.6% |
| English | 15 | 0.5% |
| European | 38 | 1.4% |
| Finnish | 15 | 0.5% |
| French | 83 | 3.1% |
| French Canadian | 14 | 0.5% |
| German | 98 | 3.6% |
| Greek | 16 | 0.6% |
| Hungarian | 128 | 4.7% |
| Indian (Asian) | 60 | 2.2% |
| Irish | 227 | 8.4% |
| Italian | 297 | 11.0% |
| Jamaican | 65 | 2.4% |
| Korean | 14 | 0.5% |
| Lithuanian | 45 | 1.7% |
| Norwegian | 24 | 0.9% |
| Polish | 307 | 11.3% |
| Puerto Rican | 88 | 3.3% |
| Romanian | 25 | 0.9% |
| Russian | 204 | 7.5% |
| Salvadoran | 13 | 0.5% |
| South American | 14 | 0.5% |
| Swedish | 11 | 0.4% |
| Swiss | 14 | 0.5% | View All 32 Rows |
Immigrants in Concordia
The most numerous immigrant groups reported in Concordia came from Asia (155 | 5.7%), Europe (146 | 5.4%), Eastern Asia (105 | 3.9%), Latin America (99 | 3.6%), and Caribbean (85 | 3.1%), together accounting for 21.8% of all Concordia residents.
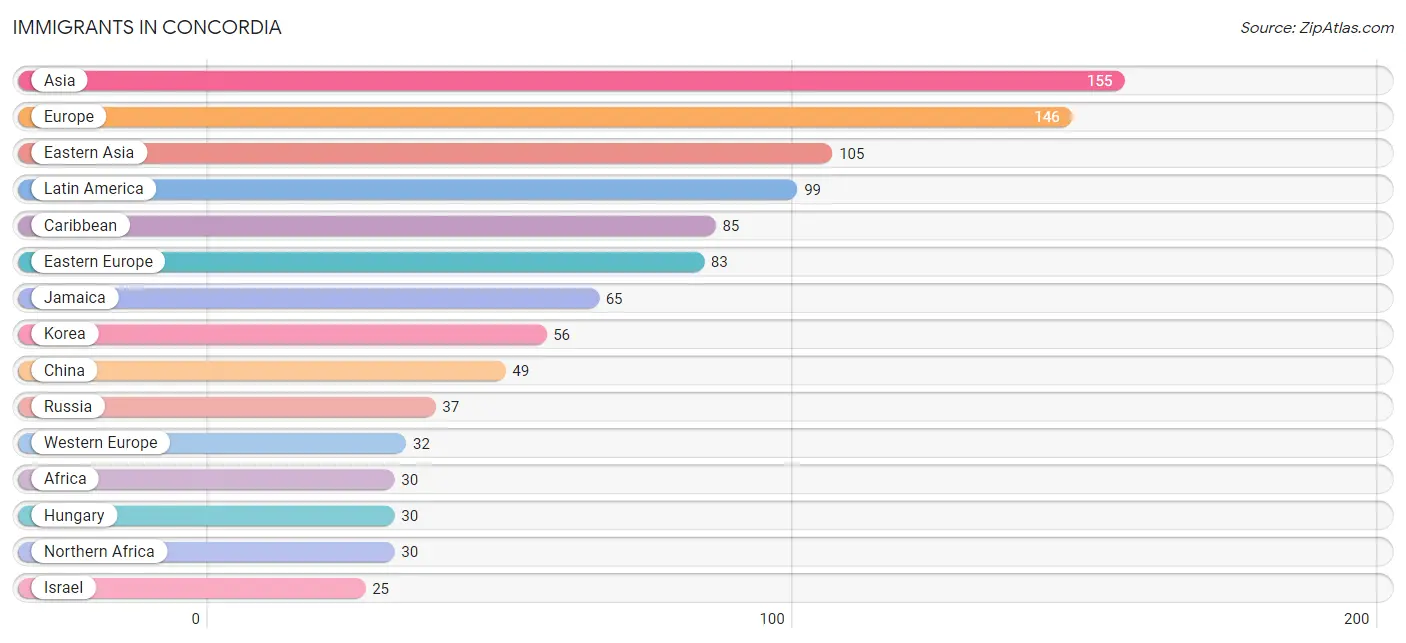
| Immigration Origin | # Population | % Population |
| Africa | 30 | 1.1% |
| Asia | 155 | 5.7% |
| Belarus | 16 | 0.6% |
| Caribbean | 85 | 3.1% |
| China | 49 | 1.8% |
| Colombia | 14 | 0.5% |
| Cuba | 20 | 0.7% |
| Eastern Asia | 105 | 3.9% |
| Eastern Europe | 83 | 3.1% |
| Europe | 146 | 5.4% |
| France | 13 | 0.5% |
| Germany | 19 | 0.7% |
| Hungary | 30 | 1.1% |
| India | 11 | 0.4% |
| Ireland | 16 | 0.6% |
| Israel | 25 | 0.9% |
| Italy | 15 | 0.5% |
| Jamaica | 65 | 2.4% |
| Korea | 56 | 2.1% |
| Latin America | 99 | 3.6% |
| Northern Africa | 30 | 1.1% |
| Northern Europe | 16 | 0.6% |
| Philippines | 14 | 0.5% |
| Russia | 37 | 1.4% |
| South America | 14 | 0.5% |
| South Central Asia | 11 | 0.4% |
| South Eastern Asia | 14 | 0.5% |
| Southern Europe | 15 | 0.5% |
| Western Asia | 25 | 0.9% |
| Western Europe | 32 | 1.2% | View All 30 Rows |
Sex and Age in Concordia
Sex and Age in Concordia
The most populous age groups in Concordia are 75 to 79 Years (343 | 30.5%) for men and 70 to 74 Years (382 | 24.1%) for women.
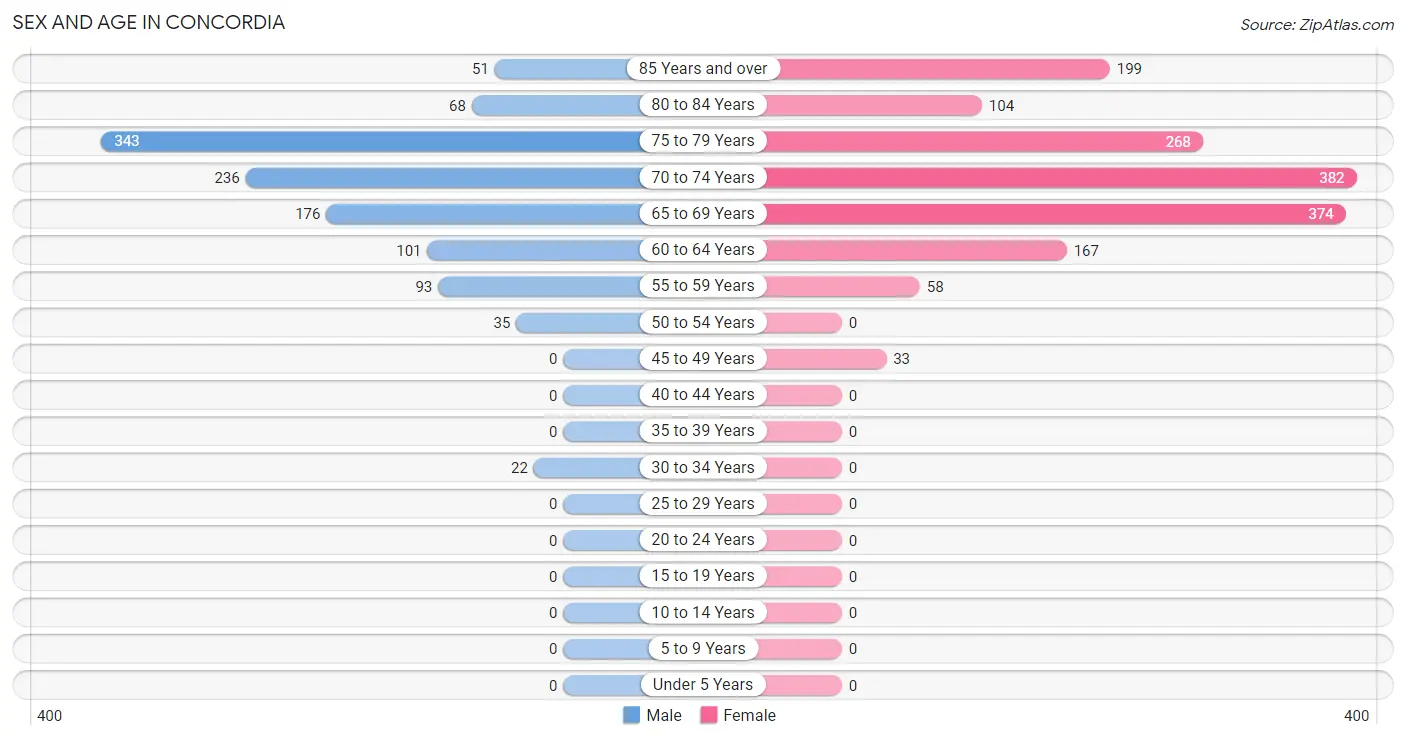
| Age Bracket | Male | Female |
| Under 5 Years | 0 (0.0%) | 0 (0.0%) |
| 5 to 9 Years | 0 (0.0%) | 0 (0.0%) |
| 10 to 14 Years | 0 (0.0%) | 0 (0.0%) |
| 15 to 19 Years | 0 (0.0%) | 0 (0.0%) |
| 20 to 24 Years | 0 (0.0%) | 0 (0.0%) |
| 25 to 29 Years | 0 (0.0%) | 0 (0.0%) |
| 30 to 34 Years | 22 (2.0%) | 0 (0.0%) |
| 35 to 39 Years | 0 (0.0%) | 0 (0.0%) |
| 40 to 44 Years | 0 (0.0%) | 0 (0.0%) |
| 45 to 49 Years | 0 (0.0%) | 33 (2.1%) |
| 50 to 54 Years | 35 (3.1%) | 0 (0.0%) |
| 55 to 59 Years | 93 (8.3%) | 58 (3.7%) |
| 60 to 64 Years | 101 (9.0%) | 167 (10.5%) |
| 65 to 69 Years | 176 (15.6%) | 374 (23.6%) |
| 70 to 74 Years | 236 (21.0%) | 382 (24.1%) |
| 75 to 79 Years | 343 (30.5%) | 268 (16.9%) |
| 80 to 84 Years | 68 (6.0%) | 104 (6.6%) |
| 85 Years and over | 51 (4.5%) | 199 (12.6%) |
| Total | 1,125 (100.0%) | 1,585 (100.0%) |
Families and Households in Concordia
Median Family Size in Concordia
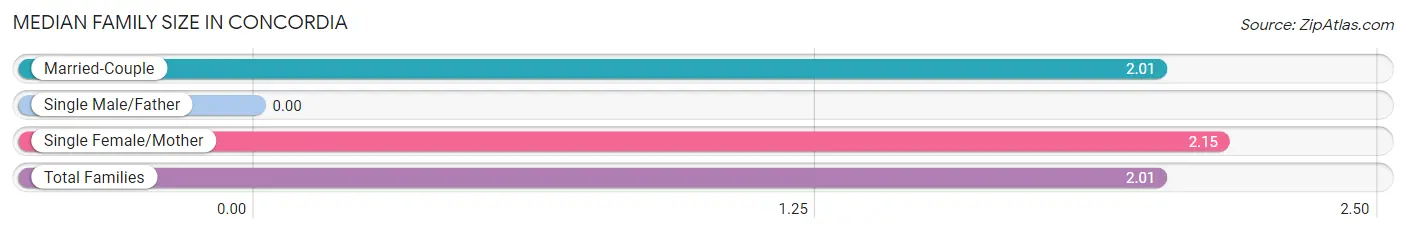
| Family Type | # Families | Family Size |
| Married-Couple | 891 (96.4%) | 2.01 |
| Single Male/Father | 0 (0.0%) | - |
| Single Female/Mother | 33 (3.6%) | 2.15 |
| Total Families | 924 (100.0%) | 2.01 |
Median Household Size in Concordia
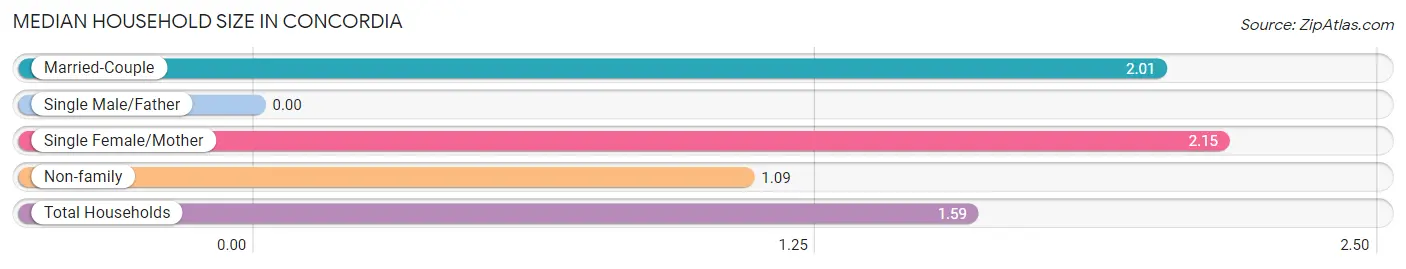
| Household Type | # Households | Household Size |
| Married-Couple | 891 (52.3%) | 2.01 |
| Single Male/Father | 0 (0.0%) | - |
| Single Female/Mother | 33 (1.9%) | 2.15 |
| Non-family | 779 (45.7%) | 1.09 |
| Total Households | 1,703 (100.0%) | 1.59 |
Household Size by Marriage Status in Concordia
Out of a total of 1,703 households in Concordia, 924 (54.3%) are family households, while 779 (45.7%) are nonfamily households. The most numerous type of family households are 2-person households, comprising 903, and the most common type of nonfamily households are 1-person households, comprising 710.
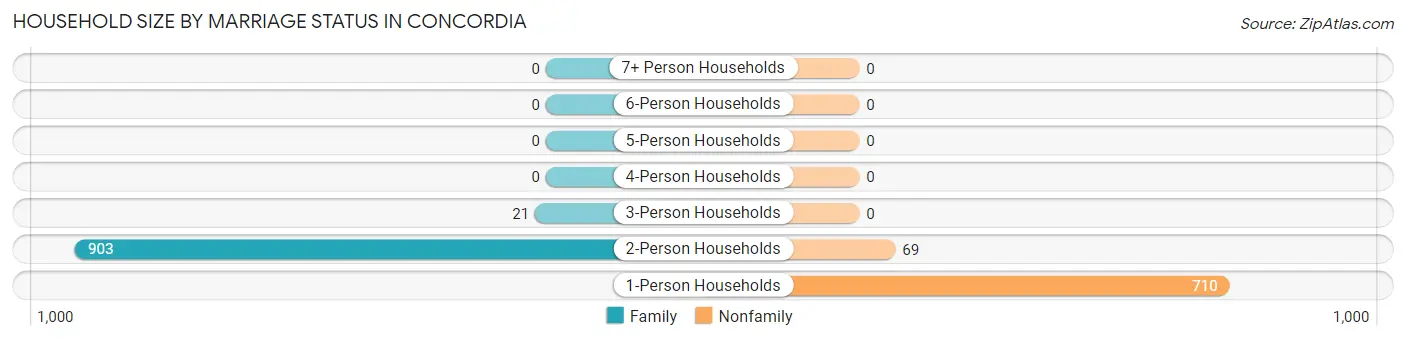
| Household Size | Family Households | Nonfamily Households |
| 1-Person Households | - | 710 (41.7%) |
| 2-Person Households | 903 (53.0%) | 69 (4.1%) |
| 3-Person Households | 21 (1.2%) | 0 (0.0%) |
| 4-Person Households | 0 (0.0%) | 0 (0.0%) |
| 5-Person Households | 0 (0.0%) | 0 (0.0%) |
| 6-Person Households | 0 (0.0%) | 0 (0.0%) |
| 7+ Person Households | 0 (0.0%) | 0 (0.0%) |
| Total | 924 (54.3%) | 779 (45.7%) |
Female Fertility in Concordia
Fertility by Age in Concordia
| Age Bracket | Women with Births | Births / 1,000 Women |
| 15 to 19 years | 0 (0.0%) | 0.0 |
| 20 to 34 years | 0 (0.0%) | 0.0 |
| 35 to 50 years | 0 (0.0%) | 0.0 |
| Total | 0 (0.0%) | 0.0 |
Fertility by Age by Marriage Status in Concordia
| Age Bracket | Married | Unmarried |
| 15 to 19 years | 0 (0.0%) | 0 (0.0%) |
| 20 to 34 years | 0 (0.0%) | 0 (0.0%) |
| 35 to 50 years | 0 (0.0%) | 0 (0.0%) |
| Total | 0 (0.0%) | 0 (0.0%) |
Fertility by Education in Concordia
| Educational Attainment | Women with Births | Births / 1,000 Women |
| Less than High School | 0 (0.0%) | 0.0 |
| High School Diploma | 0 (0.0%) | 0.0 |
| College or Associate's Degree | 0 (0.0%) | 0.0 |
| Bachelor's Degree | 0 (0.0%) | 0.0 |
| Graduate Degree | 0 (0.0%) | 0.0 |
| Total | 0 (0.0%) | 0.0 |
Fertility by Education by Marriage Status in Concordia
| Educational Attainment | Married | Unmarried |
| Less than High School | 0 (0.0%) | 0 (0.0%) |
| High School Diploma | 0 (0.0%) | 0 (0.0%) |
| College or Associate's Degree | 0 (0.0%) | 0 (0.0%) |
| Bachelor's Degree | 0 (0.0%) | 0 (0.0%) |
| Graduate Degree | 0 (0.0%) | 0 (0.0%) |
| Total | 0 (0.0%) | 0 (0.0%) |
Employment Characteristics in Concordia
Employment by Class of Employer in Concordia
Among the 760 employed individuals in Concordia, private company employees (476 | 62.6%), not-for-profit organizations (139 | 18.3%), and local government employees (63 | 8.3%) make up the most common classes of employment.
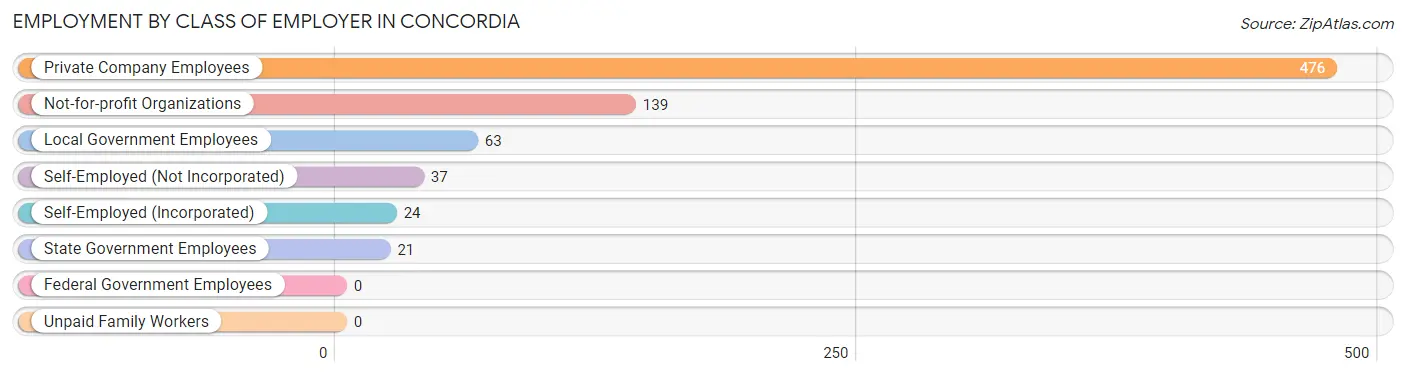
| Employer Class | # Employees | % Employees |
| Private Company Employees | 476 | 62.6% |
| Self-Employed (Incorporated) | 24 | 3.2% |
| Self-Employed (Not Incorporated) | 37 | 4.9% |
| Not-for-profit Organizations | 139 | 18.3% |
| Local Government Employees | 63 | 8.3% |
| State Government Employees | 21 | 2.8% |
| Federal Government Employees | 0 | 0.0% |
| Unpaid Family Workers | 0 | 0.0% |
| Total | 760 | 100.0% |
Employment Status by Age in Concordia
According to the labor force statistics for Concordia, out of the total population over 16 years of age (2,710), 33.0% or 894 individuals are in the labor force, with 11.3% or 101 of them unemployed. The age group with the highest labor force participation rate is 30 to 34 years, with 100.0% or 22 individuals in the labor force. Within the labor force, the 75 years and over age range has the highest percentage of unemployed individuals, with 32.1% or 26 of them being unemployed.
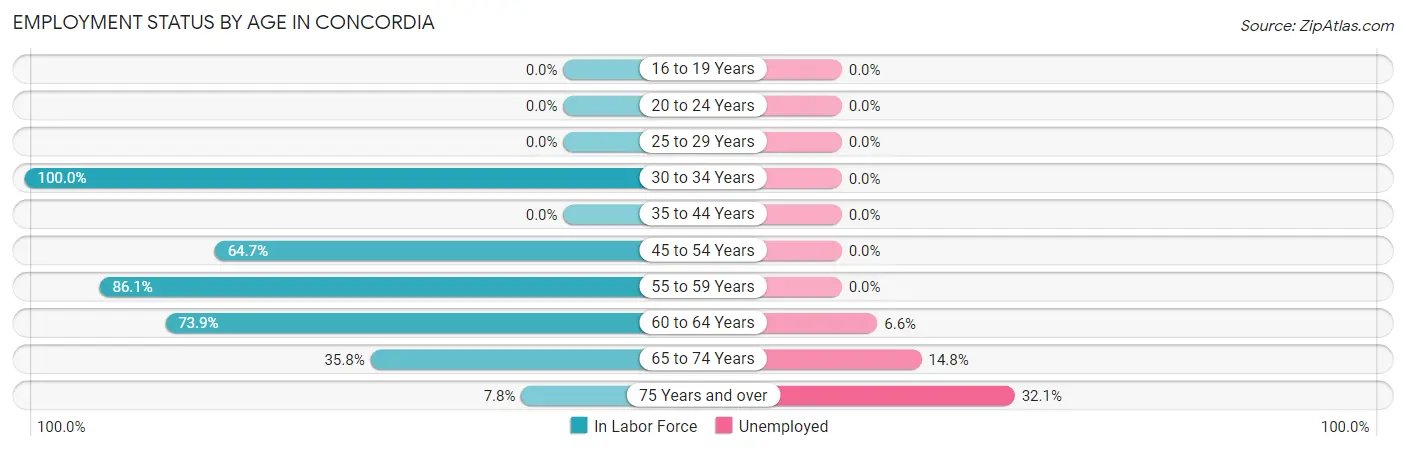
| Age Bracket | In Labor Force | Unemployed |
| 16 to 19 Years | 0 (0.0%) | 0 (0.0%) |
| 20 to 24 Years | 0 (0.0%) | 0 (0.0%) |
| 25 to 29 Years | 0 (0.0%) | 0 (0.0%) |
| 30 to 34 Years | 22 (100.0%) | 0 (0.0%) |
| 35 to 44 Years | 0 (0.0%) | 0 (0.0%) |
| 45 to 54 Years | 44 (64.7%) | 0 (0.0%) |
| 55 to 59 Years | 130 (86.1%) | 0 (0.0%) |
| 60 to 64 Years | 198 (73.9%) | 13 (6.6%) |
| 65 to 74 Years | 418 (35.8%) | 62 (14.8%) |
| 75 Years and over | 81 (7.8%) | 26 (32.1%) |
| Total | 894 (33.0%) | 101 (11.3%) |
Employment Status by Educational Attainment in Concordia
According to labor force statistics for Concordia, 77.4% of individuals (394) out of the total population between 25 and 64 years of age (509) are in the labor force, with 3.3% or 13 of them being unemployed. The group with the highest labor force participation rate are those with the educational attainment of college / associate degree, with 84.7% or 172 individuals in the labor force. Within the labor force, individuals with college / associate degree education have the highest percentage of unemployment, with 7.6% or 13 of them being unemployed.
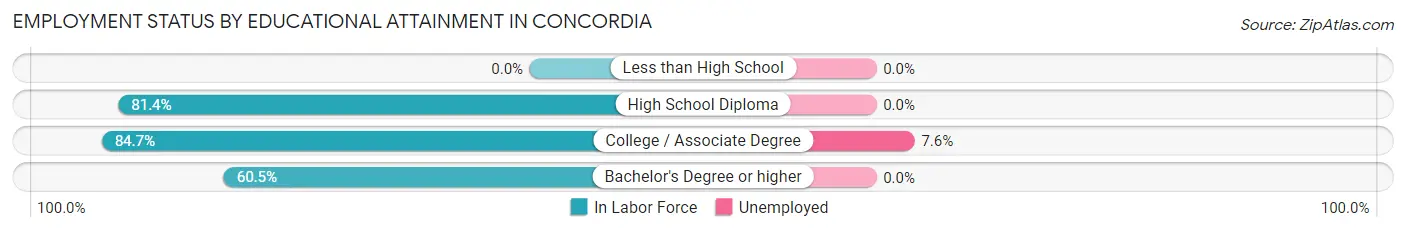
| Educational Attainment | In Labor Force | Unemployed |
| Less than High School | 0 (0.0%) | 0 (0.0%) |
| High School Diploma | 144 (81.4%) | 0 (0.0%) |
| College / Associate Degree | 172 (84.7%) | 15 (7.6%) |
| Bachelor's Degree or higher | 78 (60.5%) | 0 (0.0%) |
| Total | 394 (77.4%) | 17 (3.3%) |
Employment Occupations by Sex in Concordia
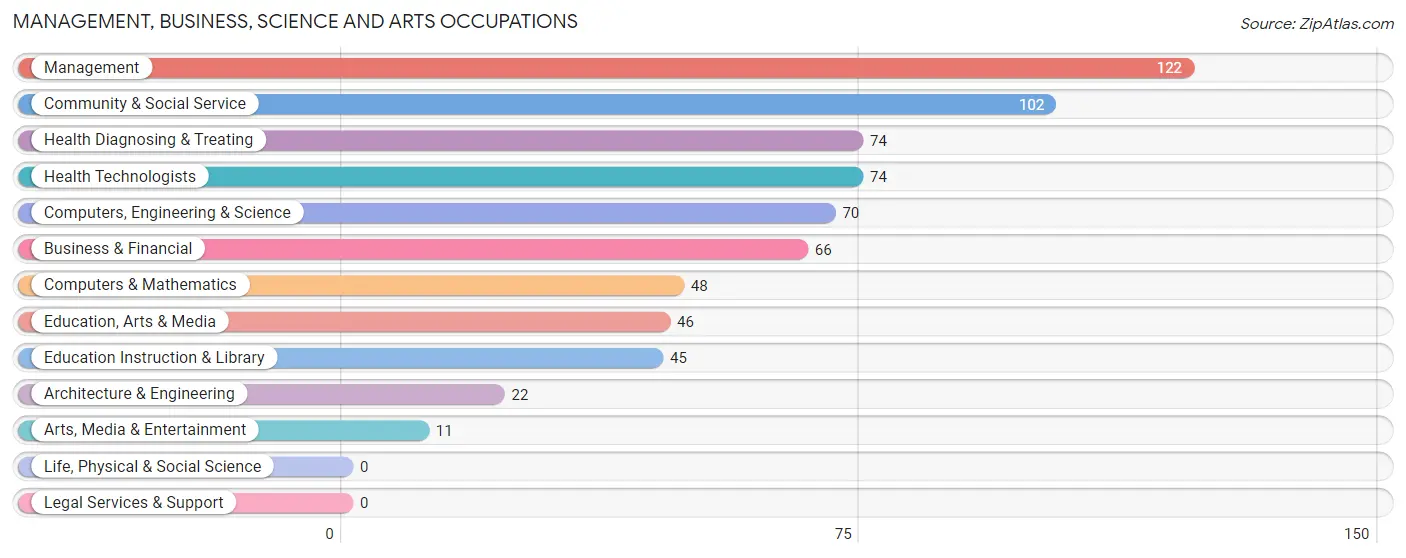
Management, Business, Science and Arts Occupations
The most common Management, Business, Science and Arts occupations in Concordia are Management (122 | 15.4%), Community & Social Service (102 | 12.9%), Health Diagnosing & Treating (74 | 9.3%), Health Technologists (74 | 9.3%), and Computers, Engineering & Science (70 | 8.8%).
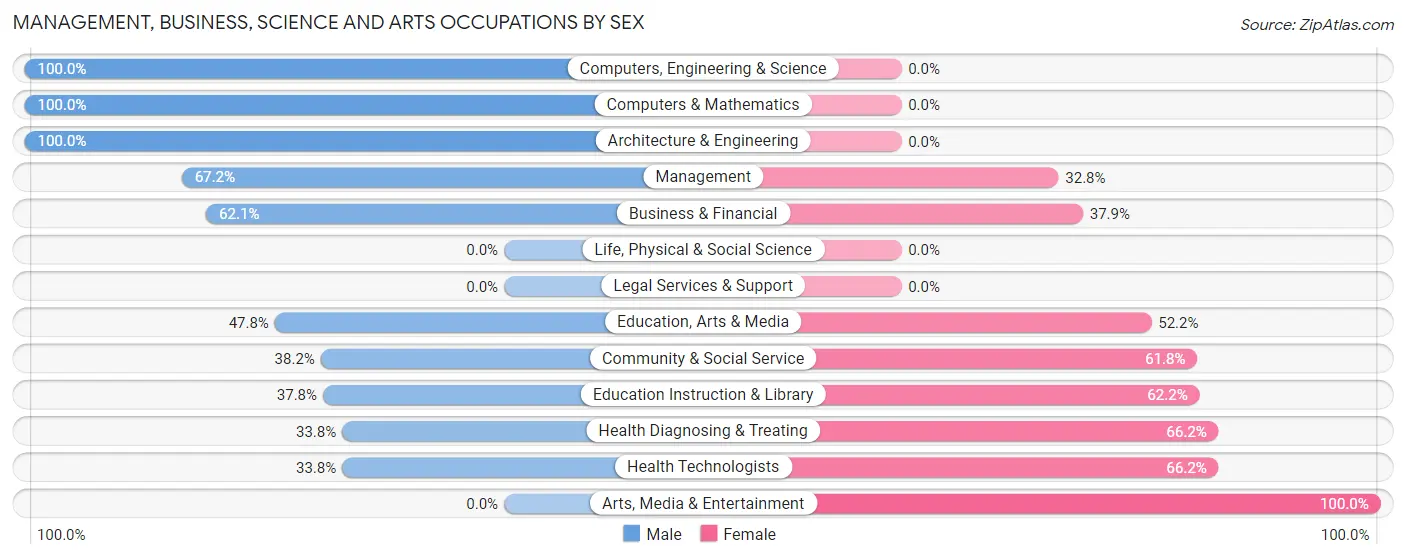
Management, Business, Science and Arts Occupations by Sex
Within the Management, Business, Science and Arts occupations in Concordia, the most male-oriented occupations are Computers, Engineering & Science (100.0%), Computers & Mathematics (100.0%), and Architecture & Engineering (100.0%), while the most female-oriented occupations are Arts, Media & Entertainment (100.0%), Health Diagnosing & Treating (66.2%), and Health Technologists (66.2%).
| Occupation | Male | Female |
| Management | 82 (67.2%) | 40 (32.8%) |
| Business & Financial | 41 (62.1%) | 25 (37.9%) |
| Computers, Engineering & Science | 70 (100.0%) | 0 (0.0%) |
| Computers & Mathematics | 48 (100.0%) | 0 (0.0%) |
| Architecture & Engineering | 22 (100.0%) | 0 (0.0%) |
| Life, Physical & Social Science | 0 (0.0%) | 0 (0.0%) |
| Community & Social Service | 39 (38.2%) | 63 (61.8%) |
| Education, Arts & Media | 22 (47.8%) | 24 (52.2%) |
| Legal Services & Support | 0 (0.0%) | 0 (0.0%) |
| Education Instruction & Library | 17 (37.8%) | 28 (62.2%) |
| Arts, Media & Entertainment | 0 (0.0%) | 11 (100.0%) |
| Health Diagnosing & Treating | 25 (33.8%) | 49 (66.2%) |
| Health Technologists | 25 (33.8%) | 49 (66.2%) |
| Total (Category) | 257 (59.2%) | 177 (40.8%) |
| Total (Overall) | 398 (50.2%) | 394 (49.7%) |
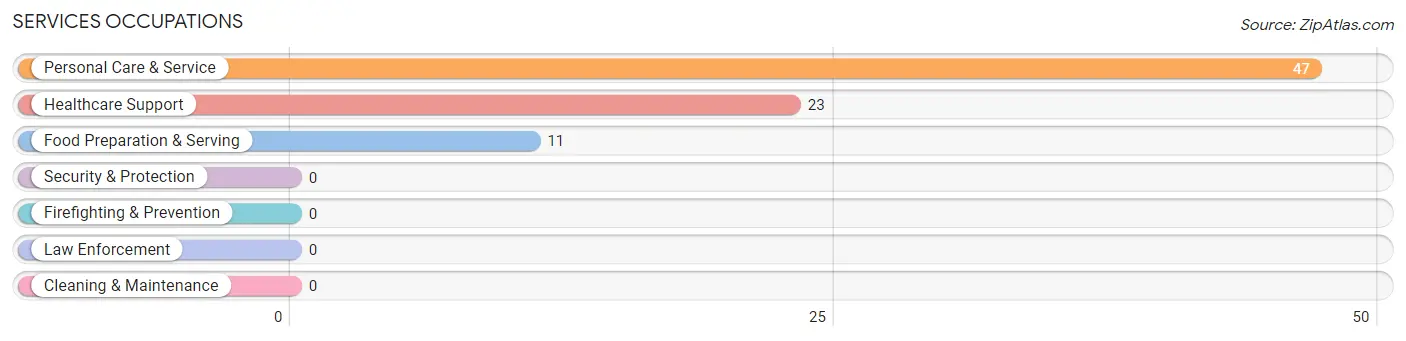
Services Occupations
The most common Services occupations in Concordia are Personal Care & Service (47 | 5.9%), Healthcare Support (23 | 2.9%), and Food Preparation & Serving (11 | 1.4%).
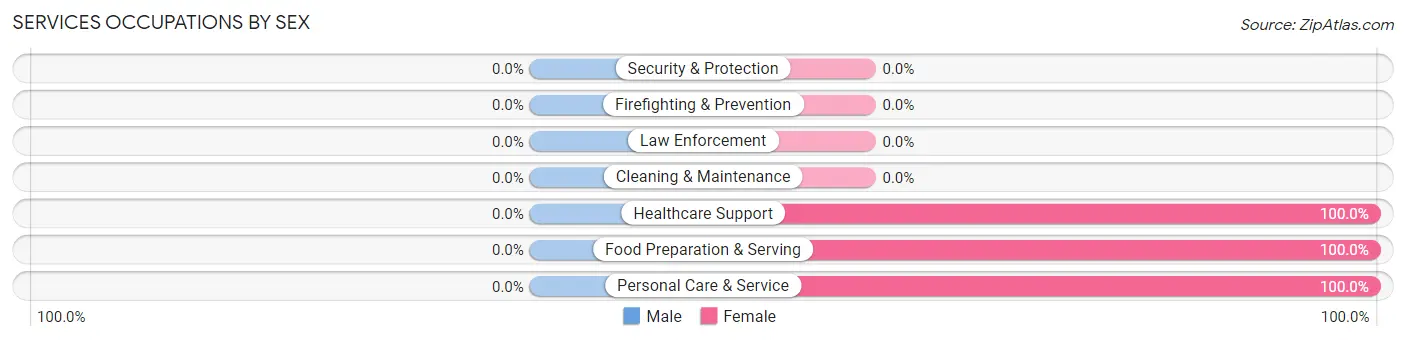
Services Occupations by Sex
| Occupation | Male | Female |
| Healthcare Support | 0 (0.0%) | 23 (100.0%) |
| Security & Protection | 0 (0.0%) | 0 (0.0%) |
| Firefighting & Prevention | 0 (0.0%) | 0 (0.0%) |
| Law Enforcement | 0 (0.0%) | 0 (0.0%) |
| Food Preparation & Serving | 0 (0.0%) | 11 (100.0%) |
| Cleaning & Maintenance | 0 (0.0%) | 0 (0.0%) |
| Personal Care & Service | 0 (0.0%) | 47 (100.0%) |
| Total (Category) | 0 (0.0%) | 81 (100.0%) |
| Total (Overall) | 398 (50.2%) | 394 (49.7%) |
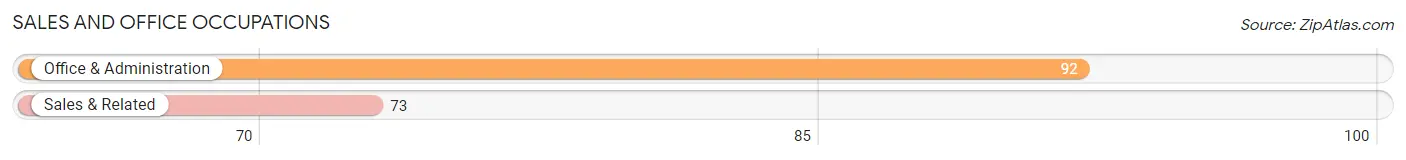
Sales and Office Occupations
The most common Sales and Office occupations in Concordia are Office & Administration (92 | 11.6%), and Sales & Related (73 | 9.2%).
Sales and Office Occupations by Sex
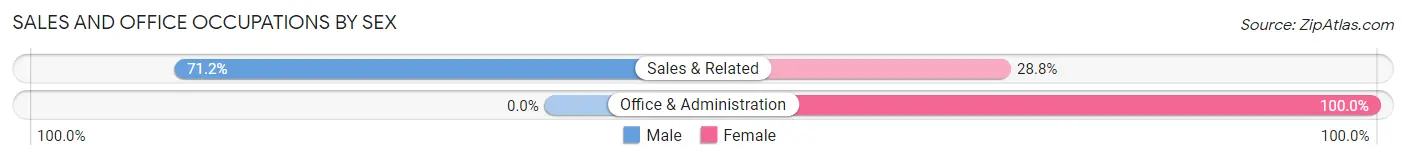
| Occupation | Male | Female |
| Sales & Related | 52 (71.2%) | 21 (28.8%) |
| Office & Administration | 0 (0.0%) | 92 (100.0%) |
| Total (Category) | 52 (31.5%) | 113 (68.5%) |
| Total (Overall) | 398 (50.2%) | 394 (49.7%) |
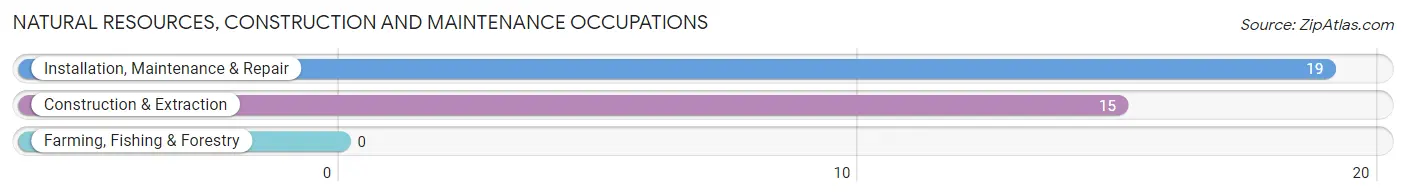
Natural Resources, Construction and Maintenance Occupations
The most common Natural Resources, Construction and Maintenance occupations in Concordia are Installation, Maintenance & Repair (19 | 2.4%), and Construction & Extraction (15 | 1.9%).
Natural Resources, Construction and Maintenance Occupations by Sex
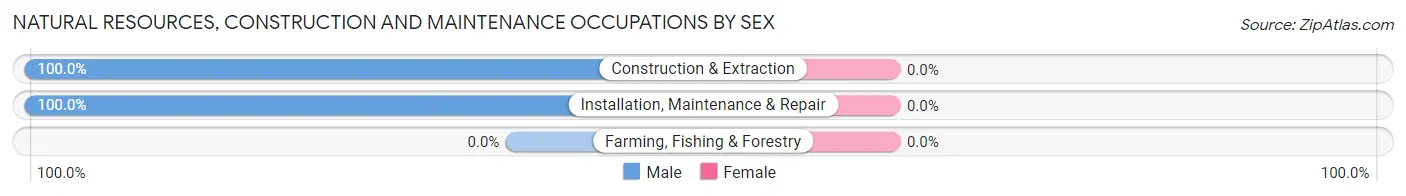
| Occupation | Male | Female |
| Farming, Fishing & Forestry | 0 (0.0%) | 0 (0.0%) |
| Construction & Extraction | 15 (100.0%) | 0 (0.0%) |
| Installation, Maintenance & Repair | 19 (100.0%) | 0 (0.0%) |
| Total (Category) | 34 (100.0%) | 0 (0.0%) |
| Total (Overall) | 398 (50.2%) | 394 (49.7%) |
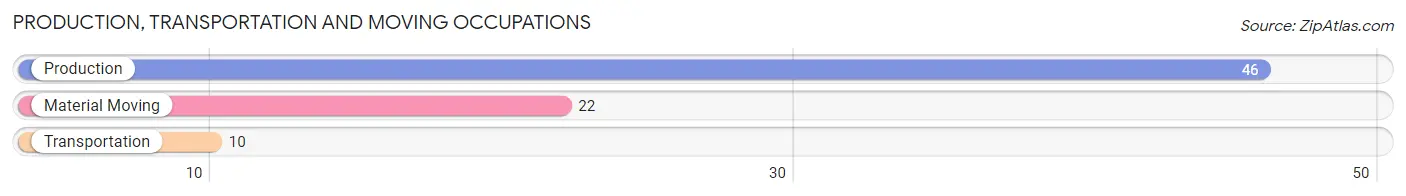
Production, Transportation and Moving Occupations
The most common Production, Transportation and Moving occupations in Concordia are Production (46 | 5.8%), Material Moving (22 | 2.8%), and Transportation (10 | 1.3%).
Production, Transportation and Moving Occupations by Sex
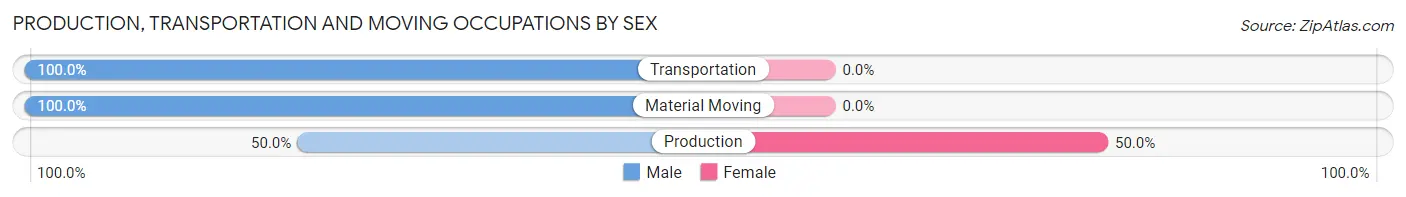
| Occupation | Male | Female |
| Production | 23 (50.0%) | 23 (50.0%) |
| Transportation | 10 (100.0%) | 0 (0.0%) |
| Material Moving | 22 (100.0%) | 0 (0.0%) |
| Total (Category) | 55 (70.5%) | 23 (29.5%) |
| Total (Overall) | 398 (50.2%) | 394 (49.7%) |
Employment Industries by Sex in Concordia
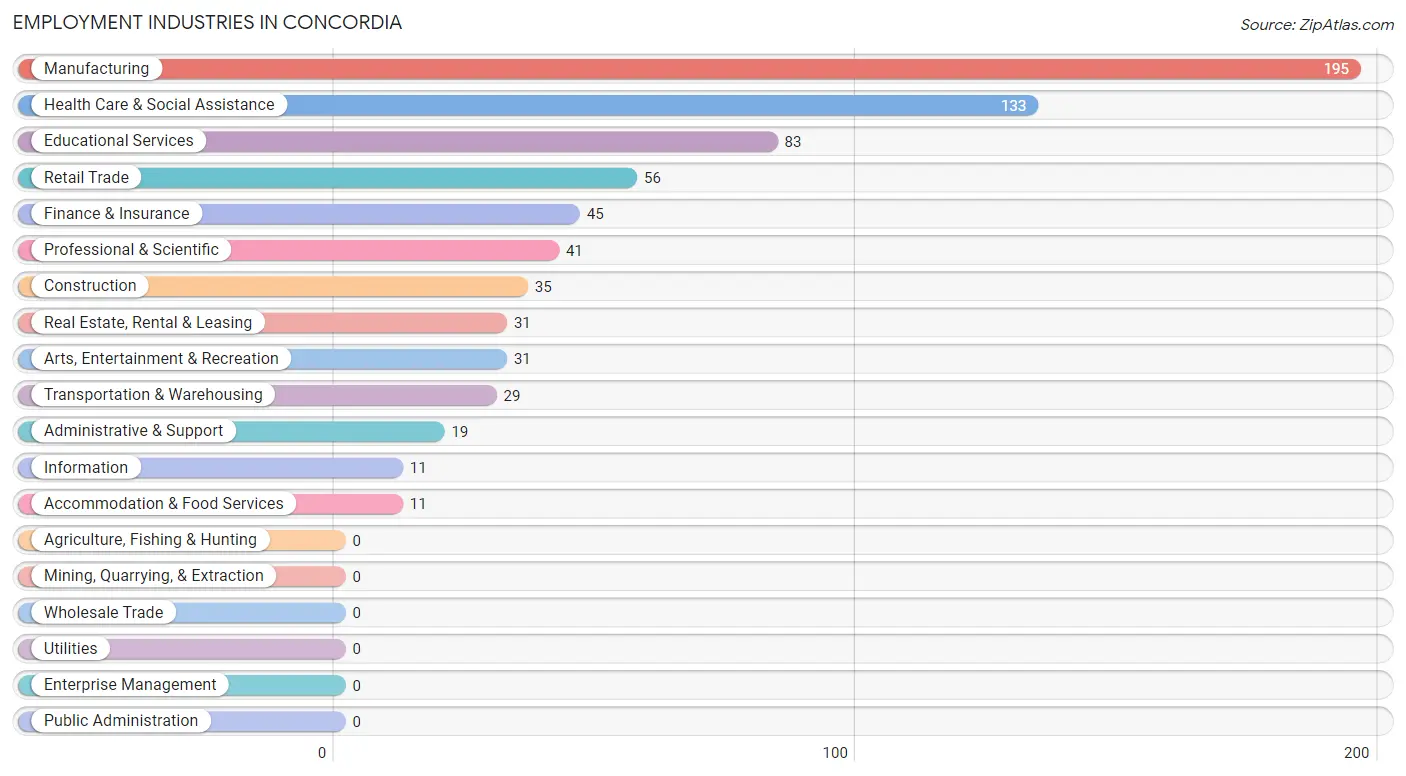
Employment Industries in Concordia
The major employment industries in Concordia include Manufacturing (195 | 24.6%), Health Care & Social Assistance (133 | 16.8%), Educational Services (83 | 10.5%), Retail Trade (56 | 7.1%), and Finance & Insurance (45 | 5.7%).
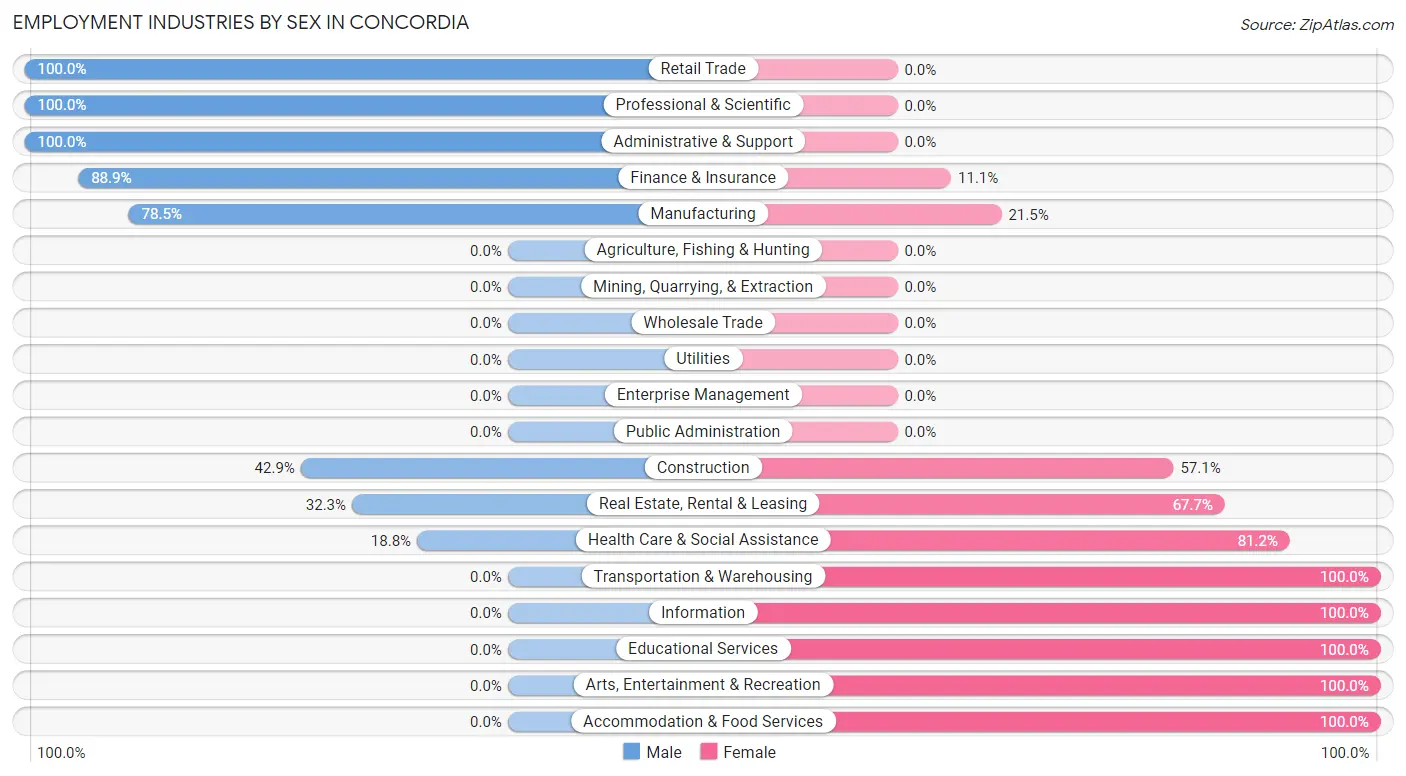
Employment Industries by Sex in Concordia
The Concordia industries that see more men than women are Retail Trade (100.0%), Professional & Scientific (100.0%), and Administrative & Support (100.0%), whereas the industries that tend to have a higher number of women are Transportation & Warehousing (100.0%), Information (100.0%), and Educational Services (100.0%).
| Industry | Male | Female |
| Agriculture, Fishing & Hunting | 0 (0.0%) | 0 (0.0%) |
| Mining, Quarrying, & Extraction | 0 (0.0%) | 0 (0.0%) |
| Construction | 15 (42.9%) | 20 (57.1%) |
| Manufacturing | 153 (78.5%) | 42 (21.5%) |
| Wholesale Trade | 0 (0.0%) | 0 (0.0%) |
| Retail Trade | 56 (100.0%) | 0 (0.0%) |
| Transportation & Warehousing | 0 (0.0%) | 29 (100.0%) |
| Utilities | 0 (0.0%) | 0 (0.0%) |
| Information | 0 (0.0%) | 11 (100.0%) |
| Finance & Insurance | 40 (88.9%) | 5 (11.1%) |
| Real Estate, Rental & Leasing | 10 (32.3%) | 21 (67.7%) |
| Professional & Scientific | 41 (100.0%) | 0 (0.0%) |
| Enterprise Management | 0 (0.0%) | 0 (0.0%) |
| Administrative & Support | 19 (100.0%) | 0 (0.0%) |
| Educational Services | 0 (0.0%) | 83 (100.0%) |
| Health Care & Social Assistance | 25 (18.8%) | 108 (81.2%) |
| Arts, Entertainment & Recreation | 0 (0.0%) | 31 (100.0%) |
| Accommodation & Food Services | 0 (0.0%) | 11 (100.0%) |
| Public Administration | 0 (0.0%) | 0 (0.0%) |
| Total | 398 (50.2%) | 394 (49.7%) |
Education in Concordia
School Enrollment in Concordia
| School Level | # Students | % Students |
| Nursery / Preschool | 0 | 0.0% |
| Kindergarten | 0 | 0.0% |
| Elementary School | 0 | 0.0% |
| Middle School | 0 | 0.0% |
| High School | 0 | 0.0% |
| College / Undergraduate | 0 | 0.0% |
| Graduate / Professional | 0 | 0.0% |
| Total | 0 | 0.0% |
School Enrollment by Age by Funding Source in Concordia
| Age Bracket | Public School | Private School |
| 3 to 4 Year Olds | 0 (0.0%) | 0 (0.0%) |
| 5 to 9 Year Old | 0 (0.0%) | 0 (0.0%) |
| 10 to 14 Year Olds | 0 (0.0%) | 0 (0.0%) |
| 15 to 17 Year Olds | 0 (0.0%) | 0 (0.0%) |
| 18 to 19 Year Olds | 0 (0.0%) | 0 (0.0%) |
| 20 to 24 Year Olds | 0 (0.0%) | 0 (0.0%) |
| 25 to 34 Year Olds | 0 (0.0%) | 0 (0.0%) |
| 35 Years and over | 0 (0.0%) | 0 (0.0%) |
| Total | 0 (0.0%) | 0 (0.0%) |
Educational Attainment by Field of Study in Concordia
Education (347 | 30.4%), science & technology (173 | 15.1%), business (169 | 14.8%), psychology (100 | 8.8%), and engineering (61 | 5.3%) are the most common fields of study among 1,142 individuals in Concordia who have obtained a bachelor's degree or higher.
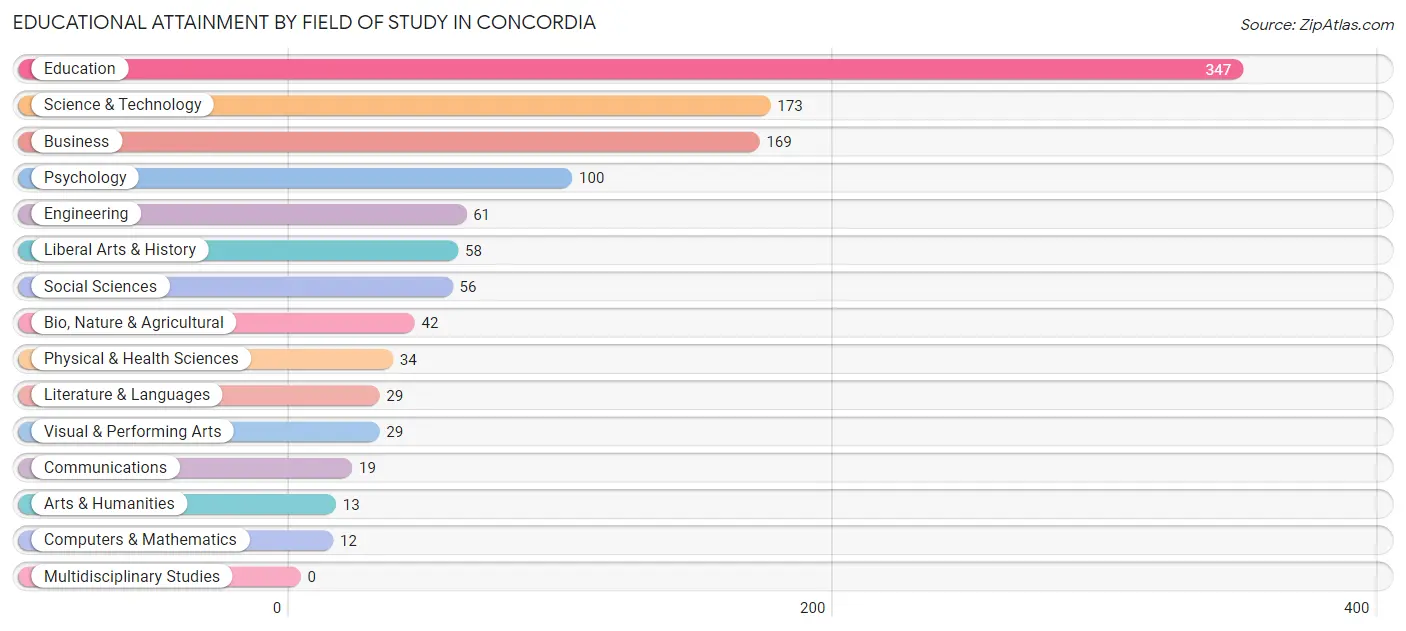
| Field of Study | # Graduates | % Graduates |
| Computers & Mathematics | 12 | 1.1% |
| Bio, Nature & Agricultural | 42 | 3.7% |
| Physical & Health Sciences | 34 | 3.0% |
| Psychology | 100 | 8.8% |
| Social Sciences | 56 | 4.9% |
| Engineering | 61 | 5.3% |
| Multidisciplinary Studies | 0 | 0.0% |
| Science & Technology | 173 | 15.1% |
| Business | 169 | 14.8% |
| Education | 347 | 30.4% |
| Literature & Languages | 29 | 2.5% |
| Liberal Arts & History | 58 | 5.1% |
| Visual & Performing Arts | 29 | 2.5% |
| Communications | 19 | 1.7% |
| Arts & Humanities | 13 | 1.1% |
| Total | 1,142 | 100.0% |
Transportation & Commute in Concordia
Vehicle Availability by Sex in Concordia
The most prevalent vehicle ownership categories in Concordia are males with 2 vehicles (301, accounting for 75.6%) and females with 2 vehicles (222, making up 83.2%).
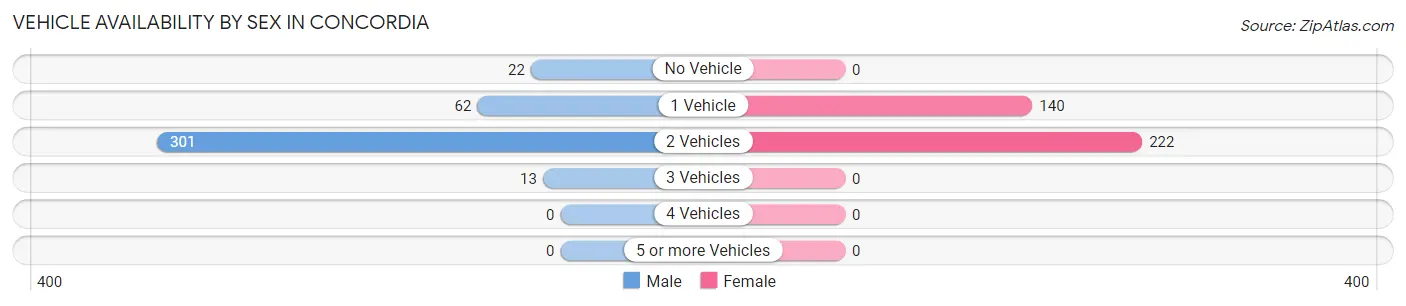
| Vehicles Available | Male | Female |
| No Vehicle | 22 (5.5%) | 0 (0.0%) |
| 1 Vehicle | 62 (15.6%) | 140 (38.7%) |
| 2 Vehicles | 301 (75.6%) | 222 (61.3%) |
| 3 Vehicles | 13 (3.3%) | 0 (0.0%) |
| 4 Vehicles | 0 (0.0%) | 0 (0.0%) |
| 5 or more Vehicles | 0 (0.0%) | 0 (0.0%) |
| Total | 398 (100.0%) | 362 (100.0%) |
Commute Time in Concordia
The most frequently occuring commute durations in Concordia are 20 to 24 minutes (153 commuters, 22.8%), 60 to 89 minutes (122 commuters, 18.2%), and 25 to 29 minutes (101 commuters, 15.1%).
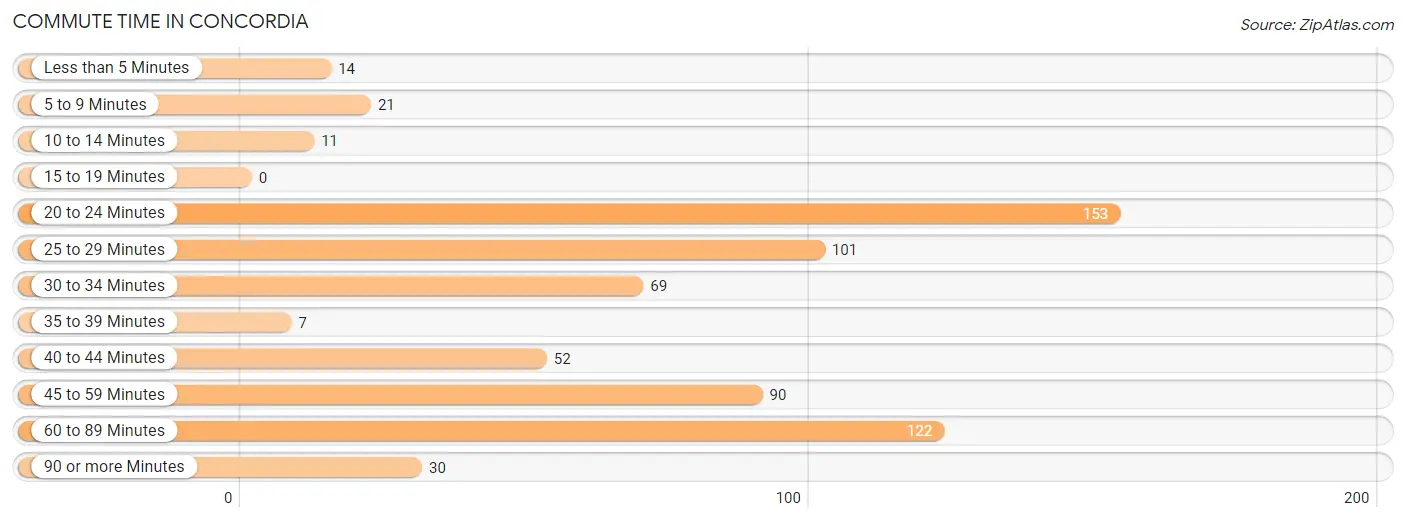
| Commute Time | # Commuters | % Commuters |
| Less than 5 Minutes | 14 | 2.1% |
| 5 to 9 Minutes | 21 | 3.1% |
| 10 to 14 Minutes | 11 | 1.6% |
| 15 to 19 Minutes | 0 | 0.0% |
| 20 to 24 Minutes | 153 | 22.8% |
| 25 to 29 Minutes | 101 | 15.1% |
| 30 to 34 Minutes | 69 | 10.3% |
| 35 to 39 Minutes | 7 | 1.0% |
| 40 to 44 Minutes | 52 | 7.8% |
| 45 to 59 Minutes | 90 | 13.4% |
| 60 to 89 Minutes | 122 | 18.2% |
| 90 or more Minutes | 30 | 4.5% |
Commute Time by Sex in Concordia
The most common commute times in Concordia are 60 to 89 minutes (97 commuters, 30.4%) for males and 20 to 24 minutes (93 commuters, 26.5%) for females.
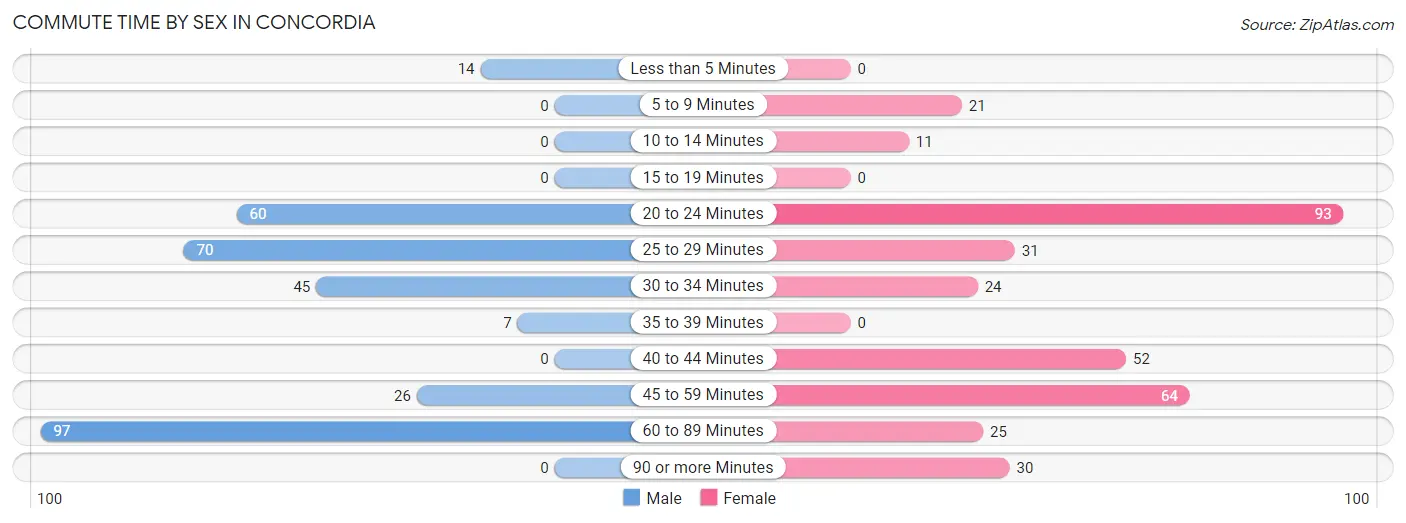
| Commute Time | Male | Female |
| Less than 5 Minutes | 14 (4.4%) | 0 (0.0%) |
| 5 to 9 Minutes | 0 (0.0%) | 21 (6.0%) |
| 10 to 14 Minutes | 0 (0.0%) | 11 (3.1%) |
| 15 to 19 Minutes | 0 (0.0%) | 0 (0.0%) |
| 20 to 24 Minutes | 60 (18.8%) | 93 (26.5%) |
| 25 to 29 Minutes | 70 (21.9%) | 31 (8.8%) |
| 30 to 34 Minutes | 45 (14.1%) | 24 (6.8%) |
| 35 to 39 Minutes | 7 (2.2%) | 0 (0.0%) |
| 40 to 44 Minutes | 0 (0.0%) | 52 (14.8%) |
| 45 to 59 Minutes | 26 (8.2%) | 64 (18.2%) |
| 60 to 89 Minutes | 97 (30.4%) | 25 (7.1%) |
| 90 or more Minutes | 0 (0.0%) | 30 (8.6%) |
Time of Departure to Work by Sex in Concordia
The most frequent times of departure to work in Concordia are 5:00 AM to 5:29 AM (81, 25.4%) for males and 6:30 AM to 6:59 AM (105, 29.9%) for females.
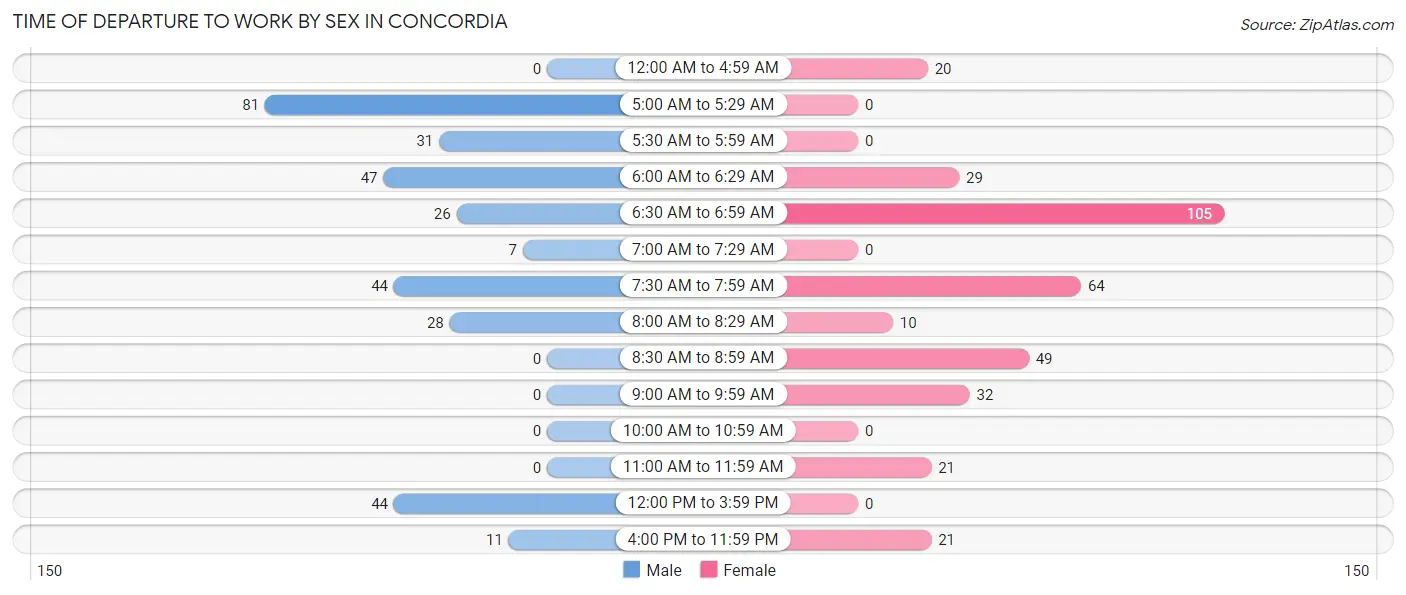
| Time of Departure | Male | Female |
| 12:00 AM to 4:59 AM | 0 (0.0%) | 20 (5.7%) |
| 5:00 AM to 5:29 AM | 81 (25.4%) | 0 (0.0%) |
| 5:30 AM to 5:59 AM | 31 (9.7%) | 0 (0.0%) |
| 6:00 AM to 6:29 AM | 47 (14.7%) | 29 (8.3%) |
| 6:30 AM to 6:59 AM | 26 (8.2%) | 105 (29.9%) |
| 7:00 AM to 7:29 AM | 7 (2.2%) | 0 (0.0%) |
| 7:30 AM to 7:59 AM | 44 (13.8%) | 64 (18.2%) |
| 8:00 AM to 8:29 AM | 28 (8.8%) | 10 (2.9%) |
| 8:30 AM to 8:59 AM | 0 (0.0%) | 49 (14.0%) |
| 9:00 AM to 9:59 AM | 0 (0.0%) | 32 (9.1%) |
| 10:00 AM to 10:59 AM | 0 (0.0%) | 0 (0.0%) |
| 11:00 AM to 11:59 AM | 0 (0.0%) | 21 (6.0%) |
| 12:00 PM to 3:59 PM | 44 (13.8%) | 0 (0.0%) |
| 4:00 PM to 11:59 PM | 11 (3.5%) | 21 (6.0%) |
| Total | 319 (100.0%) | 351 (100.0%) |
Housing Occupancy in Concordia
Occupancy by Ownership in Concordia
Of the total 1,703 dwellings in Concordia, owner-occupied units account for 1,514 (88.9%), while renter-occupied units make up 189 (11.1%).
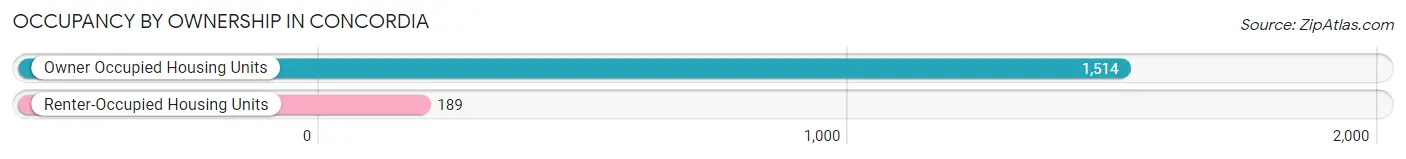
| Occupancy | # Housing Units | % Housing Units |
| Owner Occupied Housing Units | 1,514 | 88.9% |
| Renter-Occupied Housing Units | 189 | 11.1% |
| Total Occupied Housing Units | 1,703 | 100.0% |
Occupancy by Household Size in Concordia
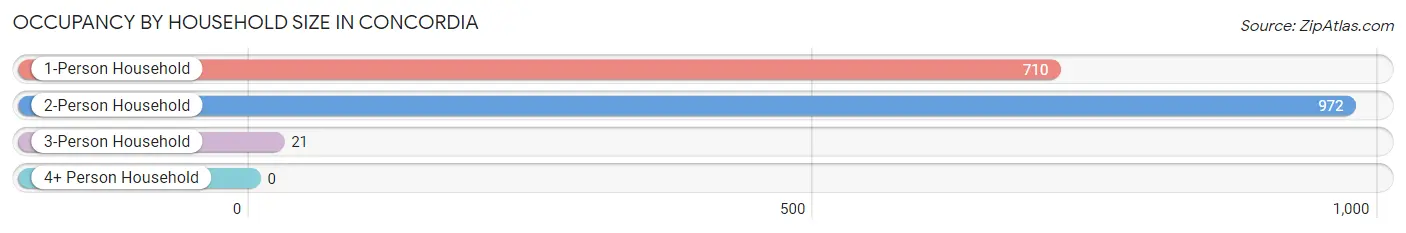
| Household Size | # Housing Units | % Housing Units |
| 1-Person Household | 710 | 41.7% |
| 2-Person Household | 972 | 57.1% |
| 3-Person Household | 21 | 1.2% |
| 4+ Person Household | 0 | 0.0% |
| Total Housing Units | 1,703 | 100.0% |
Occupancy by Ownership by Household Size in Concordia
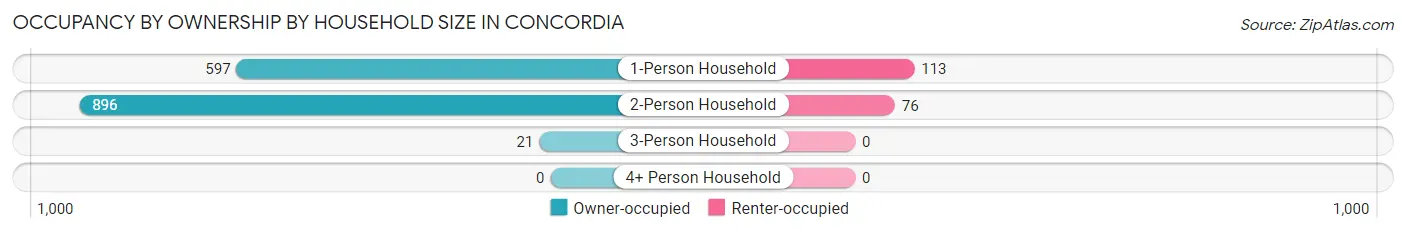
| Household Size | Owner-occupied | Renter-occupied |
| 1-Person Household | 597 (84.1%) | 113 (15.9%) |
| 2-Person Household | 896 (92.2%) | 76 (7.8%) |
| 3-Person Household | 21 (100.0%) | 0 (0.0%) |
| 4+ Person Household | 0 (0.0%) | 0 (0.0%) |
| Total Housing Units | 1,514 (88.9%) | 189 (11.1%) |
Occupancy by Educational Attainment in Concordia
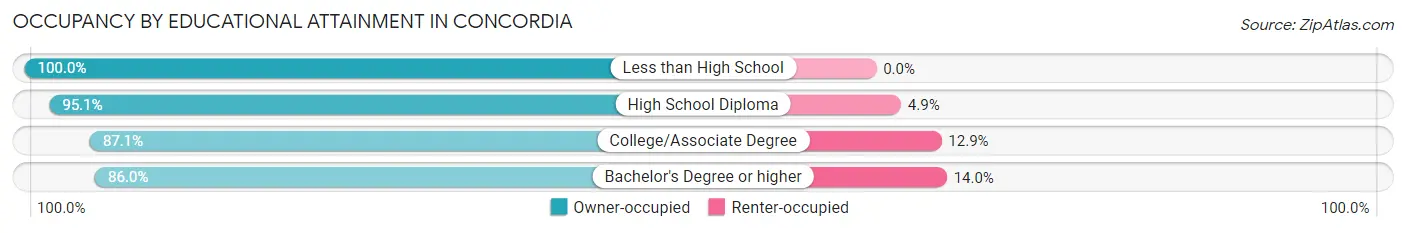
| Household Size | Owner-occupied | Renter-occupied |
| Less than High School | 49 (100.0%) | 0 (0.0%) |
| High School Diploma | 369 (95.1%) | 19 (4.9%) |
| College/Associate Degree | 579 (87.1%) | 86 (12.9%) |
| Bachelor's Degree or higher | 517 (86.0%) | 84 (14.0%) |
Occupancy by Age of Householder in Concordia
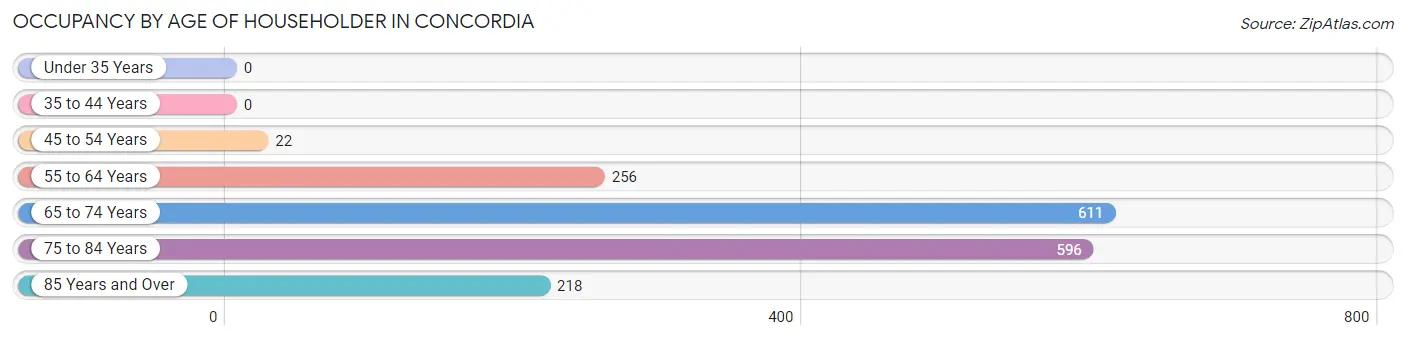
| Age Bracket | # Households | % Households |
| Under 35 Years | 0 | 0.0% |
| 35 to 44 Years | 0 | 0.0% |
| 45 to 54 Years | 22 | 1.3% |
| 55 to 64 Years | 256 | 15.0% |
| 65 to 74 Years | 611 | 35.9% |
| 75 to 84 Years | 596 | 35.0% |
| 85 Years and Over | 218 | 12.8% |
| Total | 1,703 | 100.0% |
Housing Finances in Concordia
Median Income by Occupancy in Concordia
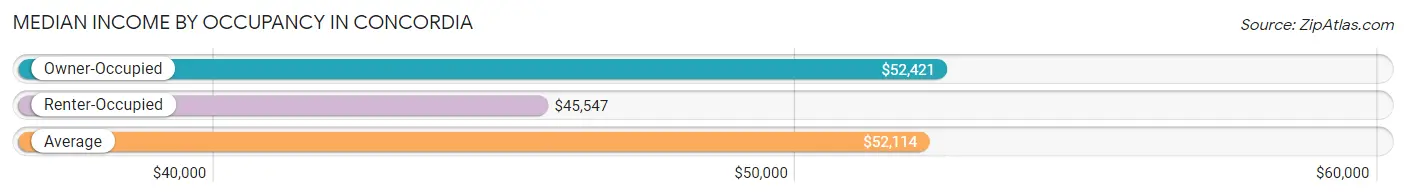
| Occupancy Type | # Households | Median Income |
| Owner-Occupied | 1,514 (88.9%) | $52,421 |
| Renter-Occupied | 189 (11.1%) | $45,547 |
| Average | 1,703 (100.0%) | $52,114 |
Occupancy by Householder Income Bracket in Concordia
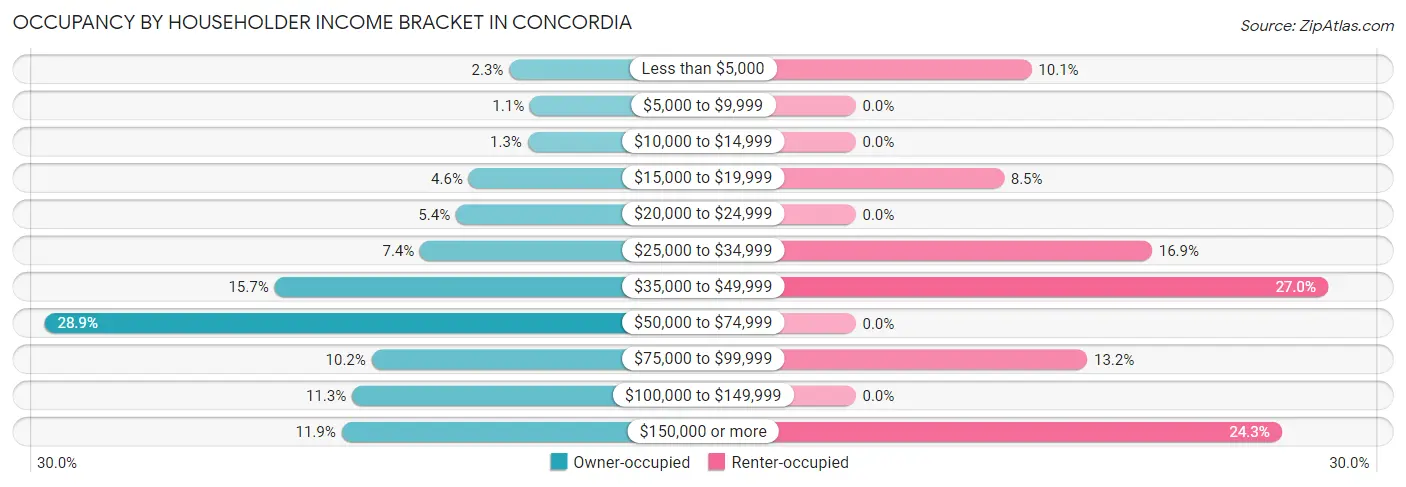
| Income Bracket | Owner-occupied | Renter-occupied |
| Less than $5,000 | 35 (2.3%) | 19 (10.1%) |
| $5,000 to $9,999 | 17 (1.1%) | 0 (0.0%) |
| $10,000 to $14,999 | 19 (1.3%) | 0 (0.0%) |
| $15,000 to $19,999 | 70 (4.6%) | 16 (8.5%) |
| $20,000 to $24,999 | 81 (5.3%) | 0 (0.0%) |
| $25,000 to $34,999 | 112 (7.4%) | 32 (16.9%) |
| $35,000 to $49,999 | 238 (15.7%) | 51 (27.0%) |
| $50,000 to $74,999 | 437 (28.9%) | 0 (0.0%) |
| $75,000 to $99,999 | 154 (10.2%) | 25 (13.2%) |
| $100,000 to $149,999 | 171 (11.3%) | 0 (0.0%) |
| $150,000 or more | 180 (11.9%) | 46 (24.3%) |
| Total | 1,514 (100.0%) | 189 (100.0%) |
Monthly Housing Cost Tiers in Concordia
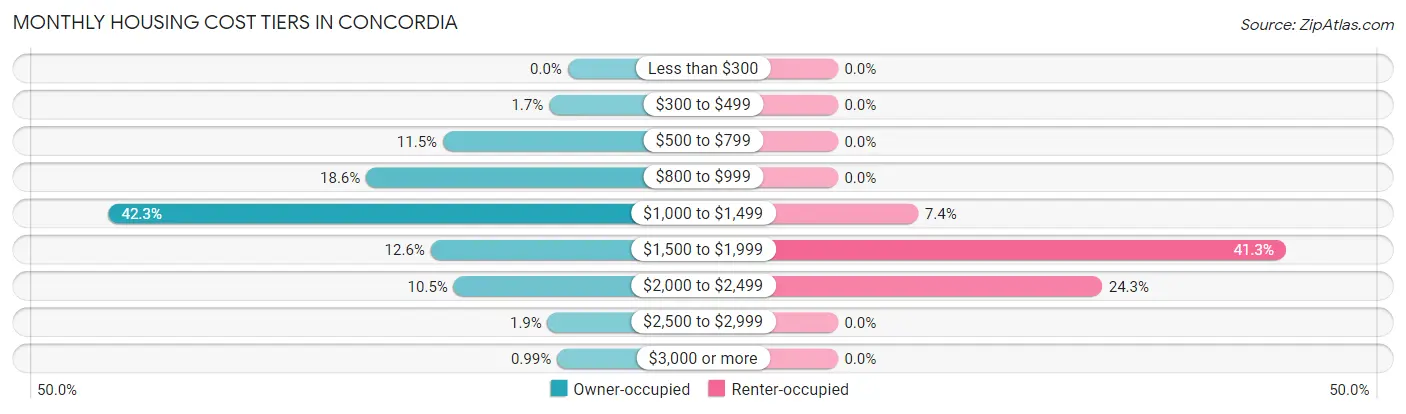
| Monthly Cost | Owner-occupied | Renter-occupied |
| Less than $300 | 0 (0.0%) | 0 (0.0%) |
| $300 to $499 | 26 (1.7%) | 0 (0.0%) |
| $500 to $799 | 174 (11.5%) | 0 (0.0%) |
| $800 to $999 | 281 (18.6%) | 0 (0.0%) |
| $1,000 to $1,499 | 640 (42.3%) | 14 (7.4%) |
| $1,500 to $1,999 | 191 (12.6%) | 78 (41.3%) |
| $2,000 to $2,499 | 159 (10.5%) | 46 (24.3%) |
| $2,500 to $2,999 | 28 (1.8%) | 0 (0.0%) |
| $3,000 or more | 15 (1.0%) | 0 (0.0%) |
| Total | 1,514 (100.0%) | 189 (100.0%) |
Physical Housing Characteristics in Concordia
Housing Structures in Concordia
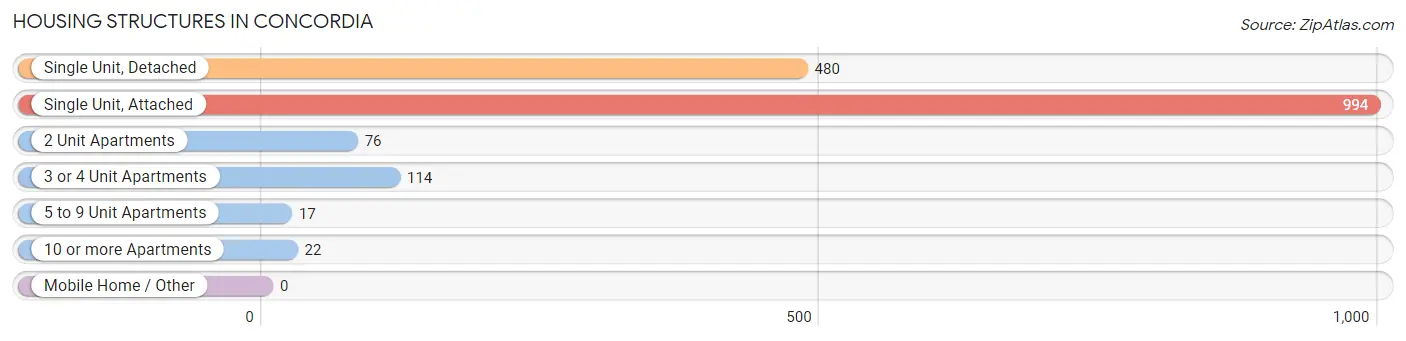
| Structure Type | # Housing Units | % Housing Units |
| Single Unit, Detached | 480 | 28.2% |
| Single Unit, Attached | 994 | 58.4% |
| 2 Unit Apartments | 76 | 4.5% |
| 3 or 4 Unit Apartments | 114 | 6.7% |
| 5 to 9 Unit Apartments | 17 | 1.0% |
| 10 or more Apartments | 22 | 1.3% |
| Mobile Home / Other | 0 | 0.0% |
| Total | 1,703 | 100.0% |
Housing Structures by Occupancy in Concordia
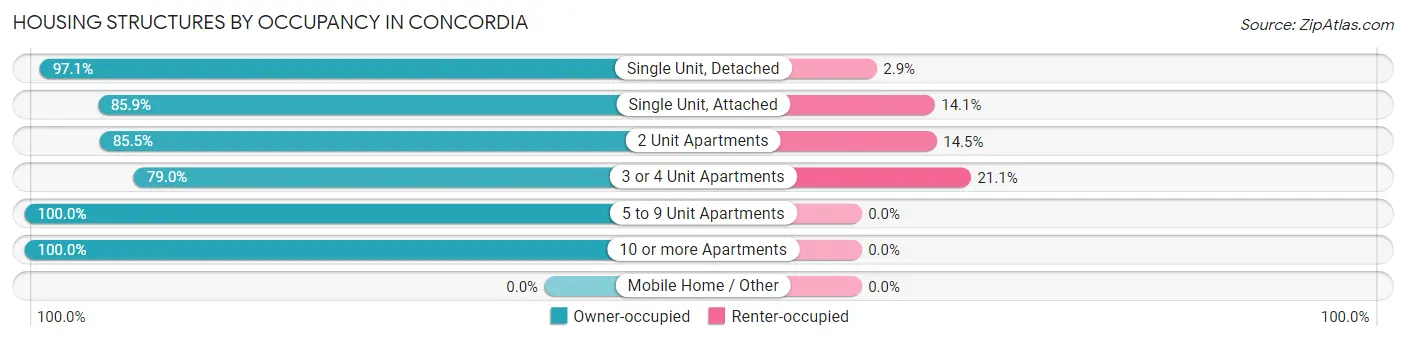
| Structure Type | Owner-occupied | Renter-occupied |
| Single Unit, Detached | 466 (97.1%) | 14 (2.9%) |
| Single Unit, Attached | 854 (85.9%) | 140 (14.1%) |
| 2 Unit Apartments | 65 (85.5%) | 11 (14.5%) |
| 3 or 4 Unit Apartments | 90 (78.9%) | 24 (21.0%) |
| 5 to 9 Unit Apartments | 17 (100.0%) | 0 (0.0%) |
| 10 or more Apartments | 22 (100.0%) | 0 (0.0%) |
| Mobile Home / Other | 0 (0.0%) | 0 (0.0%) |
| Total | 1,514 (88.9%) | 189 (11.1%) |
Housing Structures by Number of Rooms in Concordia
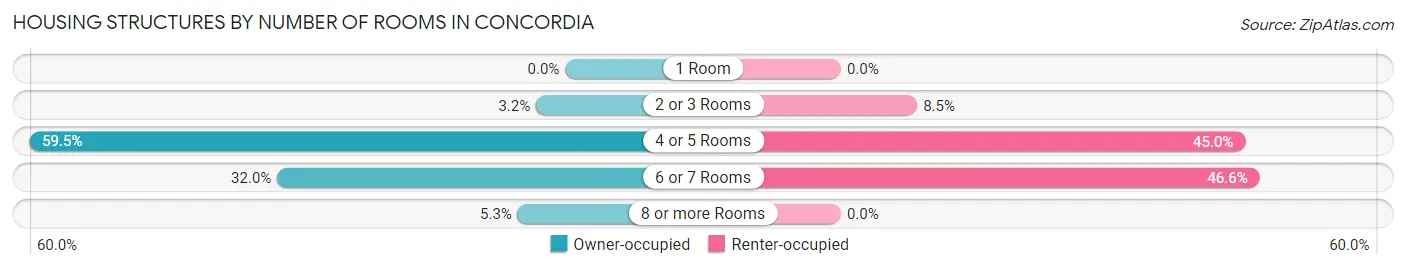
| Number of Rooms | Owner-occupied | Renter-occupied |
| 1 Room | 0 (0.0%) | 0 (0.0%) |
| 2 or 3 Rooms | 49 (3.2%) | 16 (8.5%) |
| 4 or 5 Rooms | 901 (59.5%) | 85 (45.0%) |
| 6 or 7 Rooms | 484 (32.0%) | 88 (46.6%) |
| 8 or more Rooms | 80 (5.3%) | 0 (0.0%) |
| Total | 1,514 (100.0%) | 189 (100.0%) |
Housing Structure by Heating Type in Concordia
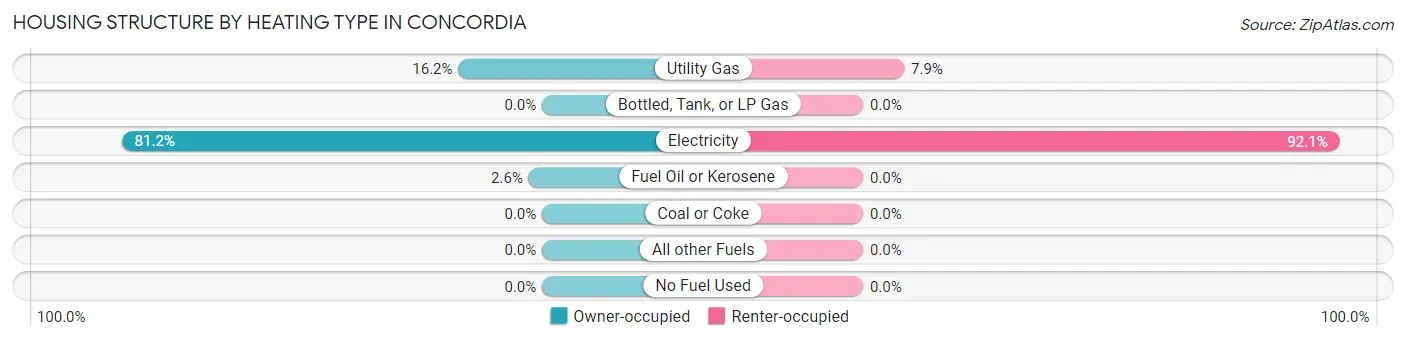
| Heating Type | Owner-occupied | Renter-occupied |
| Utility Gas | 245 (16.2%) | 15 (7.9%) |
| Bottled, Tank, or LP Gas | 0 (0.0%) | 0 (0.0%) |
| Electricity | 1,230 (81.2%) | 174 (92.1%) |
| Fuel Oil or Kerosene | 39 (2.6%) | 0 (0.0%) |
| Coal or Coke | 0 (0.0%) | 0 (0.0%) |
| All other Fuels | 0 (0.0%) | 0 (0.0%) |
| No Fuel Used | 0 (0.0%) | 0 (0.0%) |
| Total | 1,514 (100.0%) | 189 (100.0%) |
Household Vehicle Usage in Concordia
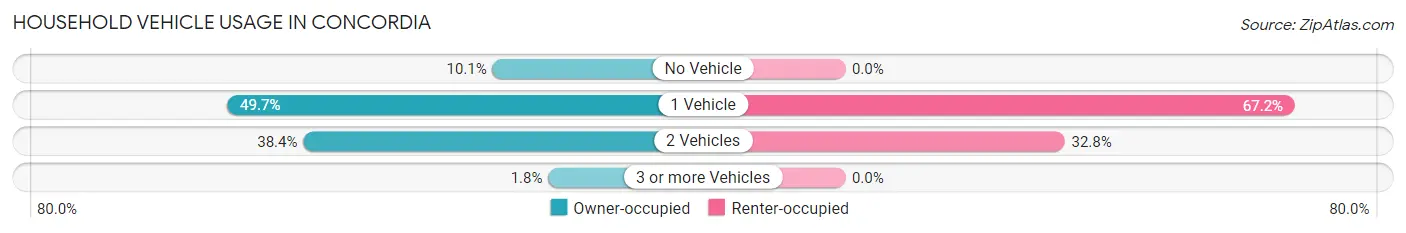
| Vehicles per Household | Owner-occupied | Renter-occupied |
| No Vehicle | 153 (10.1%) | 0 (0.0%) |
| 1 Vehicle | 753 (49.7%) | 127 (67.2%) |
| 2 Vehicles | 581 (38.4%) | 62 (32.8%) |
| 3 or more Vehicles | 27 (1.8%) | 0 (0.0%) |
| Total | 1,514 (100.0%) | 189 (100.0%) |
Real Estate & Mortgages in Concordia
Real Estate and Mortgage Overview in Concordia
| Characteristic | Without Mortgage | With Mortgage |
| Housing Units | 748 | 766 |
| Median Property Value | $256,300 | $286,800 |
| Median Household Income | $53,462 | $91 |
| Monthly Housing Costs | $984 | $15 |
| Real Estate Taxes | $4,185 | $50 |
Property Value by Mortgage Status in Concordia
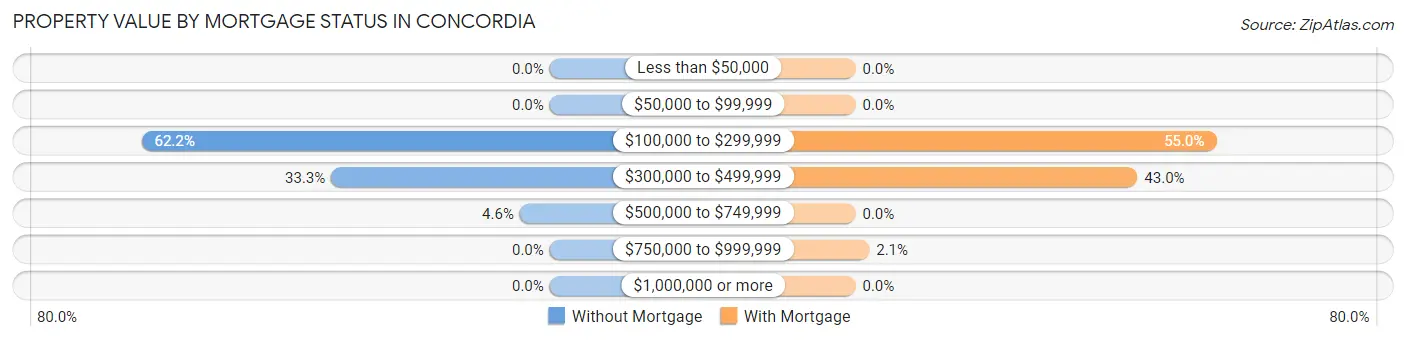
| Property Value | Without Mortgage | With Mortgage |
| Less than $50,000 | 0 (0.0%) | 0 (0.0%) |
| $50,000 to $99,999 | 0 (0.0%) | 0 (0.0%) |
| $100,000 to $299,999 | 465 (62.2%) | 421 (55.0%) |
| $300,000 to $499,999 | 249 (33.3%) | 329 (42.9%) |
| $500,000 to $749,999 | 34 (4.5%) | 0 (0.0%) |
| $750,000 to $999,999 | 0 (0.0%) | 16 (2.1%) |
| $1,000,000 or more | 0 (0.0%) | 0 (0.0%) |
| Total | 748 (100.0%) | 766 (100.0%) |
Household Income by Mortgage Status in Concordia
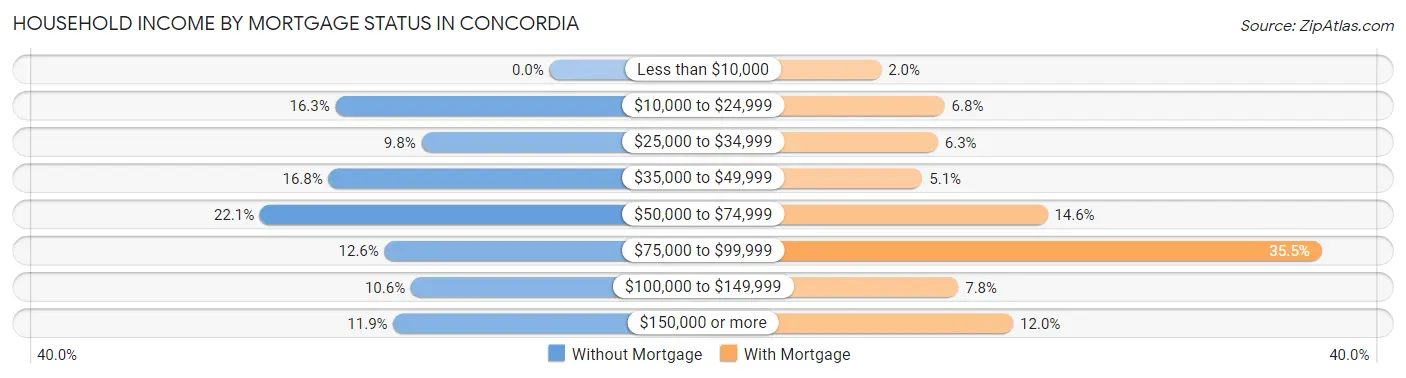
| Household Income | Without Mortgage | With Mortgage |
| Less than $10,000 | 0 (0.0%) | 15 (2.0%) |
| $10,000 to $24,999 | 122 (16.3%) | 52 (6.8%) |
| $25,000 to $34,999 | 73 (9.8%) | 48 (6.3%) |
| $35,000 to $49,999 | 126 (16.8%) | 39 (5.1%) |
| $50,000 to $74,999 | 165 (22.1%) | 112 (14.6%) |
| $75,000 to $99,999 | 94 (12.6%) | 272 (35.5%) |
| $100,000 to $149,999 | 79 (10.6%) | 60 (7.8%) |
| $150,000 or more | 89 (11.9%) | 92 (12.0%) |
| Total | 748 (100.0%) | 766 (100.0%) |
Property Value to Household Income Ratio in Concordia
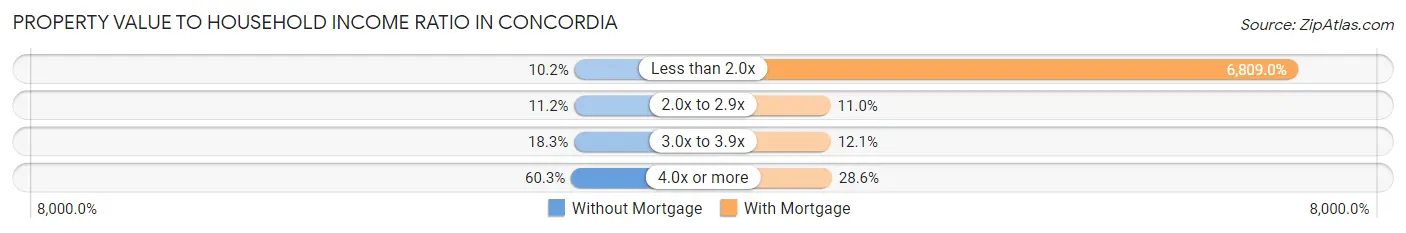
| Value-to-Income Ratio | Without Mortgage | With Mortgage |
| Less than 2.0x | 76 (10.2%) | 52,157 (6,809.0%) |
| 2.0x to 2.9x | 84 (11.2%) | 84 (11.0%) |
| 3.0x to 3.9x | 137 (18.3%) | 93 (12.1%) |
| 4.0x or more | 451 (60.3%) | 219 (28.6%) |
| Total | 748 (100.0%) | 766 (100.0%) |
Real Estate Taxes by Mortgage Status in Concordia
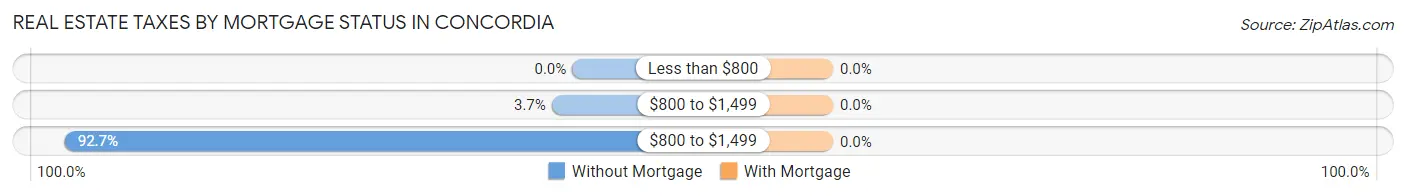
| Property Taxes | Without Mortgage | With Mortgage |
| Less than $800 | 0 (0.0%) | 0 (0.0%) |
| $800 to $1,499 | 28 (3.7%) | 0 (0.0%) |
| $800 to $1,499 | 693 (92.6%) | 0 (0.0%) |
| Total | 748 (100.0%) | 766 (100.0%) |
Health & Disability in Concordia
Health Insurance Coverage by Age in Concordia
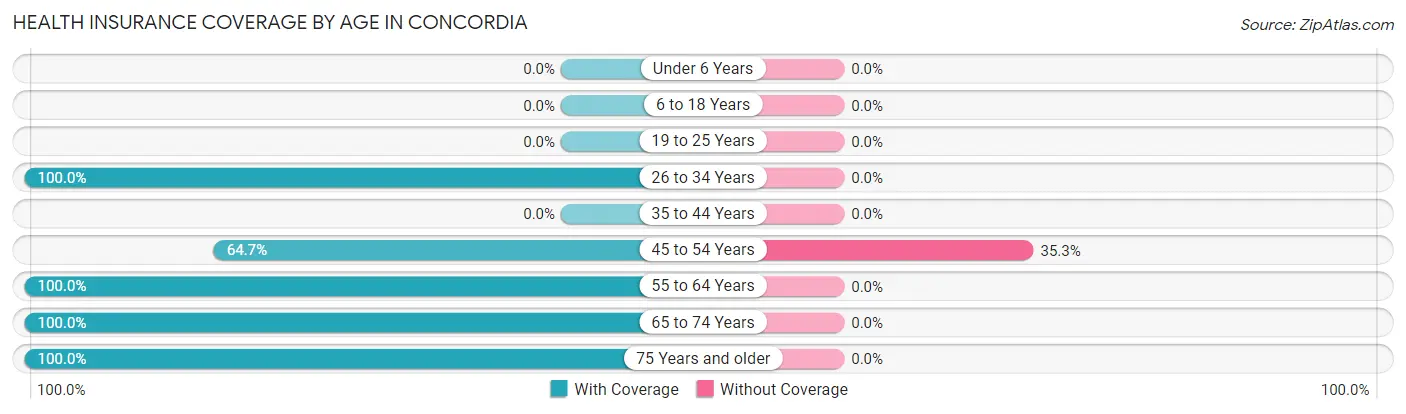
| Age Bracket | With Coverage | Without Coverage |
| Under 6 Years | 0 (0.0%) | 0 (0.0%) |
| 6 to 18 Years | 0 (0.0%) | 0 (0.0%) |
| 19 to 25 Years | 0 (0.0%) | 0 (0.0%) |
| 26 to 34 Years | 22 (100.0%) | 0 (0.0%) |
| 35 to 44 Years | 0 (0.0%) | 0 (0.0%) |
| 45 to 54 Years | 44 (64.7%) | 24 (35.3%) |
| 55 to 64 Years | 419 (100.0%) | 0 (0.0%) |
| 65 to 74 Years | 1,168 (100.0%) | 0 (0.0%) |
| 75 Years and older | 1,033 (100.0%) | 0 (0.0%) |
| Total | 2,686 (99.1%) | 24 (0.9%) |
Health Insurance Coverage by Citizenship Status in Concordia
| Citizenship Status | With Coverage | Without Coverage |
| Native Born | 0 (0.0%) | 0 (0.0%) |
| Foreign Born, Citizen | 0 (0.0%) | 0 (0.0%) |
| Foreign Born, not a Citizen | 0 (0.0%) | 0 (0.0%) |
Health Insurance Coverage by Household Income in Concordia
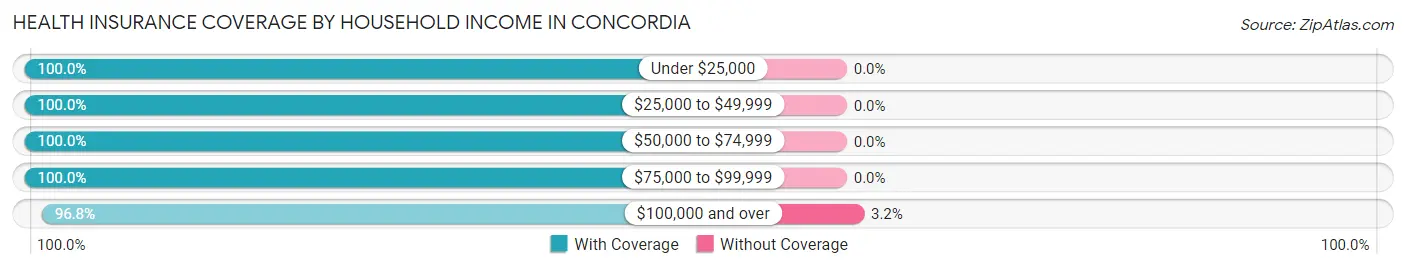
| Household Income | With Coverage | Without Coverage |
| Under $25,000 | 276 (100.0%) | 0 (0.0%) |
| $25,000 to $49,999 | 652 (100.0%) | 0 (0.0%) |
| $50,000 to $74,999 | 758 (100.0%) | 0 (0.0%) |
| $75,000 to $99,999 | 281 (100.0%) | 0 (0.0%) |
| $100,000 and over | 719 (96.8%) | 24 (3.2%) |
Public vs Private Health Insurance Coverage by Age in Concordia
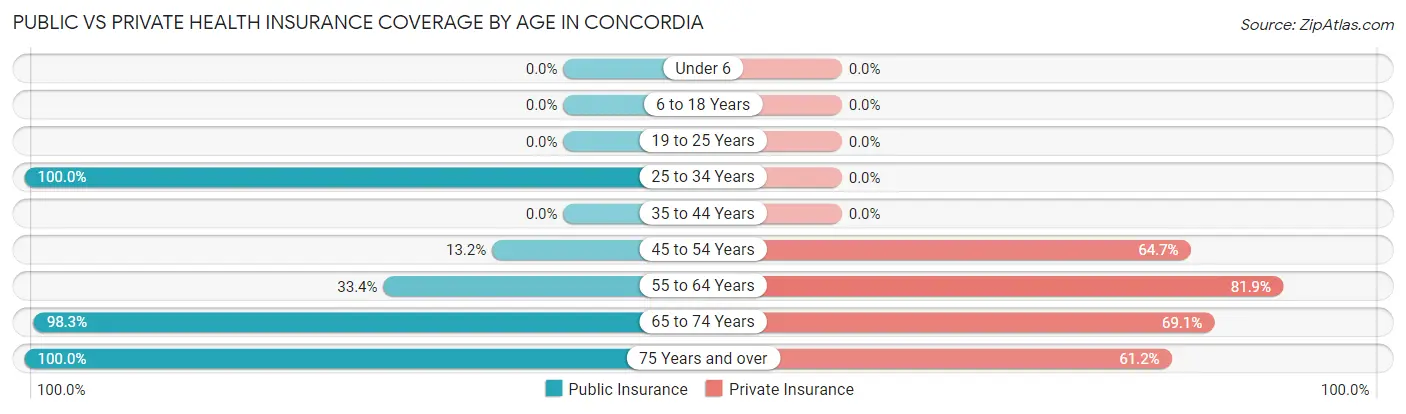
| Age Bracket | Public Insurance | Private Insurance |
| Under 6 | 0 (0.0%) | 0 (0.0%) |
| 6 to 18 Years | 0 (0.0%) | 0 (0.0%) |
| 19 to 25 Years | 0 (0.0%) | 0 (0.0%) |
| 25 to 34 Years | 22 (100.0%) | 0 (0.0%) |
| 35 to 44 Years | 0 (0.0%) | 0 (0.0%) |
| 45 to 54 Years | 9 (13.2%) | 44 (64.7%) |
| 55 to 64 Years | 140 (33.4%) | 343 (81.9%) |
| 65 to 74 Years | 1,148 (98.3%) | 807 (69.1%) |
| 75 Years and over | 1,033 (100.0%) | 632 (61.2%) |
| Total | 2,352 (86.8%) | 1,826 (67.4%) |
Disability Status by Sex by Age in Concordia
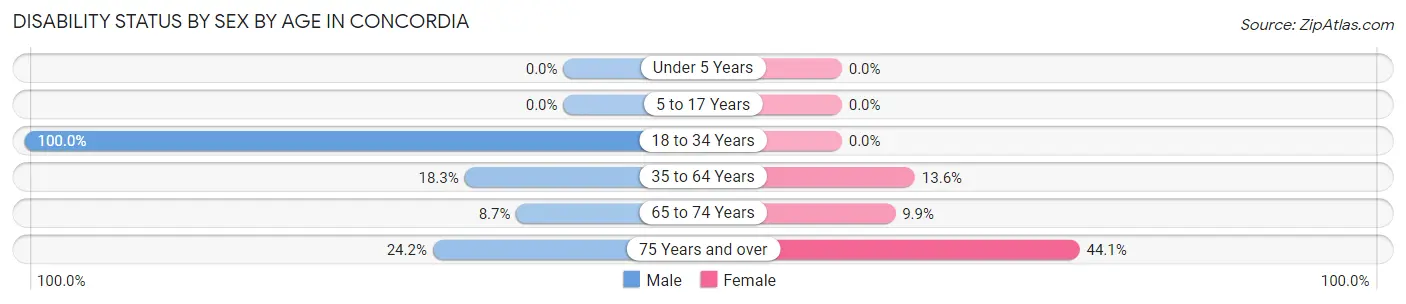
| Age Bracket | Male | Female |
| Under 5 Years | 0 (0.0%) | 0 (0.0%) |
| 5 to 17 Years | 0 (0.0%) | 0 (0.0%) |
| 18 to 34 Years | 22 (100.0%) | 0 (0.0%) |
| 35 to 64 Years | 42 (18.3%) | 35 (13.6%) |
| 65 to 74 Years | 36 (8.7%) | 75 (9.9%) |
| 75 Years and over | 112 (24.2%) | 252 (44.1%) |
Disability Class by Sex by Age in Concordia
Disability Class: Hearing Difficulty
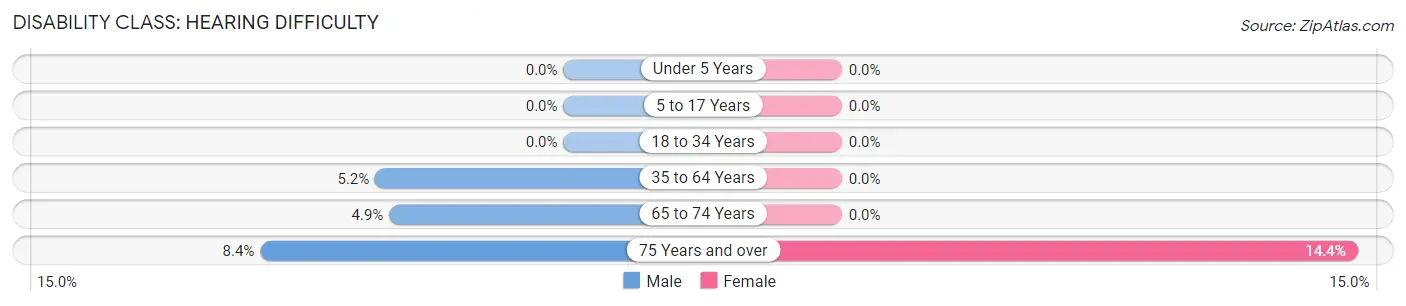
| Age Bracket | Male | Female |
| Under 5 Years | 0 (0.0%) | 0 (0.0%) |
| 5 to 17 Years | 0 (0.0%) | 0 (0.0%) |
| 18 to 34 Years | 0 (0.0%) | 0 (0.0%) |
| 35 to 64 Years | 12 (5.2%) | 0 (0.0%) |
| 65 to 74 Years | 20 (4.9%) | 0 (0.0%) |
| 75 Years and over | 39 (8.4%) | 82 (14.4%) |
Disability Class: Vision Difficulty
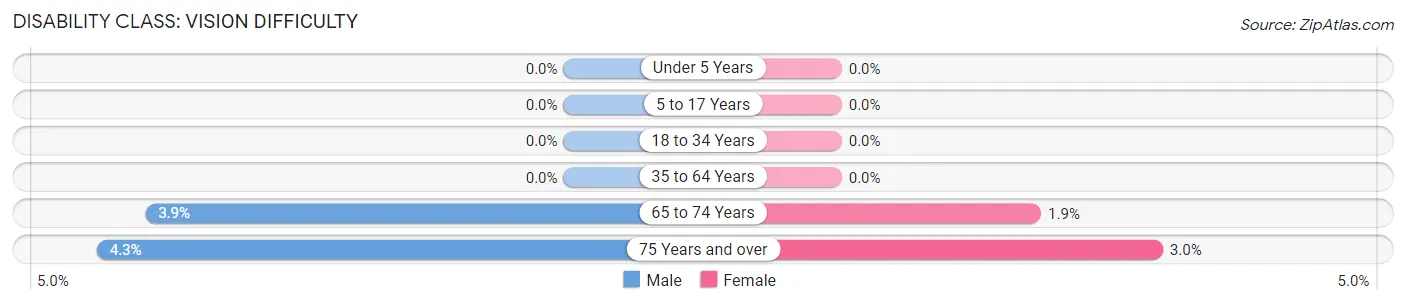
| Age Bracket | Male | Female |
| Under 5 Years | 0 (0.0%) | 0 (0.0%) |
| 5 to 17 Years | 0 (0.0%) | 0 (0.0%) |
| 18 to 34 Years | 0 (0.0%) | 0 (0.0%) |
| 35 to 64 Years | 0 (0.0%) | 0 (0.0%) |
| 65 to 74 Years | 16 (3.9%) | 14 (1.8%) |
| 75 Years and over | 20 (4.3%) | 17 (3.0%) |
Disability Class: Cognitive Difficulty
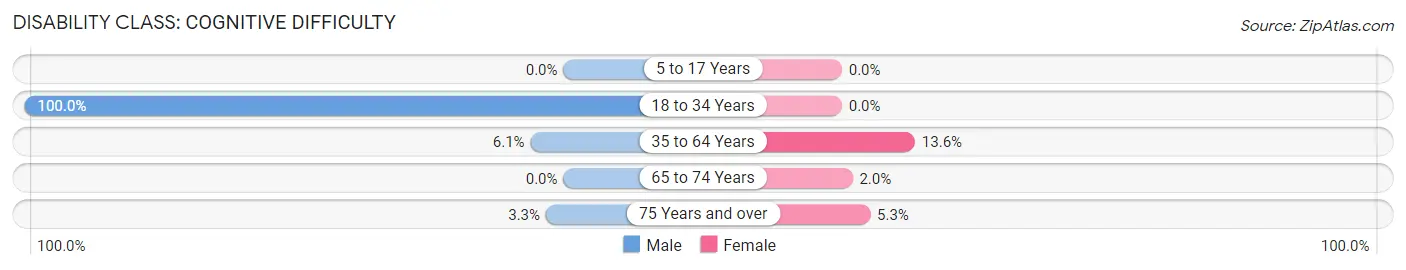
| Age Bracket | Male | Female |
| 5 to 17 Years | 0 (0.0%) | 0 (0.0%) |
| 18 to 34 Years | 22 (100.0%) | 0 (0.0%) |
| 35 to 64 Years | 14 (6.1%) | 35 (13.6%) |
| 65 to 74 Years | 0 (0.0%) | 15 (2.0%) |
| 75 Years and over | 15 (3.3%) | 30 (5.2%) |
Disability Class: Ambulatory Difficulty
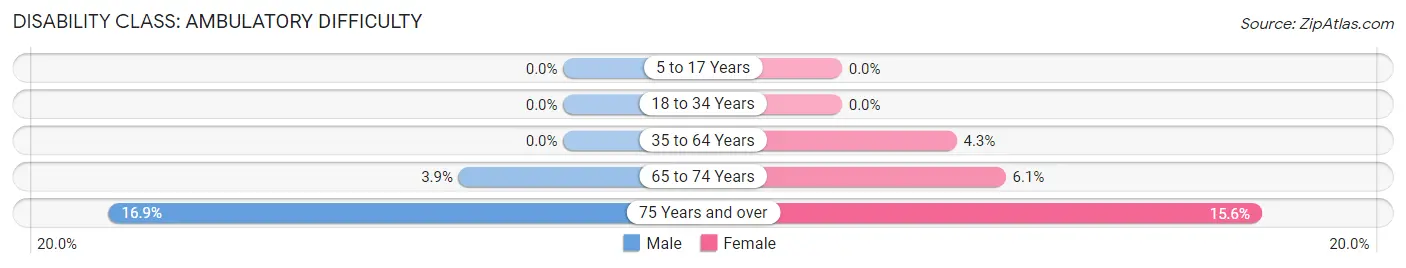
| Age Bracket | Male | Female |
| 5 to 17 Years | 0 (0.0%) | 0 (0.0%) |
| 18 to 34 Years | 0 (0.0%) | 0 (0.0%) |
| 35 to 64 Years | 0 (0.0%) | 11 (4.3%) |
| 65 to 74 Years | 16 (3.9%) | 46 (6.1%) |
| 75 Years and over | 78 (16.9%) | 89 (15.6%) |
Disability Class: Self-Care Difficulty
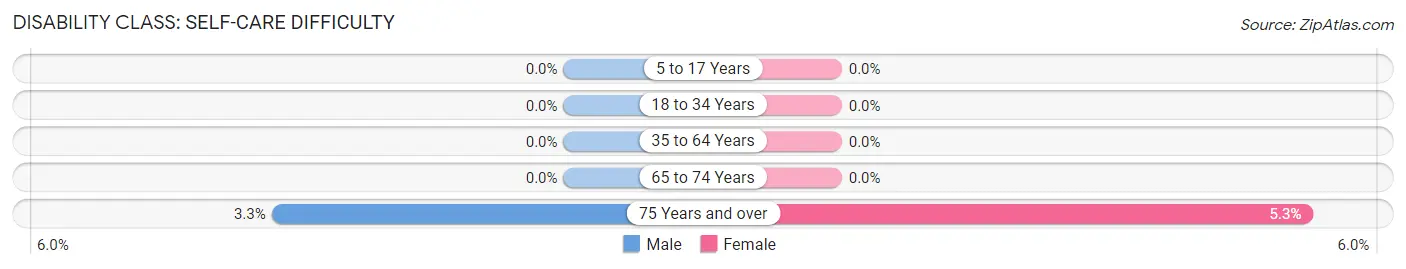
| Age Bracket | Male | Female |
| 5 to 17 Years | 0 (0.0%) | 0 (0.0%) |
| 18 to 34 Years | 0 (0.0%) | 0 (0.0%) |
| 35 to 64 Years | 0 (0.0%) | 0 (0.0%) |
| 65 to 74 Years | 0 (0.0%) | 0 (0.0%) |
| 75 Years and over | 15 (3.3%) | 30 (5.2%) |
Technology Access in Concordia
Computing Device Access in Concordia
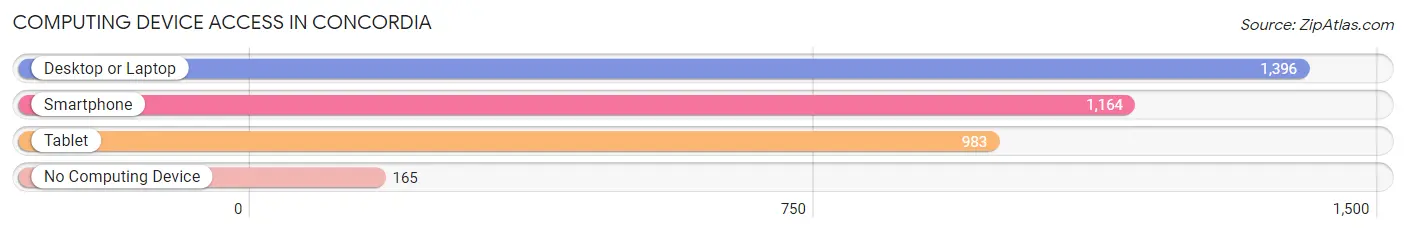
| Device Type | # Households | % Households |
| Desktop or Laptop | 1,396 | 82.0% |
| Smartphone | 1,164 | 68.3% |
| Tablet | 983 | 57.7% |
| No Computing Device | 165 | 9.7% |
| Total | 1,703 | 100.0% |
Internet Access in Concordia
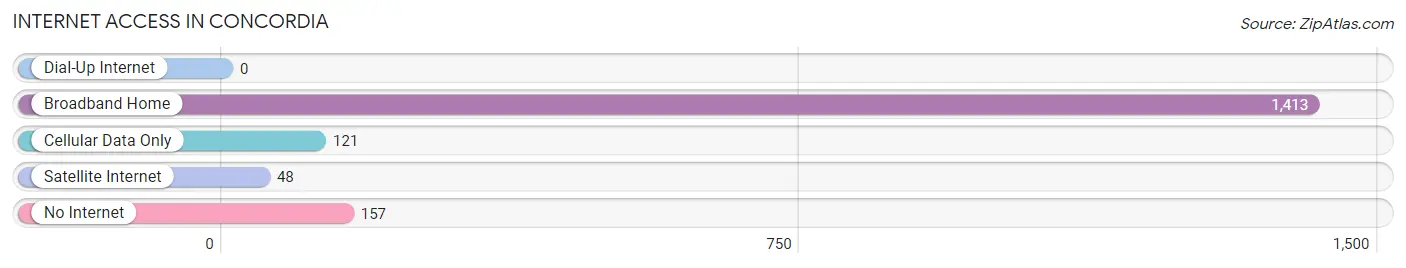
| Internet Type | # Households | % Households |
| Dial-Up Internet | 0 | 0.0% |
| Broadband Home | 1,413 | 83.0% |
| Cellular Data Only | 121 | 7.1% |
| Satellite Internet | 48 | 2.8% |
| No Internet | 157 | 9.2% |
| Total | 1,703 | 100.0% |
Concordia Summary
Concordia is a small town located in the state of New Jersey, United States. It is situated in the northern part of the state, in the county of Sussex. The town has a population of approximately 1,500 people, and is part of the larger metropolitan area of New York City.
Geography
Concordia is located in the northern part of New Jersey, in the county of Sussex. It is situated in the Kittatinny Valley, which is a part of the Great Appalachian Valley. The town is surrounded by the Appalachian Mountains, and is located near the Delaware River. The town is located at an elevation of 1,000 feet above sea level.
The town is located in a rural area, and is surrounded by forests and farmland. The town is located near the Kittatinny Valley State Park, which is a popular destination for outdoor activities such as hiking, camping, and fishing.
Climate
Concordia has a humid continental climate, with hot summers and cold winters. The average temperature in the summer is around 75 degrees Fahrenheit, and the average temperature in the winter is around 25 degrees Fahrenheit. The town receives an average of 40 inches of precipitation per year.
Demographics
As of the 2010 census, the population of Concordia was 1,500 people. The racial makeup of the town was 97.3% White, 0.7% African American, 0.3% Native American, 0.3% Asian, and 1.3% from other races. The median household income was $50,000, and the median family income was $60,000.
Economy
Concordia is a small town, and the economy is largely based on agriculture and tourism. The town is home to several farms, which produce a variety of crops such as corn, soybeans, and hay. The town is also home to several small businesses, such as restaurants, stores, and other services.
The town is also a popular destination for tourists, as it is located near the Kittatinny Valley State Park. The park offers a variety of outdoor activities, such as hiking, camping, and fishing. The town also hosts several festivals and events throughout the year, such as the Concordia Harvest Festival and the Concordia Christmas Parade.
Conclusion
Concordia is a small town located in the northern part of New Jersey. The town has a population of approximately 1,500 people, and is part of the larger metropolitan area of New York City. The town is located in a rural area, and is surrounded by forests and farmland. The town has a humid continental climate, with hot summers and cold winters. The economy of the town is largely based on agriculture and tourism. The town is home to several farms, and is a popular destination for tourists due to its proximity to the Kittatinny Valley State Park.
Common Questions
What is Per Capita Income in Concordia?
Per Capita income in Concordia is $50,055.
What is the Median Family Income in Concordia?
Median Family Income in Concordia is $70,673.
What is the Median Household income in Concordia?
Median Household Income in Concordia is $52,114.
What is Income or Wage Gap in Concordia?
Income or Wage Gap in Concordia is 17.5%.
Women in Concordia earn 82.5 cents for every dollar earned by a man.
What is Inequality or Gini Index in Concordia?
Inequality or Gini Index in Concordia is 0.43.
What is the Total Population of Concordia?
Total Population of Concordia is 2,710.
What is the Total Male Population of Concordia?
Total Male Population of Concordia is 1,125.
What is the Total Female Population of Concordia?
Total Female Population of Concordia is 1,585.
What is the Ratio of Males per 100 Females in Concordia?
There are 70.98 Males per 100 Females in Concordia.
What is the Ratio of Females per 100 Males in Concordia?
There are 140.89 Females per 100 Males in Concordia.
What is the Median Population Age in Concordia?
Median Population Age in Concordia is 72.4 Years.
What is the Average Family Size in Concordia
Average Family Size in Concordia is 2.0 People.
What is the Average Household Size in Concordia
Average Household Size in Concordia is 1.6 People.
How Large is the Labor Force in Concordia?
There are 894 People in the Labor Forcein in Concordia.
What is the Percentage of People in the Labor Force in Concordia?
33.0% of People are in the Labor Force in Concordia.
What is the Unemployment Rate in Concordia?
Unemployment Rate in Concordia is 11.3%.