Totowa borough, NJ Map & Demographics
Totowa borough Overview
$50,260
PER CAPITA INCOME
$117,989
AVG FAMILY INCOME
$112,097
AVG HOUSEHOLD INCOME
7.8%
WAGE / INCOME GAP [ % ]
92.2¢/ $1
WAGE / INCOME GAP [ $ ]
0.41
INEQUALITY / GINI INDEX
10,975
TOTAL POPULATION
5,362
MALE POPULATION
5,613
FEMALE POPULATION
95.53
MALES / 100 FEMALES
104.68
FEMALES / 100 MALES
43.9
MEDIAN AGE
3.2
AVG FAMILY SIZE
2.8
AVG HOUSEHOLD SIZE
5,848
LABOR FORCE [ PEOPLE ]
67.0%
PERCENT IN LABOR FORCE
5.4%
UNEMPLOYMENT RATE
Income in Totowa borough
Income Overview in Totowa borough
Per Capita Income in Totowa borough is $50,260, while median incomes of families and households are $117,989 and $112,097 respectively.
| Characteristic | Number | Measure |
| Per Capita Income | 10,975 | $50,260 |
| Median Family Income | 3,000 | $117,989 |
| Mean Family Income | 3,000 | $146,081 |
| Median Household Income | 3,781 | $112,097 |
| Mean Household Income | 3,781 | $144,604 |
| Income Deficit | 3,000 | $0 |
| Wage / Income Gap (%) | 10,975 | 7.81% |
| Wage / Income Gap ($) | 10,975 | 92.19¢ per $1 |
| Gini / Inequality Index | 10,975 | 0.41 |
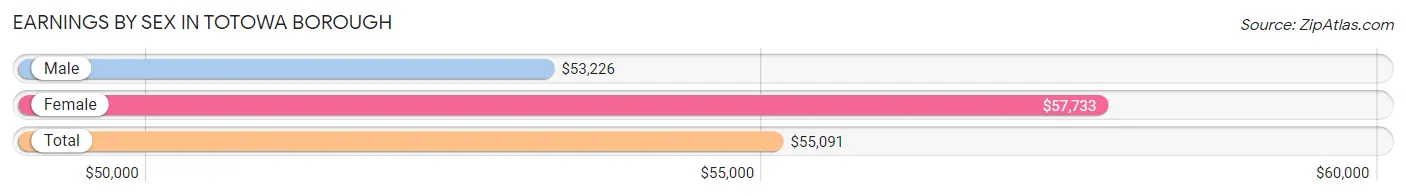
Earnings by Sex in Totowa borough
Average Earnings in Totowa borough are $55,091, $53,226 for men and $57,733 for women, a difference of 7.8%.
| Sex | Number | Average Earnings |
| Male | 3,160 (50.3%) | $53,226 |
| Female | 3,116 (49.6%) | $57,733 |
| Total | 6,276 (100.0%) | $55,091 |
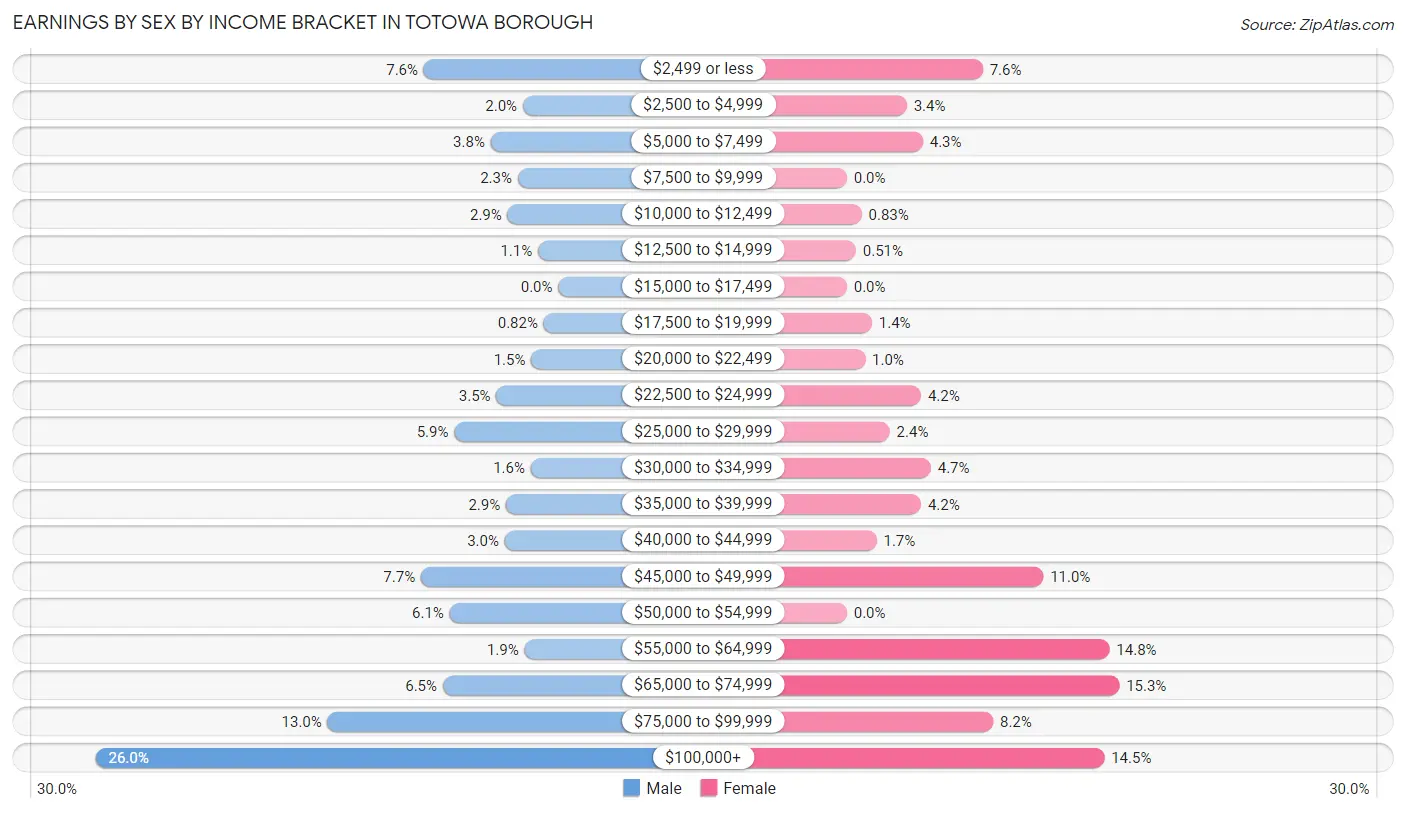
Earnings by Sex by Income Bracket in Totowa borough
The most common earnings brackets in Totowa borough are $100,000+ for men (822 | 26.0%) and $65,000 to $74,999 for women (477 | 15.3%).
| Income | Male | Female |
| $2,499 or less | 239 (7.6%) | 238 (7.6%) |
| $2,500 to $4,999 | 63 (2.0%) | 105 (3.4%) |
| $5,000 to $7,499 | 120 (3.8%) | 133 (4.3%) |
| $7,500 to $9,999 | 72 (2.3%) | 0 (0.0%) |
| $10,000 to $12,499 | 90 (2.9%) | 26 (0.8%) |
| $12,500 to $14,999 | 36 (1.1%) | 16 (0.5%) |
| $15,000 to $17,499 | 0 (0.0%) | 0 (0.0%) |
| $17,500 to $19,999 | 26 (0.8%) | 44 (1.4%) |
| $20,000 to $22,499 | 48 (1.5%) | 32 (1.0%) |
| $22,500 to $24,999 | 110 (3.5%) | 130 (4.2%) |
| $25,000 to $29,999 | 185 (5.9%) | 75 (2.4%) |
| $30,000 to $34,999 | 49 (1.5%) | 147 (4.7%) |
| $35,000 to $39,999 | 93 (2.9%) | 130 (4.2%) |
| $40,000 to $44,999 | 95 (3.0%) | 52 (1.7%) |
| $45,000 to $49,999 | 244 (7.7%) | 344 (11.0%) |
| $50,000 to $54,999 | 193 (6.1%) | 0 (0.0%) |
| $55,000 to $64,999 | 60 (1.9%) | 460 (14.8%) |
| $65,000 to $74,999 | 205 (6.5%) | 477 (15.3%) |
| $75,000 to $99,999 | 410 (13.0%) | 256 (8.2%) |
| $100,000+ | 822 (26.0%) | 451 (14.5%) |
| Total | 3,160 (100.0%) | 3,116 (100.0%) |
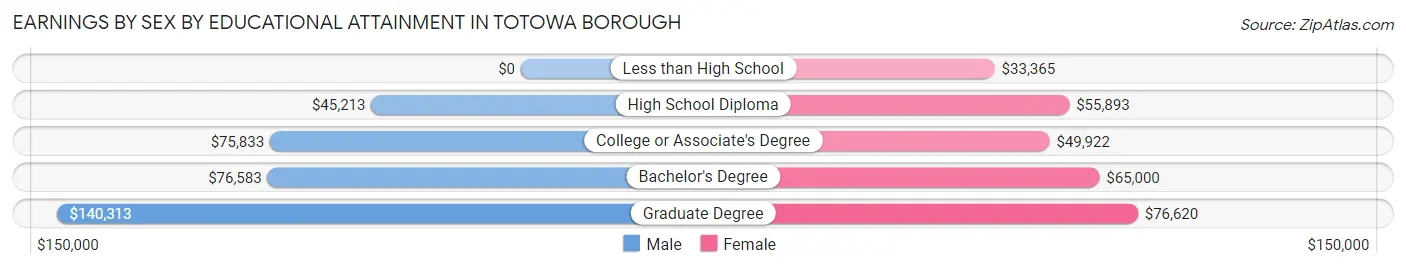
Earnings by Sex by Educational Attainment in Totowa borough
Average earnings in Totowa borough are $65,269 for men and $59,067 for women, a difference of 9.5%. Men with an educational attainment of graduate degree enjoy the highest average annual earnings of $140,313, while those with high school diploma education earn the least with $45,213. Women with an educational attainment of graduate degree earn the most with the average annual earnings of $76,620, while those with less than high school education have the smallest earnings of $33,365.
| Educational Attainment | Male Income | Female Income |
| Less than High School | - | - |
| High School Diploma | $45,213 | $55,893 |
| College or Associate's Degree | $75,833 | $49,922 |
| Bachelor's Degree | $76,583 | $65,000 |
| Graduate Degree | $140,313 | $76,620 |
| Total | $65,269 | $59,067 |
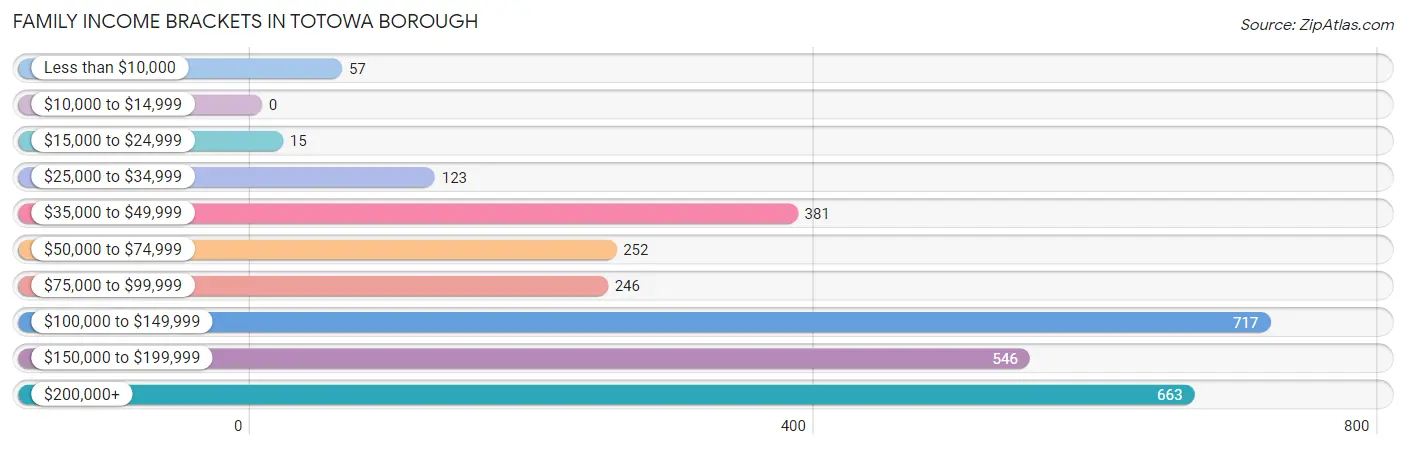
Family Income in Totowa borough
Family Income Brackets in Totowa borough
According to the Totowa borough family income data, there are 717 families falling into the $100,000 to $149,999 income range, which is the most common income bracket and makes up 23.9% of all families.
| Income Bracket | # Families | % Families |
| Less than $10,000 | 57 | 1.9% |
| $10,000 to $14,999 | 0 | 0.0% |
| $15,000 to $24,999 | 15 | 0.5% |
| $25,000 to $34,999 | 123 | 4.1% |
| $35,000 to $49,999 | 381 | 12.7% |
| $50,000 to $74,999 | 252 | 8.4% |
| $75,000 to $99,999 | 246 | 8.2% |
| $100,000 to $149,999 | 717 | 23.9% |
| $150,000 to $199,999 | 546 | 18.2% |
| $200,000+ | 663 | 22.1% |
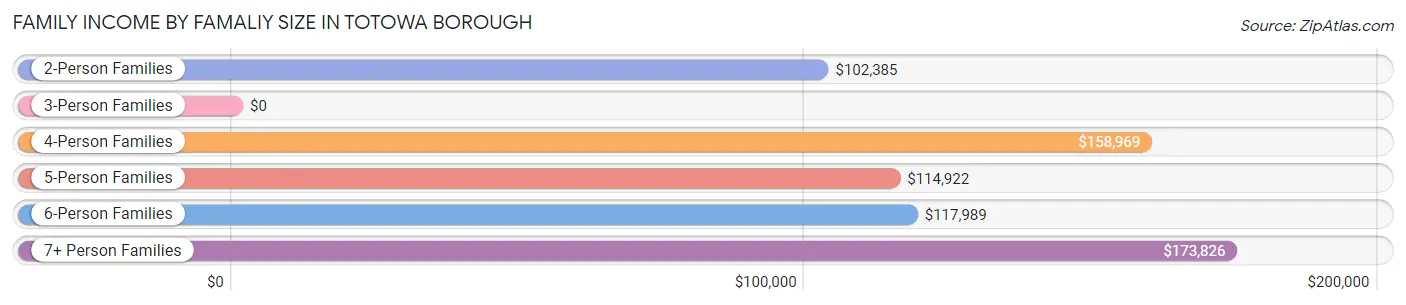
Family Income by Famaliy Size in Totowa borough
7+ person families (93 | 3.1%) account for the highest median family income in Totowa borough with $173,826 per family, while 2-person families (1,320 | 44.0%) have the highest median income of $51,192 per family member.
| Income Bracket | # Families | Median Income |
| 2-Person Families | 1,320 (44.0%) | $102,385 |
| 3-Person Families | 573 (19.1%) | $0 |
| 4-Person Families | 546 (18.2%) | $158,969 |
| 5-Person Families | 427 (14.2%) | $114,922 |
| 6-Person Families | 41 (1.4%) | $117,989 |
| 7+ Person Families | 93 (3.1%) | $173,826 |
| Total | 3,000 (100.0%) | $117,989 |
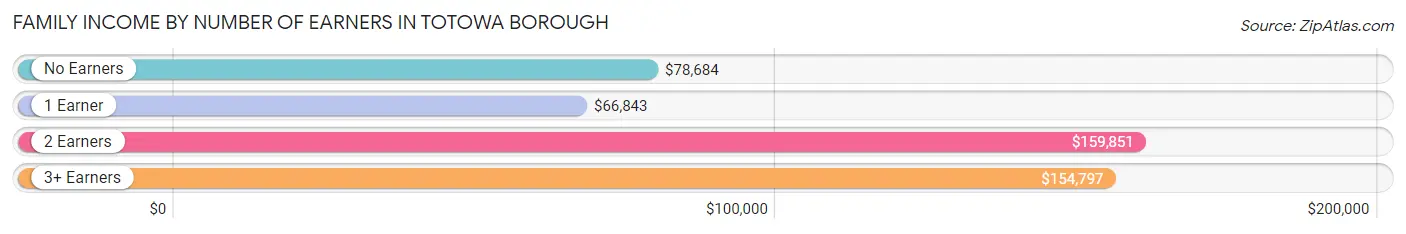
Family Income by Number of Earners in Totowa borough
The median family income in Totowa borough is $117,989, with families comprising 2 earners (1,355) having the highest median family income of $159,851, while families with 1 earner (853) have the lowest median family income of $66,843, accounting for 45.2% and 28.4% of families, respectively.
| Number of Earners | # Families | Median Income |
| No Earners | 274 (9.1%) | $78,684 |
| 1 Earner | 853 (28.4%) | $66,843 |
| 2 Earners | 1,355 (45.2%) | $159,851 |
| 3+ Earners | 518 (17.3%) | $154,797 |
| Total | 3,000 (100.0%) | $117,989 |
Household Income in Totowa borough
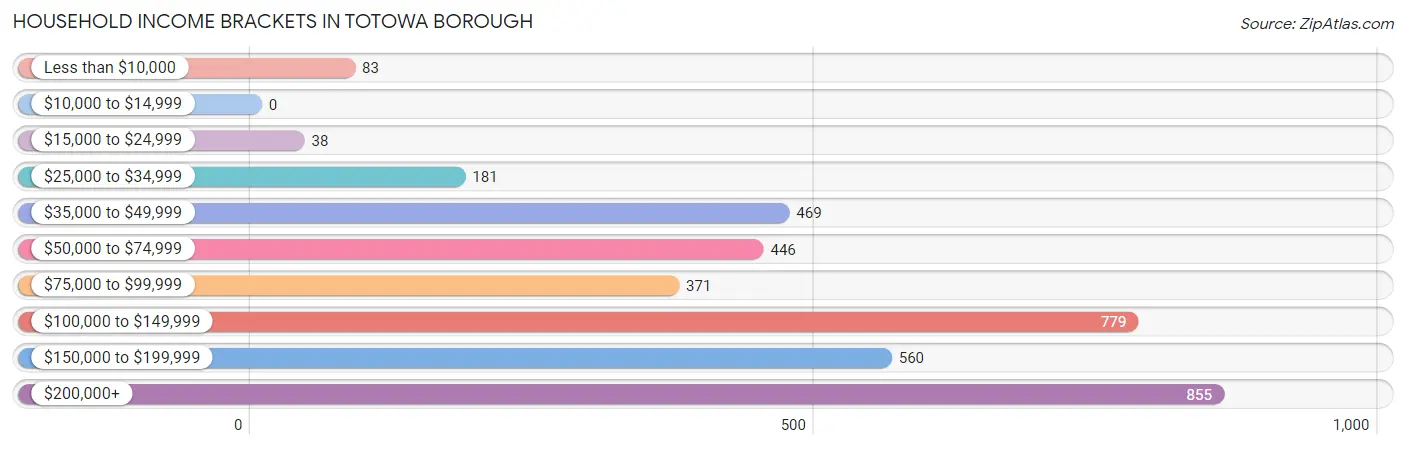
Household Income Brackets in Totowa borough
With 855 households falling in the category, the $200,000+ income range is the most frequent in Totowa borough, accounting for 22.6% of all households.
| Income Bracket | # Households | % Households |
| Less than $10,000 | 83 | 2.2% |
| $10,000 to $14,999 | 0 | 0.0% |
| $15,000 to $24,999 | 38 | 1.0% |
| $25,000 to $34,999 | 181 | 4.8% |
| $35,000 to $49,999 | 469 | 12.4% |
| $50,000 to $74,999 | 446 | 11.8% |
| $75,000 to $99,999 | 371 | 9.8% |
| $100,000 to $149,999 | 779 | 20.6% |
| $150,000 to $199,999 | 560 | 14.8% |
| $200,000+ | 855 | 22.6% |
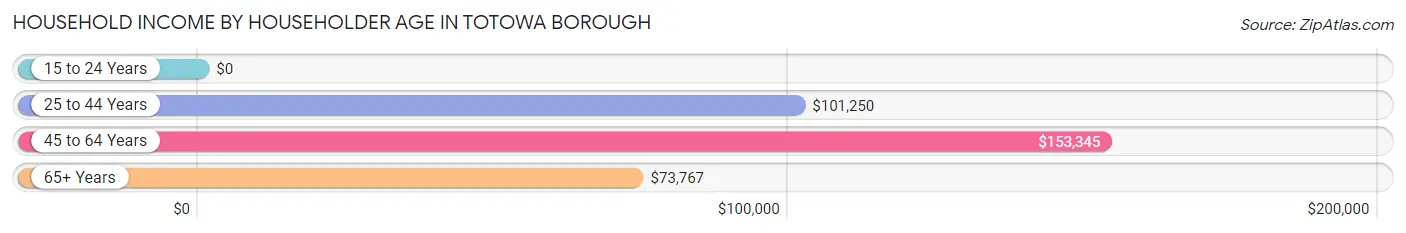
Household Income by Householder Age in Totowa borough
The median household income in Totowa borough is $112,097, with the highest median household income of $153,345 found in the 45 to 64 years age bracket for the primary householder. A total of 1,515 households (40.1%) fall into this category. Meanwhile, the 15 to 24 years age bracket for the primary householder has the lowest median household income of $0, with 23 households (0.6%) in this group.
| Income Bracket | # Households | Median Income |
| 15 to 24 Years | 23 (0.6%) | $0 |
| 25 to 44 Years | 1,066 (28.2%) | $101,250 |
| 45 to 64 Years | 1,515 (40.1%) | $153,345 |
| 65+ Years | 1,177 (31.1%) | $73,767 |
| Total | 3,781 (100.0%) | $112,097 |
Poverty in Totowa borough
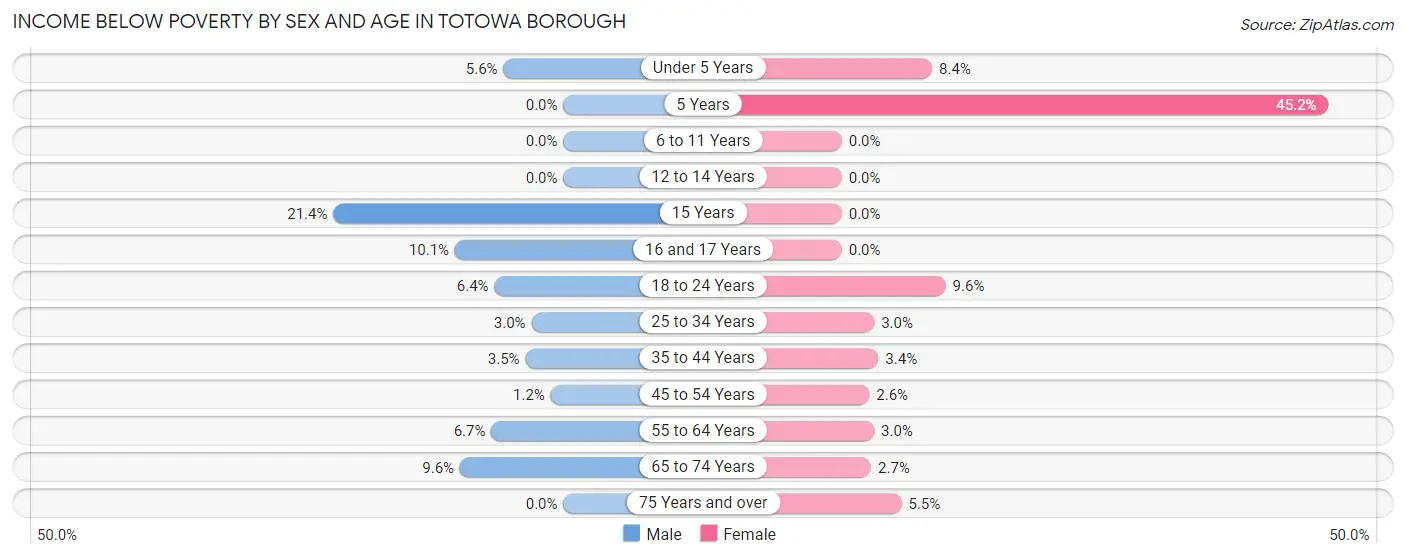
Income Below Poverty by Sex and Age in Totowa borough
With 4.3% poverty level for males and 3.5% for females among the residents of Totowa borough, 15 year old males and 5 year old females are the most vulnerable to poverty, with 19 males (21.3%) and 14 females (45.2%) in their respective age groups living below the poverty level.
| Age Bracket | Male | Female |
| Under 5 Years | 12 (5.6%) | 16 (8.4%) |
| 5 Years | 0 (0.0%) | 14 (45.2%) |
| 6 to 11 Years | 0 (0.0%) | 0 (0.0%) |
| 12 to 14 Years | 0 (0.0%) | 0 (0.0%) |
| 15 Years | 19 (21.3%) | 0 (0.0%) |
| 16 and 17 Years | 18 (10.1%) | 0 (0.0%) |
| 18 to 24 Years | 21 (6.4%) | 24 (9.6%) |
| 25 to 34 Years | 15 (3.0%) | 17 (3.0%) |
| 35 to 44 Years | 23 (3.5%) | 33 (3.4%) |
| 45 to 54 Years | 9 (1.2%) | 17 (2.6%) |
| 55 to 64 Years | 46 (6.7%) | 28 (3.0%) |
| 65 to 74 Years | 64 (9.6%) | 16 (2.7%) |
| 75 Years and over | 0 (0.0%) | 28 (5.5%) |
| Total | 227 (4.3%) | 193 (3.5%) |
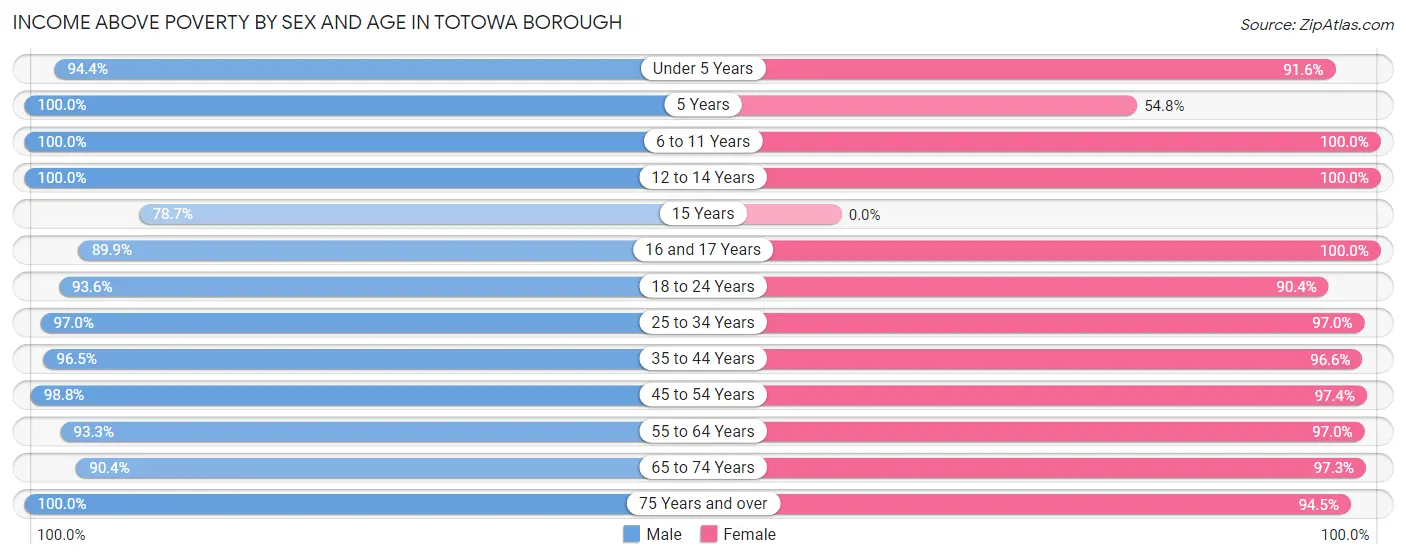
Income Above Poverty by Sex and Age in Totowa borough
According to the poverty statistics in Totowa borough, males aged 5 years and females aged 6 to 11 years are the age groups that are most secure financially, with 100.0% of males and 100.0% of females in these age groups living above the poverty line.
| Age Bracket | Male | Female |
| Under 5 Years | 204 (94.4%) | 175 (91.6%) |
| 5 Years | 30 (100.0%) | 17 (54.8%) |
| 6 to 11 Years | 610 (100.0%) | 408 (100.0%) |
| 12 to 14 Years | 315 (100.0%) | 351 (100.0%) |
| 15 Years | 70 (78.6%) | 0 (0.0%) |
| 16 and 17 Years | 161 (89.9%) | 93 (100.0%) |
| 18 to 24 Years | 307 (93.6%) | 225 (90.4%) |
| 25 to 34 Years | 491 (97.0%) | 547 (97.0%) |
| 35 to 44 Years | 631 (96.5%) | 938 (96.6%) |
| 45 to 54 Years | 754 (98.8%) | 648 (97.4%) |
| 55 to 64 Years | 642 (93.3%) | 904 (97.0%) |
| 65 to 74 Years | 603 (90.4%) | 572 (97.3%) |
| 75 Years and over | 275 (100.0%) | 477 (94.5%) |
| Total | 5,093 (95.7%) | 5,355 (96.5%) |
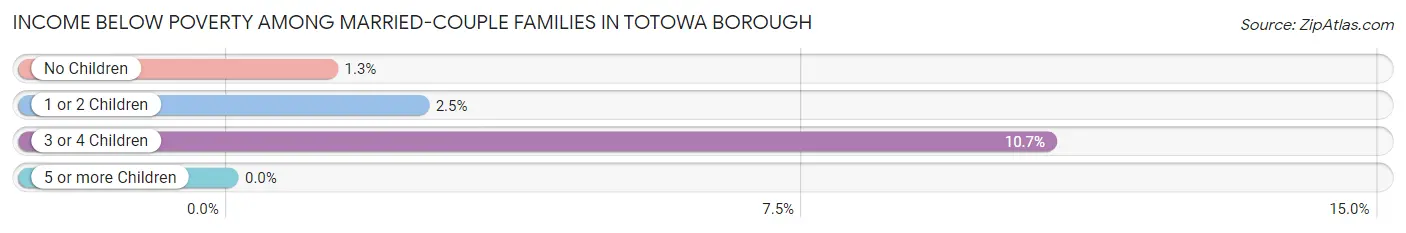
Income Below Poverty Among Married-Couple Families in Totowa borough
The poverty statistics for married-couple families in Totowa borough show that 2.4% or 52 of the total 2,156 families live below the poverty line. Families with 3 or 4 children have the highest poverty rate of 10.7%, comprising of 17 families. On the other hand, families with no children have the lowest poverty rate of 1.3%, which includes 16 families.
| Children | Above Poverty | Below Poverty |
| No Children | 1,218 (98.7%) | 16 (1.3%) |
| 1 or 2 Children | 744 (97.5%) | 19 (2.5%) |
| 3 or 4 Children | 142 (89.3%) | 17 (10.7%) |
| 5 or more Children | 0 (0.0%) | 0 (0.0%) |
| Total | 2,104 (97.6%) | 52 (2.4%) |
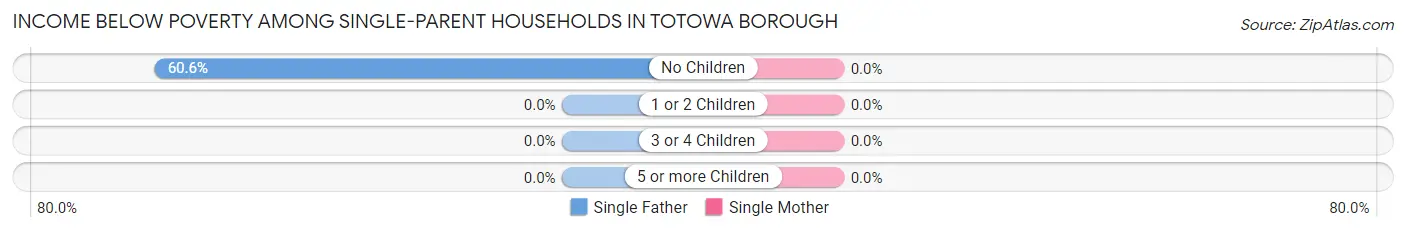
Income Below Poverty Among Single-Parent Households in Totowa borough
| Children | Single Father | Single Mother |
| No Children | 40 (60.6%) | 0 (0.0%) |
| 1 or 2 Children | 0 (0.0%) | 0 (0.0%) |
| 3 or 4 Children | 0 (0.0%) | 0 (0.0%) |
| 5 or more Children | 0 (0.0%) | 0 (0.0%) |
| Total | 40 (27.0%) | 0 (0.0%) |
Income Below Poverty Among Married-Couple vs Single-Parent Households in Totowa borough
The poverty data for Totowa borough shows that 52 of the married-couple family households (2.4%) and 40 of the single-parent households (4.7%) are living below the poverty level. Within the married-couple family households, those with 3 or 4 children have the highest poverty rate, with 17 households (10.7%) falling below the poverty line. Among the single-parent households, those with no children have the highest poverty rate, with 40 household (9.1%) living below poverty.
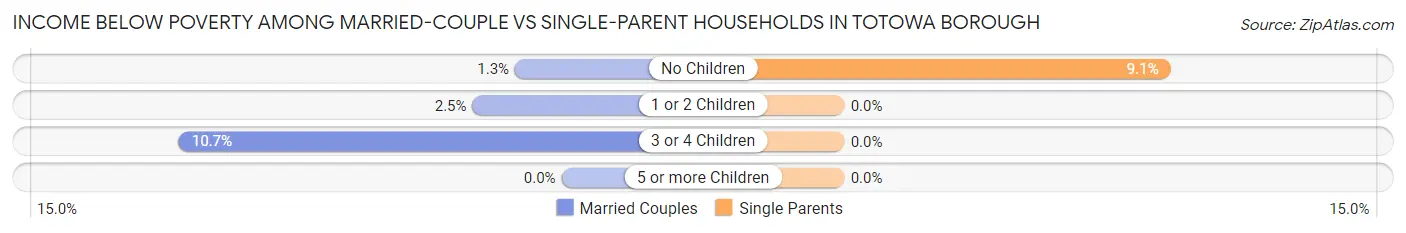
| Children | Married-Couple Families | Single-Parent Households |
| No Children | 16 (1.3%) | 40 (9.1%) |
| 1 or 2 Children | 19 (2.5%) | 0 (0.0%) |
| 3 or 4 Children | 17 (10.7%) | 0 (0.0%) |
| 5 or more Children | 0 (0.0%) | 0 (0.0%) |
| Total | 52 (2.4%) | 40 (4.7%) |
Race in Totowa borough
The most populous races in Totowa borough are White / Caucasian (8,224 | 74.9%), Hispanic or Latino (2,570 | 23.4%), and Two or more Races (1,557 | 14.2%).
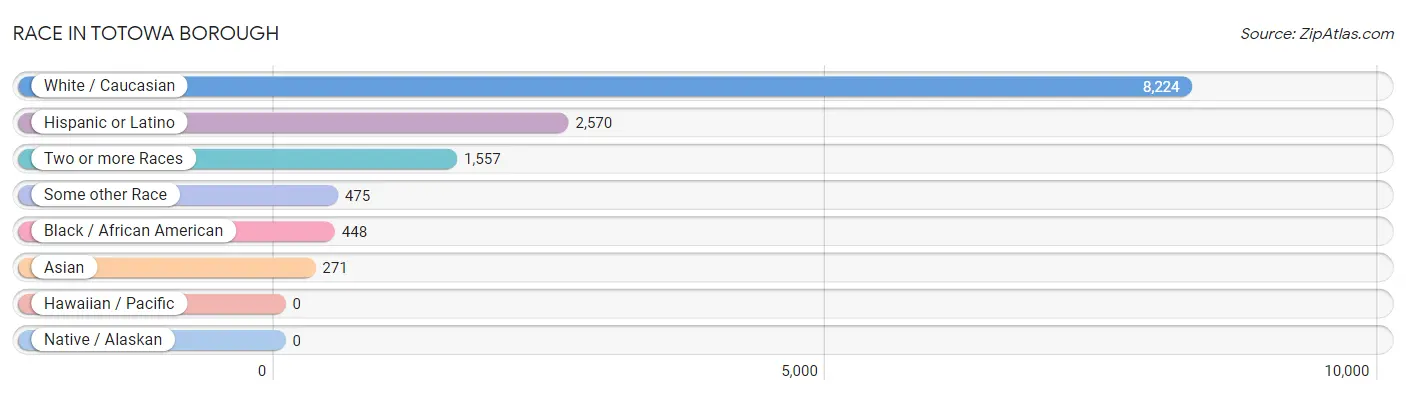
| Race | # Population | % Population |
| Asian | 271 | 2.5% |
| Black / African American | 448 | 4.1% |
| Hawaiian / Pacific | 0 | 0.0% |
| Hispanic or Latino | 2,570 | 23.4% |
| Native / Alaskan | 0 | 0.0% |
| White / Caucasian | 8,224 | 74.9% |
| Two or more Races | 1,557 | 14.2% |
| Some other Race | 475 | 4.3% |
| Total | 10,975 | 100.0% |
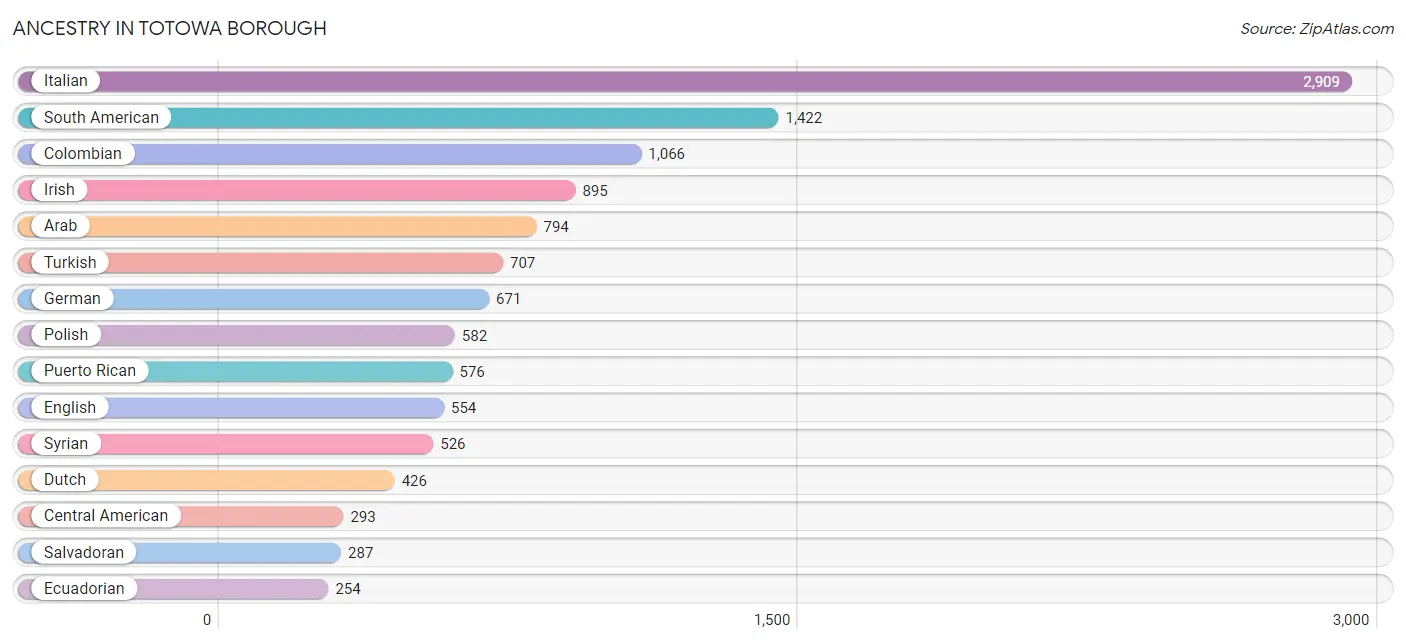
Ancestry in Totowa borough
The most populous ancestries reported in Totowa borough are Italian (2,909 | 26.5%), South American (1,422 | 13.0%), Colombian (1,066 | 9.7%), Irish (895 | 8.2%), and Arab (794 | 7.2%), together accounting for 64.6% of all Totowa borough residents.
| Ancestry | # Population | % Population |
| African | 20 | 0.2% |
| American | 78 | 0.7% |
| Arab | 794 | 7.2% |
| Armenian | 11 | 0.1% |
| Belgian | 53 | 0.5% |
| Brazilian | 126 | 1.1% |
| Burmese | 27 | 0.3% |
| Canadian | 17 | 0.2% |
| Central American | 293 | 2.7% |
| Colombian | 1,066 | 9.7% |
| Czechoslovakian | 9 | 0.1% |
| Dominican | 161 | 1.5% |
| Dutch | 426 | 3.9% |
| Eastern European | 34 | 0.3% |
| Ecuadorian | 254 | 2.3% |
| English | 554 | 5.1% |
| European | 116 | 1.1% |
| French | 47 | 0.4% |
| German | 671 | 6.1% |
| Greek | 224 | 2.0% |
| Haitian | 63 | 0.6% |
| Honduran | 6 | 0.1% |
| Hungarian | 213 | 1.9% |
| Indian (Asian) | 97 | 0.9% |
| Irish | 895 | 8.2% |
| Italian | 2,909 | 26.5% |
| Jamaican | 133 | 1.2% |
| Jordanian | 23 | 0.2% |
| Korean | 108 | 1.0% |
| Lebanese | 148 | 1.3% |
| Lithuanian | 11 | 0.1% |
| Mexican | 108 | 1.0% |
| Mexican American Indian | 31 | 0.3% |
| Norwegian | 21 | 0.2% |
| Palestinian | 51 | 0.5% |
| Peruvian | 102 | 0.9% |
| Polish | 582 | 5.3% |
| Portuguese | 122 | 1.1% |
| Puerto Rican | 576 | 5.2% |
| Russian | 91 | 0.8% |
| Salvadoran | 287 | 2.6% |
| Scotch-Irish | 49 | 0.4% |
| Scottish | 139 | 1.3% |
| Serbian | 50 | 0.5% |
| Slovak | 50 | 0.5% |
| South American | 1,422 | 13.0% |
| Sri Lankan | 21 | 0.2% |
| Subsaharan African | 20 | 0.2% |
| Swedish | 11 | 0.1% |
| Syrian | 526 | 4.8% |
| Thai | 85 | 0.8% |
| Turkish | 707 | 6.4% |
| Ukrainian | 54 | 0.5% |
| Welsh | 23 | 0.2% | View All 54 Rows |
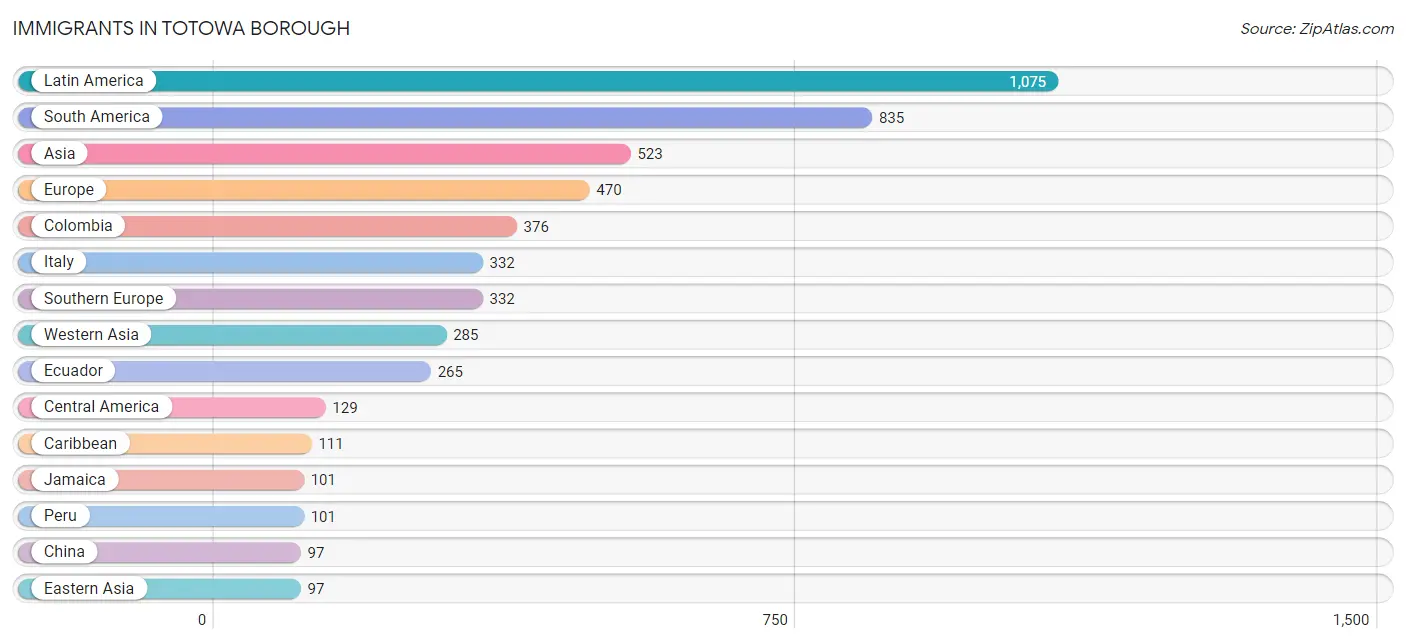
Immigrants in Totowa borough
The most numerous immigrant groups reported in Totowa borough came from Latin America (1,075 | 9.8%), South America (835 | 7.6%), Asia (523 | 4.8%), Europe (470 | 4.3%), and Colombia (376 | 3.4%), together accounting for 29.9% of all Totowa borough residents.
| Immigration Origin | # Population | % Population |
| Africa | 42 | 0.4% |
| Asia | 523 | 4.8% |
| Brazil | 93 | 0.9% |
| Caribbean | 111 | 1.0% |
| Central America | 129 | 1.2% |
| China | 97 | 0.9% |
| Colombia | 376 | 3.4% |
| Dominican Republic | 10 | 0.1% |
| Eastern Asia | 97 | 0.9% |
| Eastern Europe | 48 | 0.4% |
| Ecuador | 265 | 2.4% |
| England | 19 | 0.2% |
| Europe | 470 | 4.3% |
| Germany | 68 | 0.6% |
| Ghana | 15 | 0.1% |
| Honduras | 55 | 0.5% |
| India | 48 | 0.4% |
| Ireland | 3 | 0.0% |
| Italy | 332 | 3.0% |
| Jamaica | 101 | 0.9% |
| Jordan | 45 | 0.4% |
| Latin America | 1,075 | 9.8% |
| Lebanon | 63 | 0.6% |
| Mexico | 74 | 0.7% |
| Northern Africa | 27 | 0.3% |
| Northern Europe | 22 | 0.2% |
| Peru | 101 | 0.9% |
| Philippines | 93 | 0.9% |
| Poland | 48 | 0.4% |
| South America | 835 | 7.6% |
| South Central Asia | 48 | 0.4% |
| South Eastern Asia | 93 | 0.9% |
| Southern Europe | 332 | 3.0% |
| Sudan | 27 | 0.3% |
| Syria | 86 | 0.8% |
| Taiwan | 30 | 0.3% |
| Turkey | 75 | 0.7% |
| Western Africa | 15 | 0.1% |
| Western Asia | 285 | 2.6% |
| Western Europe | 68 | 0.6% | View All 40 Rows |
Sex and Age in Totowa borough
Sex and Age in Totowa borough
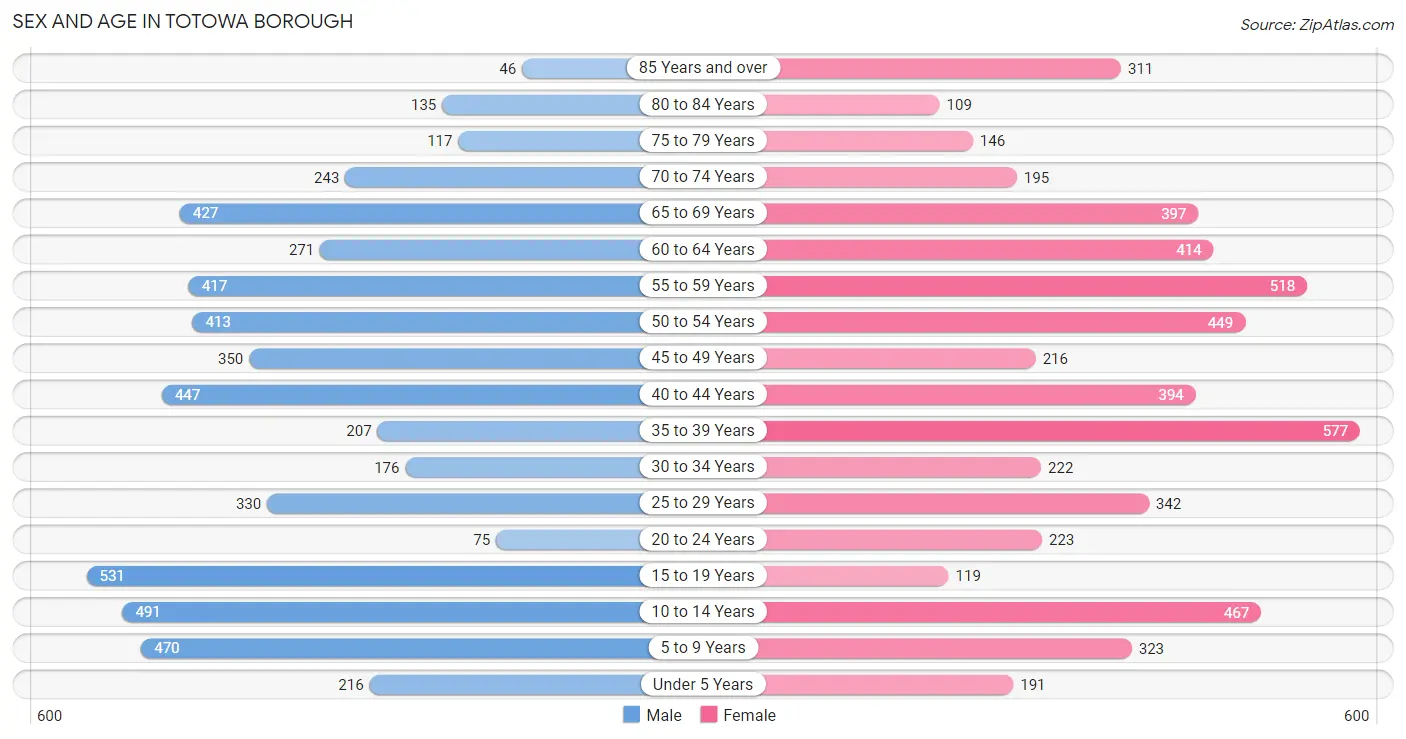
The most populous age groups in Totowa borough are 15 to 19 Years (531 | 9.9%) for men and 35 to 39 Years (577 | 10.3%) for women.
| Age Bracket | Male | Female |
| Under 5 Years | 216 (4.0%) | 191 (3.4%) |
| 5 to 9 Years | 470 (8.8%) | 323 (5.8%) |
| 10 to 14 Years | 491 (9.2%) | 467 (8.3%) |
| 15 to 19 Years | 531 (9.9%) | 119 (2.1%) |
| 20 to 24 Years | 75 (1.4%) | 223 (4.0%) |
| 25 to 29 Years | 330 (6.1%) | 342 (6.1%) |
| 30 to 34 Years | 176 (3.3%) | 222 (4.0%) |
| 35 to 39 Years | 207 (3.9%) | 577 (10.3%) |
| 40 to 44 Years | 447 (8.3%) | 394 (7.0%) |
| 45 to 49 Years | 350 (6.5%) | 216 (3.8%) |
| 50 to 54 Years | 413 (7.7%) | 449 (8.0%) |
| 55 to 59 Years | 417 (7.8%) | 518 (9.2%) |
| 60 to 64 Years | 271 (5.1%) | 414 (7.4%) |
| 65 to 69 Years | 427 (8.0%) | 397 (7.1%) |
| 70 to 74 Years | 243 (4.5%) | 195 (3.5%) |
| 75 to 79 Years | 117 (2.2%) | 146 (2.6%) |
| 80 to 84 Years | 135 (2.5%) | 109 (1.9%) |
| 85 Years and over | 46 (0.9%) | 311 (5.5%) |
| Total | 5,362 (100.0%) | 5,613 (100.0%) |
Families and Households in Totowa borough
Median Family Size in Totowa borough
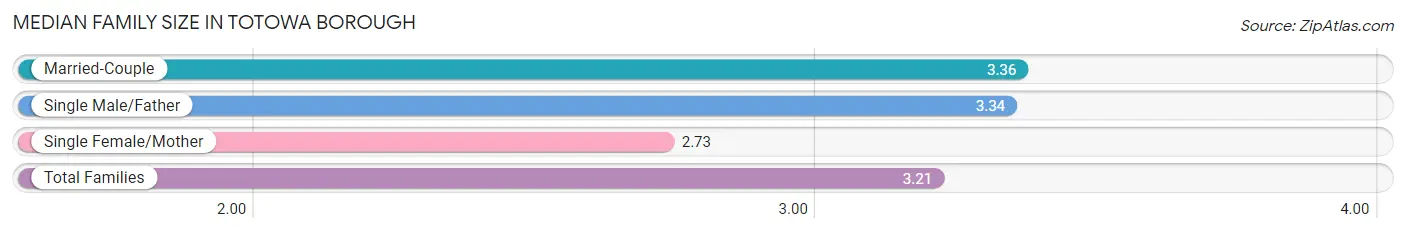
The median family size in Totowa borough is 3.21 persons per family, with married-couple families (2,156 | 71.9%) accounting for the largest median family size of 3.36 persons per family. On the other hand, single female/mother families (696 | 23.2%) represent the smallest median family size with 2.73 persons per family.
| Family Type | # Families | Family Size |
| Married-Couple | 2,156 (71.9%) | 3.36 |
| Single Male/Father | 148 (4.9%) | 3.34 |
| Single Female/Mother | 696 (23.2%) | 2.73 |
| Total Families | 3,000 (100.0%) | 3.21 |
Median Household Size in Totowa borough
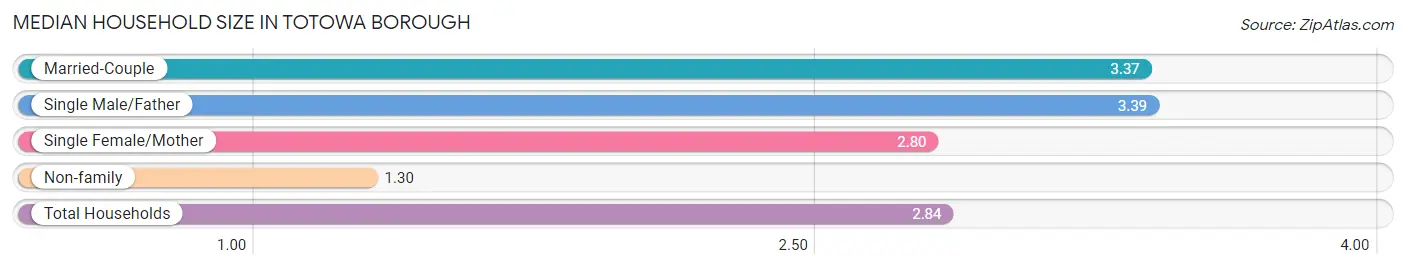
The median household size in Totowa borough is 2.84 persons per household, with single male/father households (148 | 3.9%) accounting for the largest median household size of 3.39 persons per household. non-family households (781 | 20.7%) represent the smallest median household size with 1.30 persons per household.
| Household Type | # Households | Household Size |
| Married-Couple | 2,156 (57.0%) | 3.37 |
| Single Male/Father | 148 (3.9%) | 3.39 |
| Single Female/Mother | 696 (18.4%) | 2.80 |
| Non-family | 781 (20.7%) | 1.30 |
| Total Households | 3,781 (100.0%) | 2.84 |
Household Size by Marriage Status in Totowa borough
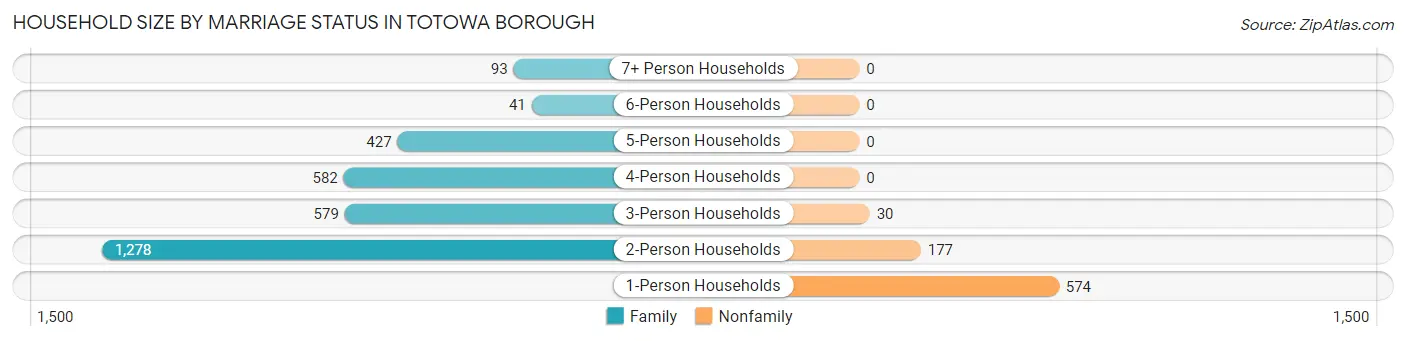
Out of a total of 3,781 households in Totowa borough, 3,000 (79.3%) are family households, while 781 (20.7%) are nonfamily households. The most numerous type of family households are 2-person households, comprising 1,278, and the most common type of nonfamily households are 1-person households, comprising 574.
| Household Size | Family Households | Nonfamily Households |
| 1-Person Households | - | 574 (15.2%) |
| 2-Person Households | 1,278 (33.8%) | 177 (4.7%) |
| 3-Person Households | 579 (15.3%) | 30 (0.8%) |
| 4-Person Households | 582 (15.4%) | 0 (0.0%) |
| 5-Person Households | 427 (11.3%) | 0 (0.0%) |
| 6-Person Households | 41 (1.1%) | 0 (0.0%) |
| 7+ Person Households | 93 (2.5%) | 0 (0.0%) |
| Total | 3,000 (79.3%) | 781 (20.7%) |
Female Fertility in Totowa borough
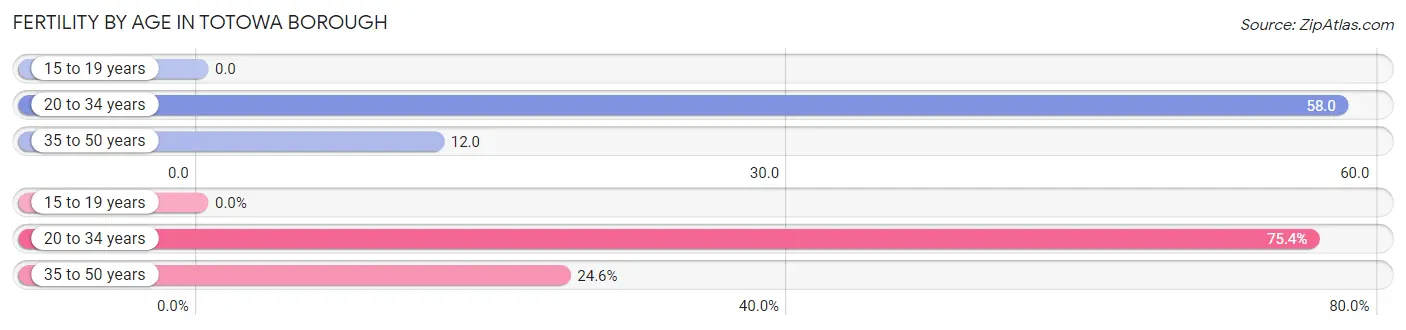
Fertility by Age in Totowa borough
Average fertility rate in Totowa borough is 29.0 births per 1,000 women. Women in the age bracket of 20 to 34 years have the highest fertility rate with 58.0 births per 1,000 women. Women in the age bracket of 20 to 34 years acount for 75.4% of all women with births.
| Age Bracket | Women with Births | Births / 1,000 Women |
| 15 to 19 years | 0 (0.0%) | 0.0 |
| 20 to 34 years | 46 (75.4%) | 58.0 |
| 35 to 50 years | 15 (24.6%) | 12.0 |
| Total | 61 (100.0%) | 29.0 |
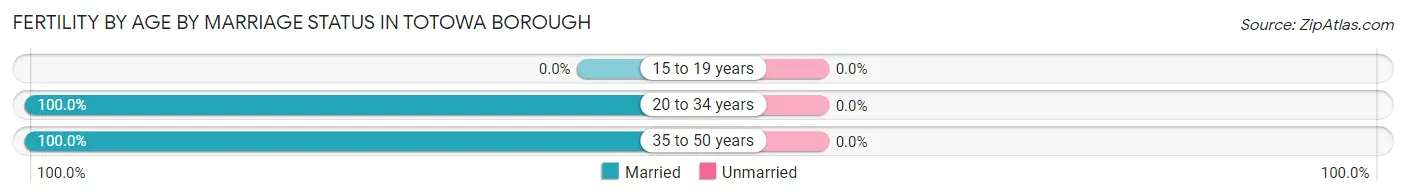
Fertility by Age by Marriage Status in Totowa borough
| Age Bracket | Married | Unmarried |
| 15 to 19 years | 0 (0.0%) | 0 (0.0%) |
| 20 to 34 years | 46 (100.0%) | 0 (0.0%) |
| 35 to 50 years | 15 (100.0%) | 0 (0.0%) |
| Total | 61 (100.0%) | 0 (0.0%) |
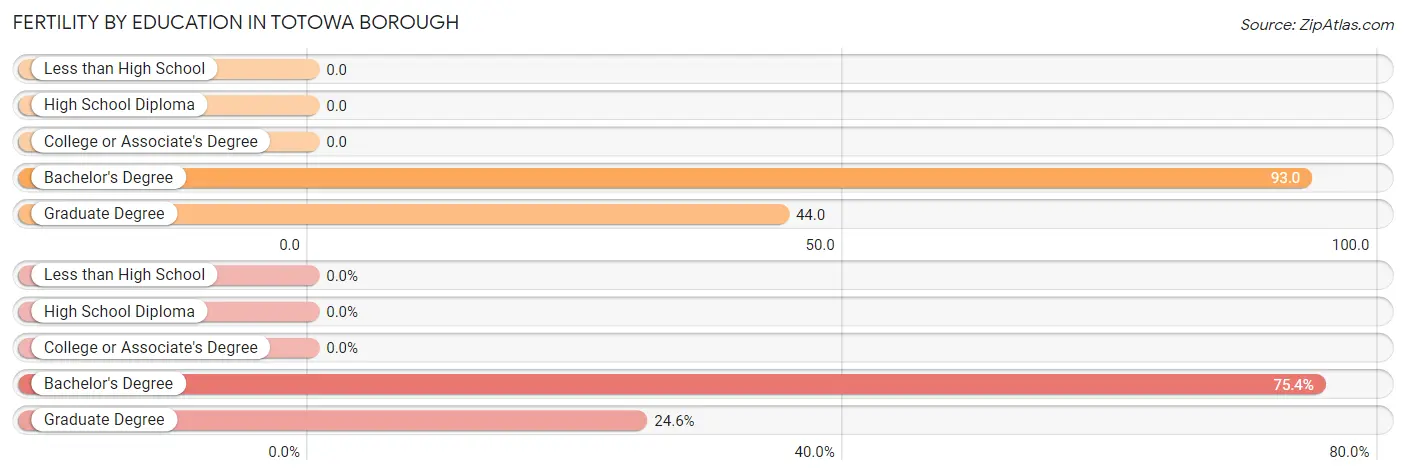
Fertility by Education in Totowa borough
| Educational Attainment | Women with Births | Births / 1,000 Women |
| Less than High School | 0 (0.0%) | 0.0 |
| High School Diploma | 0 (0.0%) | 0.0 |
| College or Associate's Degree | 0 (0.0%) | 0.0 |
| Bachelor's Degree | 46 (75.4%) | 93.0 |
| Graduate Degree | 15 (24.6%) | 44.0 |
| Total | 61 (100.0%) | 29.0 |
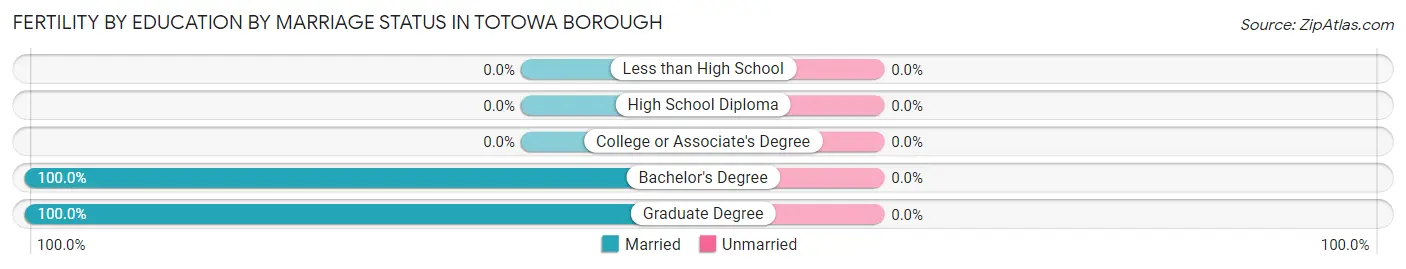
Fertility by Education by Marriage Status in Totowa borough
| Educational Attainment | Married | Unmarried |
| Less than High School | 0 (0.0%) | 0 (0.0%) |
| High School Diploma | 0 (0.0%) | 0 (0.0%) |
| College or Associate's Degree | 0 (0.0%) | 0 (0.0%) |
| Bachelor's Degree | 46 (100.0%) | 0 (0.0%) |
| Graduate Degree | 15 (100.0%) | 0 (0.0%) |
| Total | 61 (100.0%) | 0 (0.0%) |
Employment Characteristics in Totowa borough
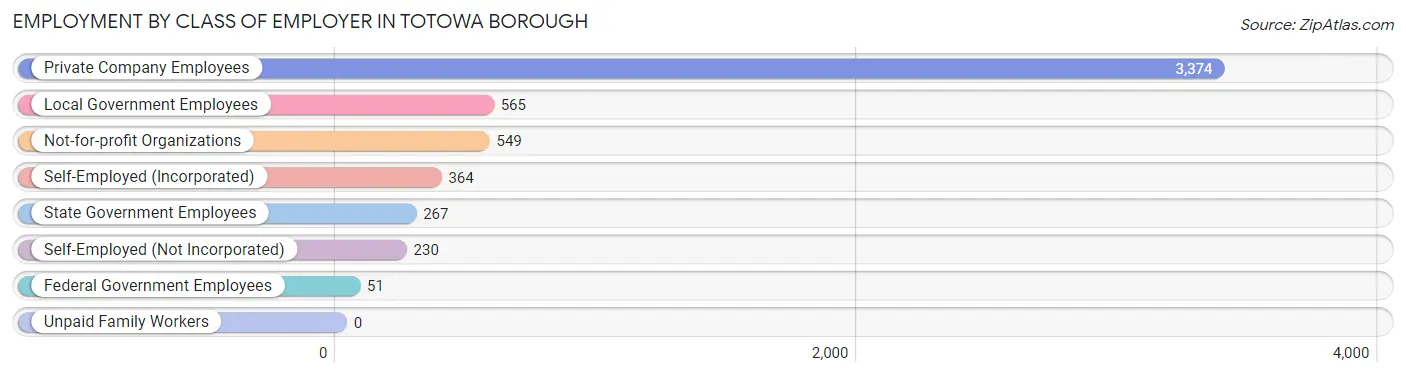
Employment by Class of Employer in Totowa borough
Among the 5,400 employed individuals in Totowa borough, private company employees (3,374 | 62.5%), local government employees (565 | 10.5%), and not-for-profit organizations (549 | 10.2%) make up the most common classes of employment.
| Employer Class | # Employees | % Employees |
| Private Company Employees | 3,374 | 62.5% |
| Self-Employed (Incorporated) | 364 | 6.7% |
| Self-Employed (Not Incorporated) | 230 | 4.3% |
| Not-for-profit Organizations | 549 | 10.2% |
| Local Government Employees | 565 | 10.5% |
| State Government Employees | 267 | 4.9% |
| Federal Government Employees | 51 | 0.9% |
| Unpaid Family Workers | 0 | 0.0% |
| Total | 5,400 | 100.0% |
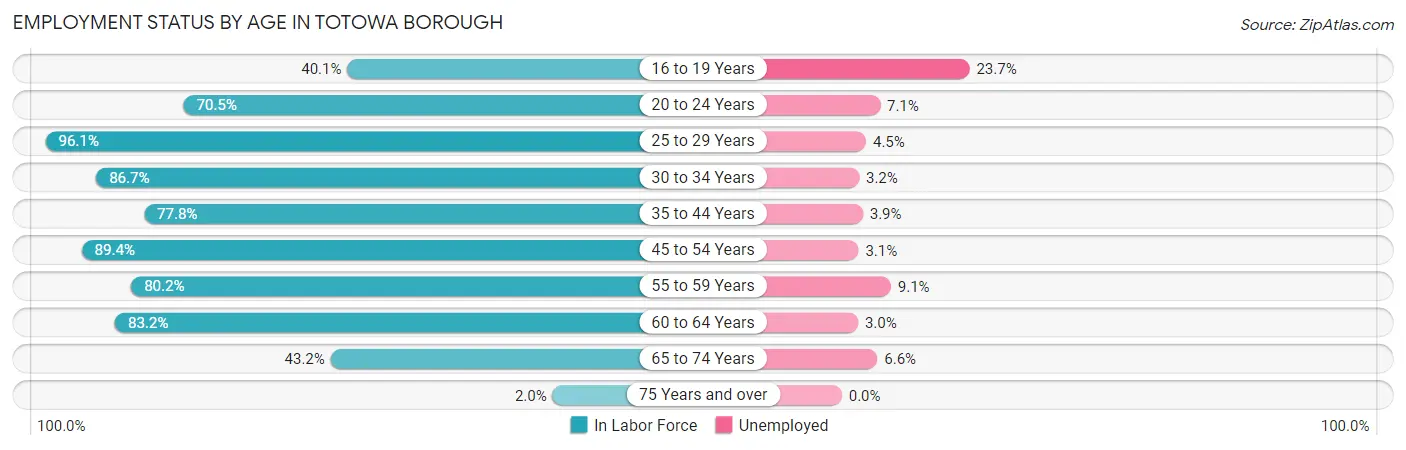
Employment Status by Age in Totowa borough
According to the labor force statistics for Totowa borough, out of the total population over 16 years of age (8,728), 67.0% or 5,848 individuals are in the labor force, with 5.4% or 316 of them unemployed. The age group with the highest labor force participation rate is 25 to 29 years, with 96.1% or 646 individuals in the labor force. Within the labor force, the 16 to 19 years age range has the highest percentage of unemployed individuals, with 23.7% or 53 of them being unemployed.
| Age Bracket | In Labor Force | Unemployed |
| 16 to 19 Years | 225 (40.1%) | 53 (23.7%) |
| 20 to 24 Years | 210 (70.5%) | 15 (7.1%) |
| 25 to 29 Years | 646 (96.1%) | 29 (4.5%) |
| 30 to 34 Years | 345 (86.7%) | 11 (3.2%) |
| 35 to 44 Years | 1,264 (77.8%) | 49 (3.9%) |
| 45 to 54 Years | 1,277 (89.4%) | 40 (3.1%) |
| 55 to 59 Years | 750 (80.2%) | 68 (9.1%) |
| 60 to 64 Years | 570 (83.2%) | 17 (3.0%) |
| 65 to 74 Years | 545 (43.2%) | 36 (6.6%) |
| 75 Years and over | 17 (2.0%) | 0 (0.0%) |
| Total | 5,848 (67.0%) | 316 (5.4%) |
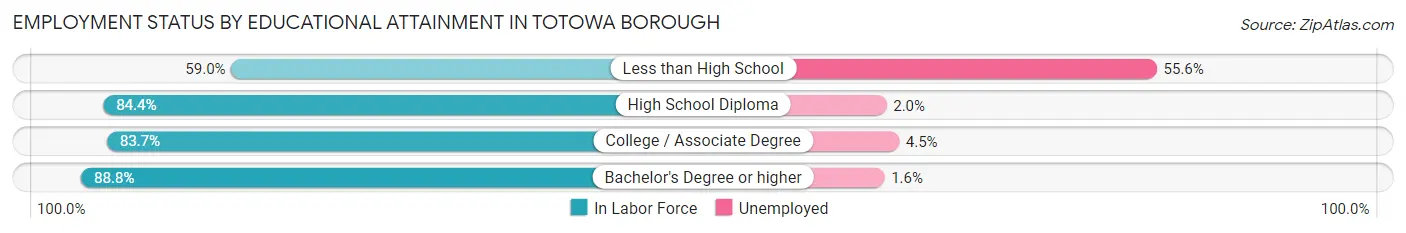
Employment Status by Educational Attainment in Totowa borough
According to labor force statistics for Totowa borough, 84.5% of individuals (4,853) out of the total population between 25 and 64 years of age (5,743) are in the labor force, with 4.4% or 214 of them being unemployed. The group with the highest labor force participation rate are those with the educational attainment of bachelor's degree or higher, with 88.8% or 1,796 individuals in the labor force. Within the labor force, individuals with less than high school education have the highest percentage of unemployment, with 55.6% or 89 of them being unemployed.
| Educational Attainment | In Labor Force | Unemployed |
| Less than High School | 160 (59.0%) | 151 (55.6%) |
| High School Diploma | 1,409 (84.4%) | 33 (2.0%) |
| College / Associate Degree | 1,490 (83.7%) | 80 (4.5%) |
| Bachelor's Degree or higher | 1,796 (88.8%) | 32 (1.6%) |
| Total | 4,853 (84.5%) | 253 (4.4%) |
Employment Occupations by Sex in Totowa borough
Management, Business, Science and Arts Occupations
The most common Management, Business, Science and Arts occupations in Totowa borough are Community & Social Service (801 | 14.5%), Education Instruction & Library (556 | 10.1%), Management (542 | 9.8%), Business & Financial (423 | 7.7%), and Computers, Engineering & Science (313 | 5.7%).
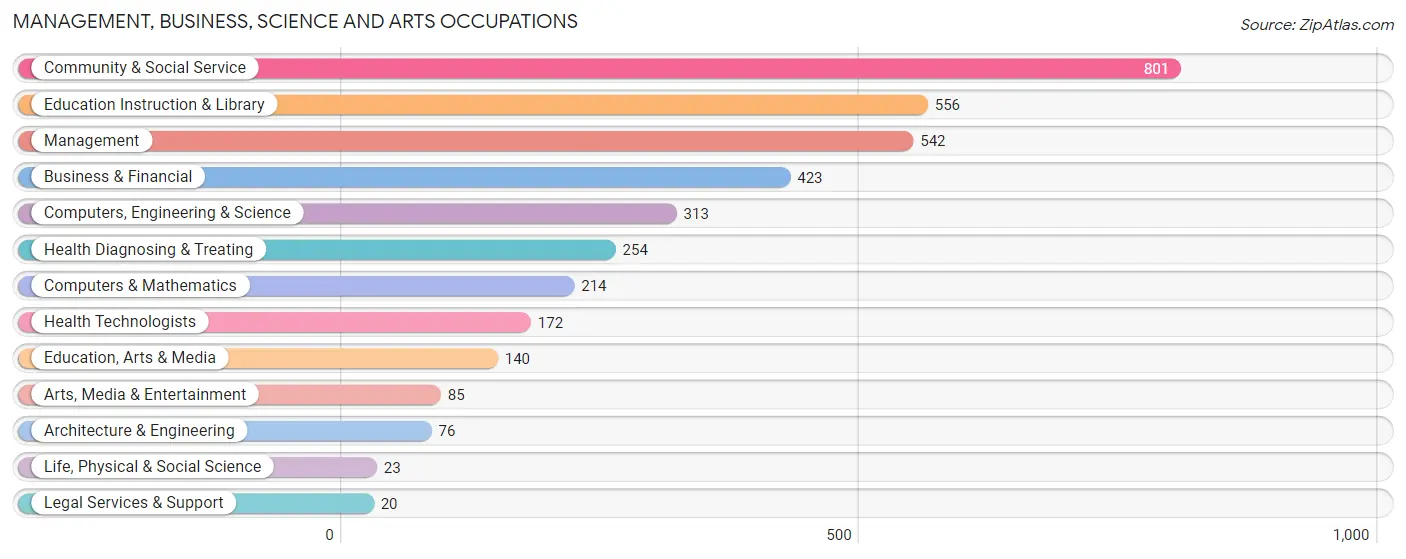
Management, Business, Science and Arts Occupations by Sex
Within the Management, Business, Science and Arts occupations in Totowa borough, the most male-oriented occupations are Architecture & Engineering (100.0%), Life, Physical & Social Science (100.0%), and Computers, Engineering & Science (93.9%), while the most female-oriented occupations are Legal Services & Support (100.0%), Education, Arts & Media (82.9%), and Education Instruction & Library (78.2%).
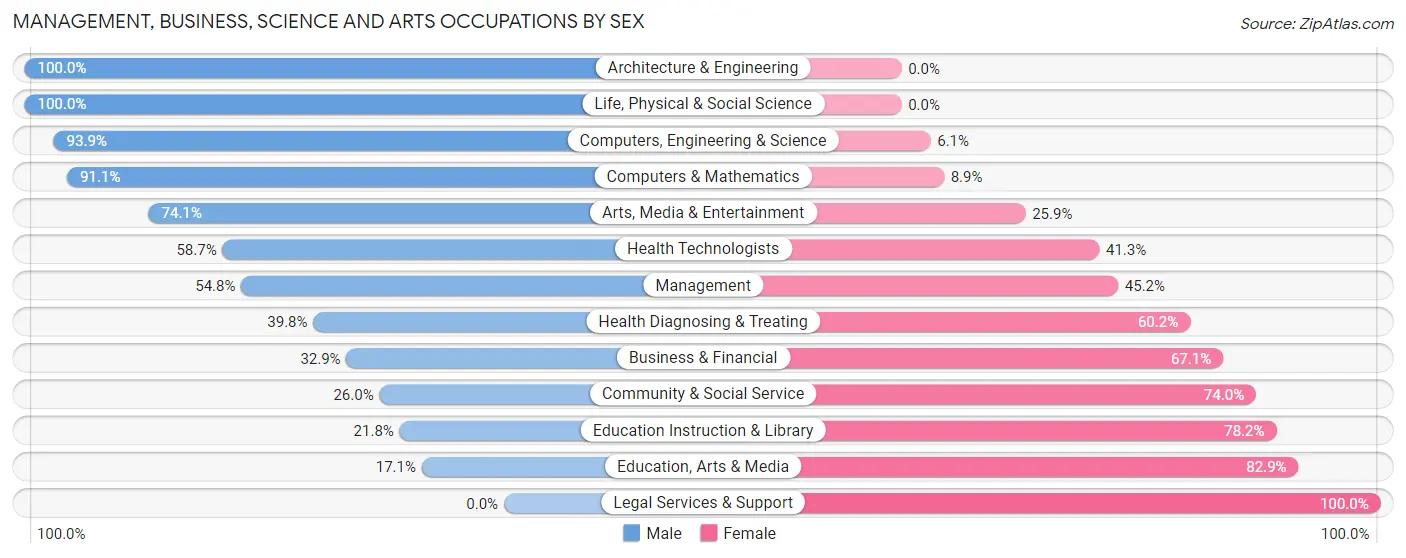
| Occupation | Male | Female |
| Management | 297 (54.8%) | 245 (45.2%) |
| Business & Financial | 139 (32.9%) | 284 (67.1%) |
| Computers, Engineering & Science | 294 (93.9%) | 19 (6.1%) |
| Computers & Mathematics | 195 (91.1%) | 19 (8.9%) |
| Architecture & Engineering | 76 (100.0%) | 0 (0.0%) |
| Life, Physical & Social Science | 23 (100.0%) | 0 (0.0%) |
| Community & Social Service | 208 (26.0%) | 593 (74.0%) |
| Education, Arts & Media | 24 (17.1%) | 116 (82.9%) |
| Legal Services & Support | 0 (0.0%) | 20 (100.0%) |
| Education Instruction & Library | 121 (21.8%) | 435 (78.2%) |
| Arts, Media & Entertainment | 63 (74.1%) | 22 (25.9%) |
| Health Diagnosing & Treating | 101 (39.8%) | 153 (60.2%) |
| Health Technologists | 101 (58.7%) | 71 (41.3%) |
| Total (Category) | 1,039 (44.5%) | 1,294 (55.5%) |
| Total (Overall) | 2,901 (52.5%) | 2,624 (47.5%) |
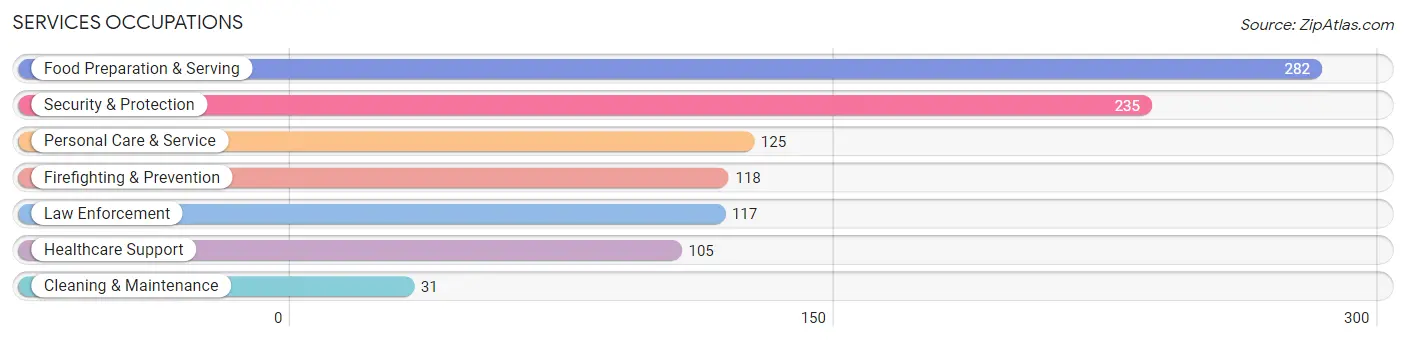
Services Occupations
The most common Services occupations in Totowa borough are Food Preparation & Serving (282 | 5.1%), Security & Protection (235 | 4.3%), Personal Care & Service (125 | 2.3%), Firefighting & Prevention (118 | 2.1%), and Law Enforcement (117 | 2.1%).
Services Occupations by Sex
Within the Services occupations in Totowa borough, the most male-oriented occupations are Law Enforcement (100.0%), Security & Protection (86.4%), and Firefighting & Prevention (72.9%), while the most female-oriented occupations are Personal Care & Service (91.2%), Cleaning & Maintenance (58.1%), and Food Preparation & Serving (47.2%).
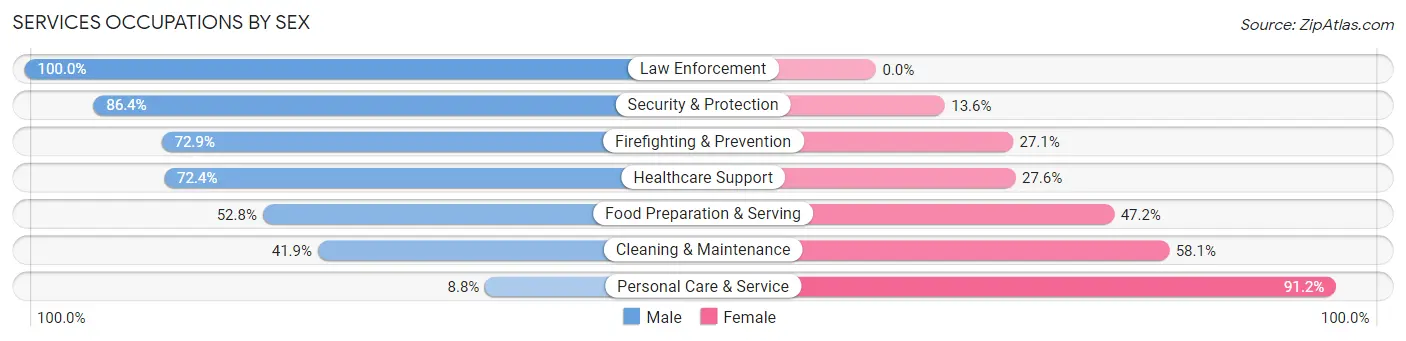
| Occupation | Male | Female |
| Healthcare Support | 76 (72.4%) | 29 (27.6%) |
| Security & Protection | 203 (86.4%) | 32 (13.6%) |
| Firefighting & Prevention | 86 (72.9%) | 32 (27.1%) |
| Law Enforcement | 117 (100.0%) | 0 (0.0%) |
| Food Preparation & Serving | 149 (52.8%) | 133 (47.2%) |
| Cleaning & Maintenance | 13 (41.9%) | 18 (58.1%) |
| Personal Care & Service | 11 (8.8%) | 114 (91.2%) |
| Total (Category) | 452 (58.1%) | 326 (41.9%) |
| Total (Overall) | 2,901 (52.5%) | 2,624 (47.5%) |
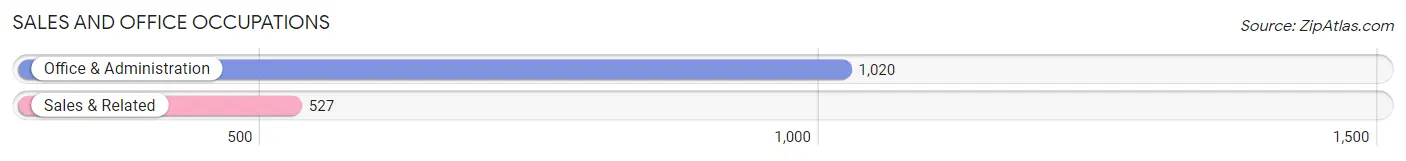
Sales and Office Occupations
The most common Sales and Office occupations in Totowa borough are Office & Administration (1,020 | 18.5%), and Sales & Related (527 | 9.5%).
Sales and Office Occupations by Sex
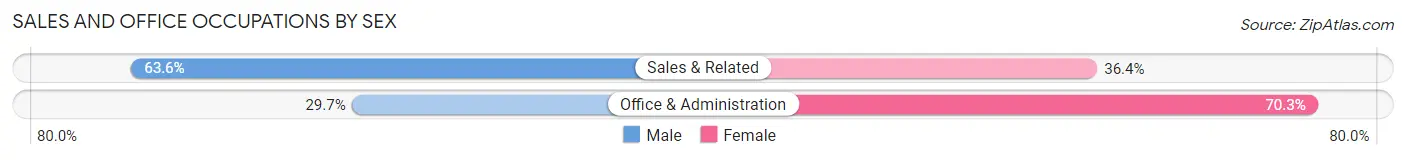
| Occupation | Male | Female |
| Sales & Related | 335 (63.6%) | 192 (36.4%) |
| Office & Administration | 303 (29.7%) | 717 (70.3%) |
| Total (Category) | 638 (41.2%) | 909 (58.8%) |
| Total (Overall) | 2,901 (52.5%) | 2,624 (47.5%) |
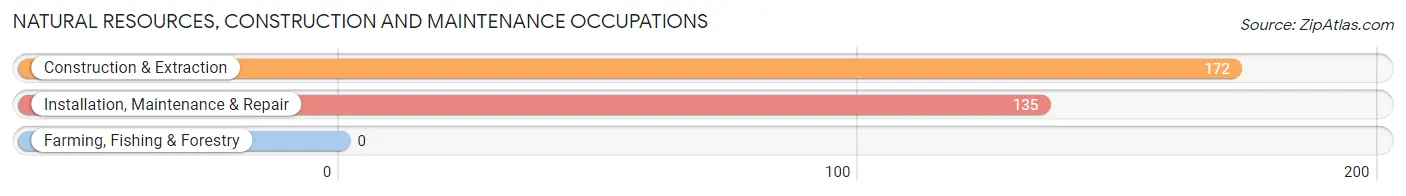
Natural Resources, Construction and Maintenance Occupations
The most common Natural Resources, Construction and Maintenance occupations in Totowa borough are Construction & Extraction (172 | 3.1%), and Installation, Maintenance & Repair (135 | 2.4%).
Natural Resources, Construction and Maintenance Occupations by Sex
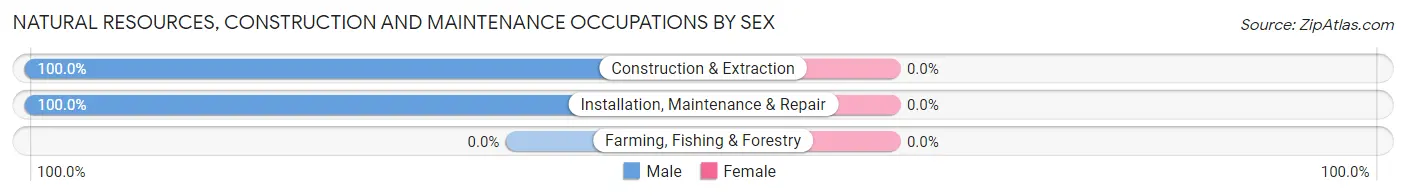
| Occupation | Male | Female |
| Farming, Fishing & Forestry | 0 (0.0%) | 0 (0.0%) |
| Construction & Extraction | 172 (100.0%) | 0 (0.0%) |
| Installation, Maintenance & Repair | 135 (100.0%) | 0 (0.0%) |
| Total (Category) | 307 (100.0%) | 0 (0.0%) |
| Total (Overall) | 2,901 (52.5%) | 2,624 (47.5%) |
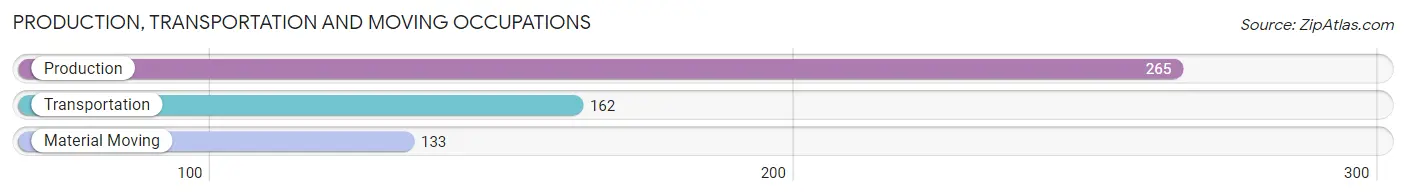
Production, Transportation and Moving Occupations
The most common Production, Transportation and Moving occupations in Totowa borough are Production (265 | 4.8%), Transportation (162 | 2.9%), and Material Moving (133 | 2.4%).
Production, Transportation and Moving Occupations by Sex
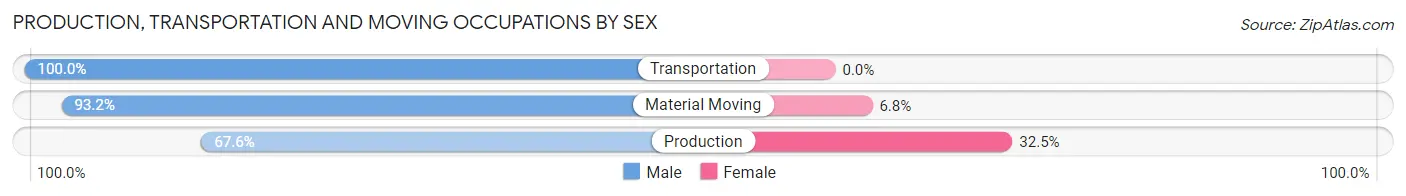
| Occupation | Male | Female |
| Production | 179 (67.5%) | 86 (32.5%) |
| Transportation | 162 (100.0%) | 0 (0.0%) |
| Material Moving | 124 (93.2%) | 9 (6.8%) |
| Total (Category) | 465 (83.0%) | 95 (17.0%) |
| Total (Overall) | 2,901 (52.5%) | 2,624 (47.5%) |
Employment Industries by Sex in Totowa borough
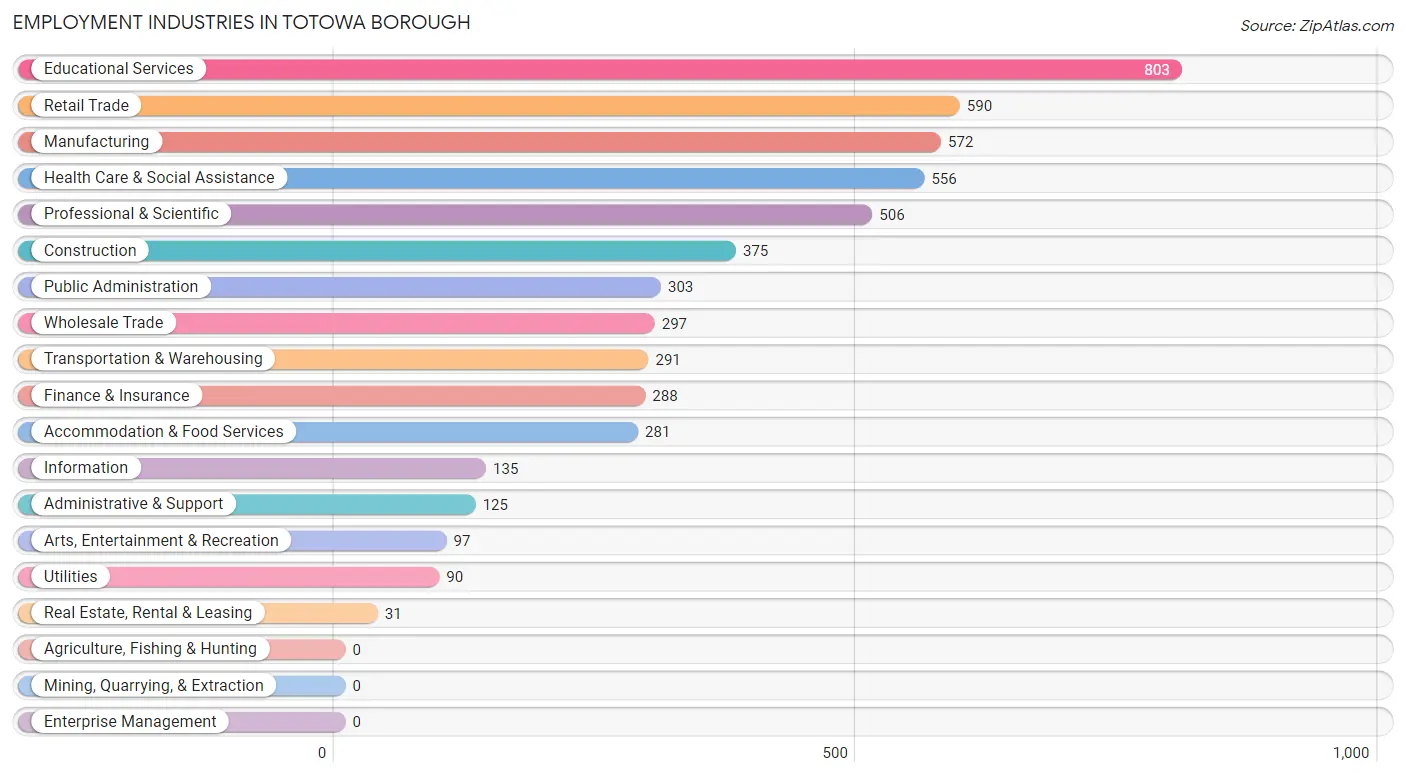
Employment Industries in Totowa borough
The major employment industries in Totowa borough include Educational Services (803 | 14.5%), Retail Trade (590 | 10.7%), Manufacturing (572 | 10.3%), Health Care & Social Assistance (556 | 10.1%), and Professional & Scientific (506 | 9.2%).
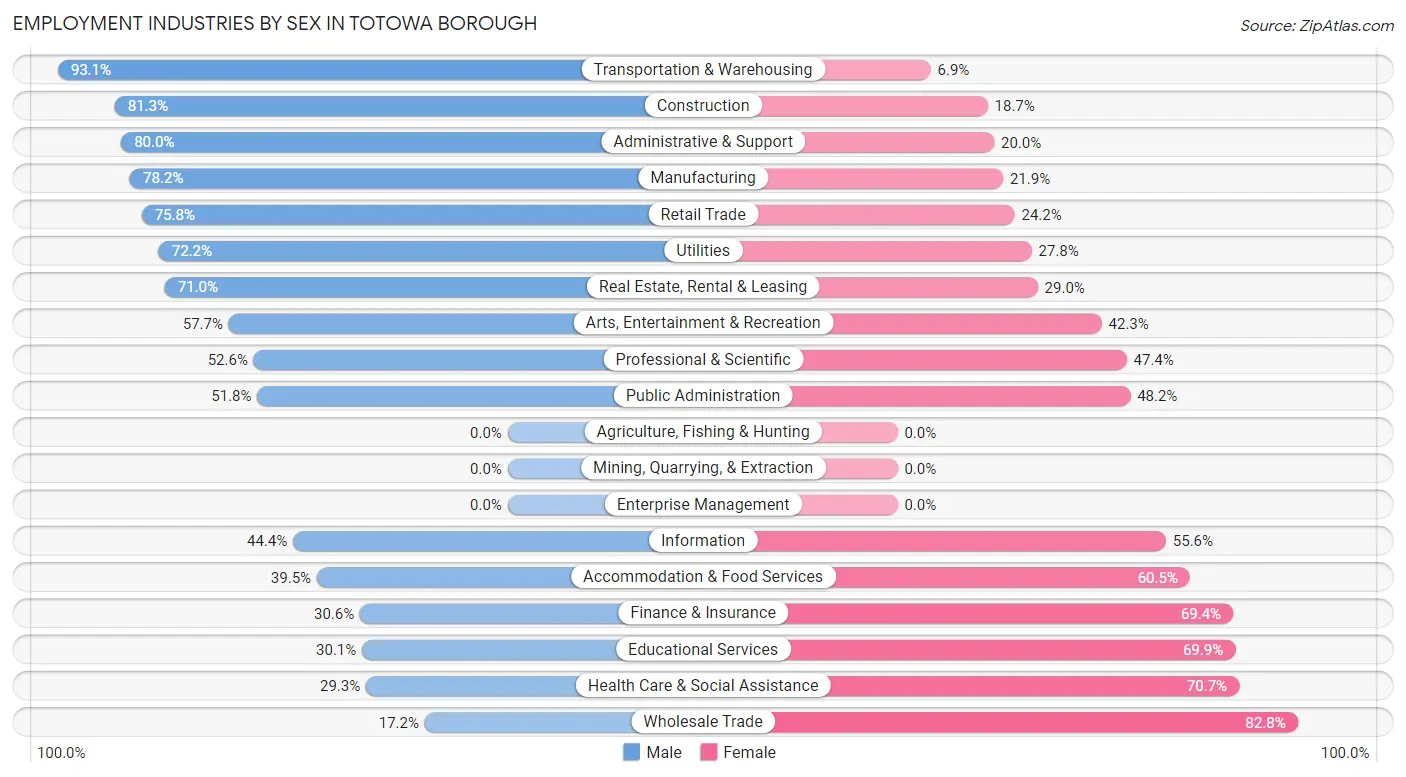
Employment Industries by Sex in Totowa borough
The Totowa borough industries that see more men than women are Transportation & Warehousing (93.1%), Construction (81.3%), and Administrative & Support (80.0%), whereas the industries that tend to have a higher number of women are Wholesale Trade (82.8%), Health Care & Social Assistance (70.7%), and Educational Services (69.9%).
| Industry | Male | Female |
| Agriculture, Fishing & Hunting | 0 (0.0%) | 0 (0.0%) |
| Mining, Quarrying, & Extraction | 0 (0.0%) | 0 (0.0%) |
| Construction | 305 (81.3%) | 70 (18.7%) |
| Manufacturing | 447 (78.1%) | 125 (21.8%) |
| Wholesale Trade | 51 (17.2%) | 246 (82.8%) |
| Retail Trade | 447 (75.8%) | 143 (24.2%) |
| Transportation & Warehousing | 271 (93.1%) | 20 (6.9%) |
| Utilities | 65 (72.2%) | 25 (27.8%) |
| Information | 60 (44.4%) | 75 (55.6%) |
| Finance & Insurance | 88 (30.6%) | 200 (69.4%) |
| Real Estate, Rental & Leasing | 22 (71.0%) | 9 (29.0%) |
| Professional & Scientific | 266 (52.6%) | 240 (47.4%) |
| Enterprise Management | 0 (0.0%) | 0 (0.0%) |
| Administrative & Support | 100 (80.0%) | 25 (20.0%) |
| Educational Services | 242 (30.1%) | 561 (69.9%) |
| Health Care & Social Assistance | 163 (29.3%) | 393 (70.7%) |
| Arts, Entertainment & Recreation | 56 (57.7%) | 41 (42.3%) |
| Accommodation & Food Services | 111 (39.5%) | 170 (60.5%) |
| Public Administration | 157 (51.8%) | 146 (48.2%) |
| Total | 2,901 (52.5%) | 2,624 (47.5%) |
Education in Totowa borough
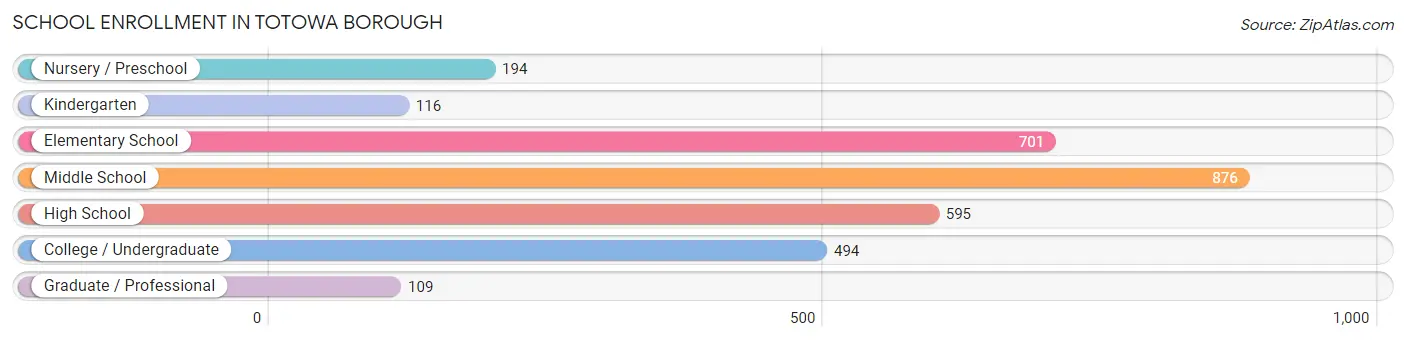
School Enrollment in Totowa borough
The most common levels of schooling among the 3,085 students in Totowa borough are middle school (876 | 28.4%), elementary school (701 | 22.7%), and high school (595 | 19.3%).
| School Level | # Students | % Students |
| Nursery / Preschool | 194 | 6.3% |
| Kindergarten | 116 | 3.8% |
| Elementary School | 701 | 22.7% |
| Middle School | 876 | 28.4% |
| High School | 595 | 19.3% |
| College / Undergraduate | 494 | 16.0% |
| Graduate / Professional | 109 | 3.5% |
| Total | 3,085 | 100.0% |
School Enrollment by Age by Funding Source in Totowa borough
Out of a total of 3,085 students who are enrolled in schools in Totowa borough, 771 (25.0%) attend a private institution, while the remaining 2,314 (75.0%) are enrolled in public schools. The age group of 35 years and over has the highest likelihood of being enrolled in private schools, with 127 (70.2% in the age bracket) enrolled. Conversely, the age group of 25 to 34 year olds has the lowest likelihood of being enrolled in a private school, with 237 (87.5% in the age bracket) attending a public institution.
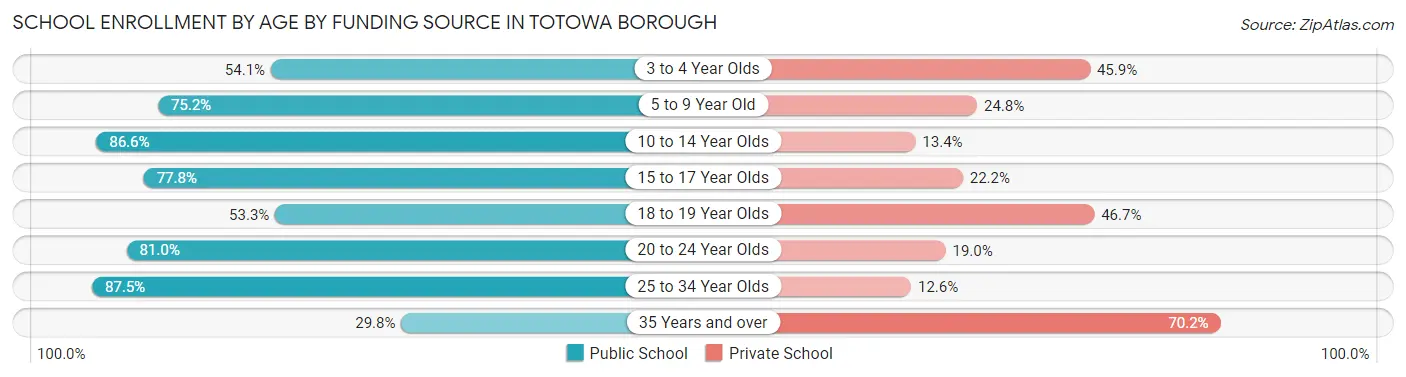
| Age Bracket | Public School | Private School |
| 3 to 4 Year Olds | 105 (54.1%) | 89 (45.9%) |
| 5 to 9 Year Old | 596 (75.2%) | 197 (24.8%) |
| 10 to 14 Year Olds | 830 (86.6%) | 128 (13.4%) |
| 15 to 17 Year Olds | 277 (77.8%) | 79 (22.2%) |
| 18 to 19 Year Olds | 104 (53.3%) | 91 (46.7%) |
| 20 to 24 Year Olds | 111 (81.0%) | 26 (19.0%) |
| 25 to 34 Year Olds | 237 (87.5%) | 34 (12.6%) |
| 35 Years and over | 54 (29.8%) | 127 (70.2%) |
| Total | 2,314 (75.0%) | 771 (25.0%) |
Educational Attainment by Field of Study in Totowa borough
Education (794 | 27.0%), business (582 | 19.8%), engineering (266 | 9.0%), science & technology (232 | 7.9%), and arts & humanities (193 | 6.6%) are the most common fields of study among 2,945 individuals in Totowa borough who have obtained a bachelor's degree or higher.
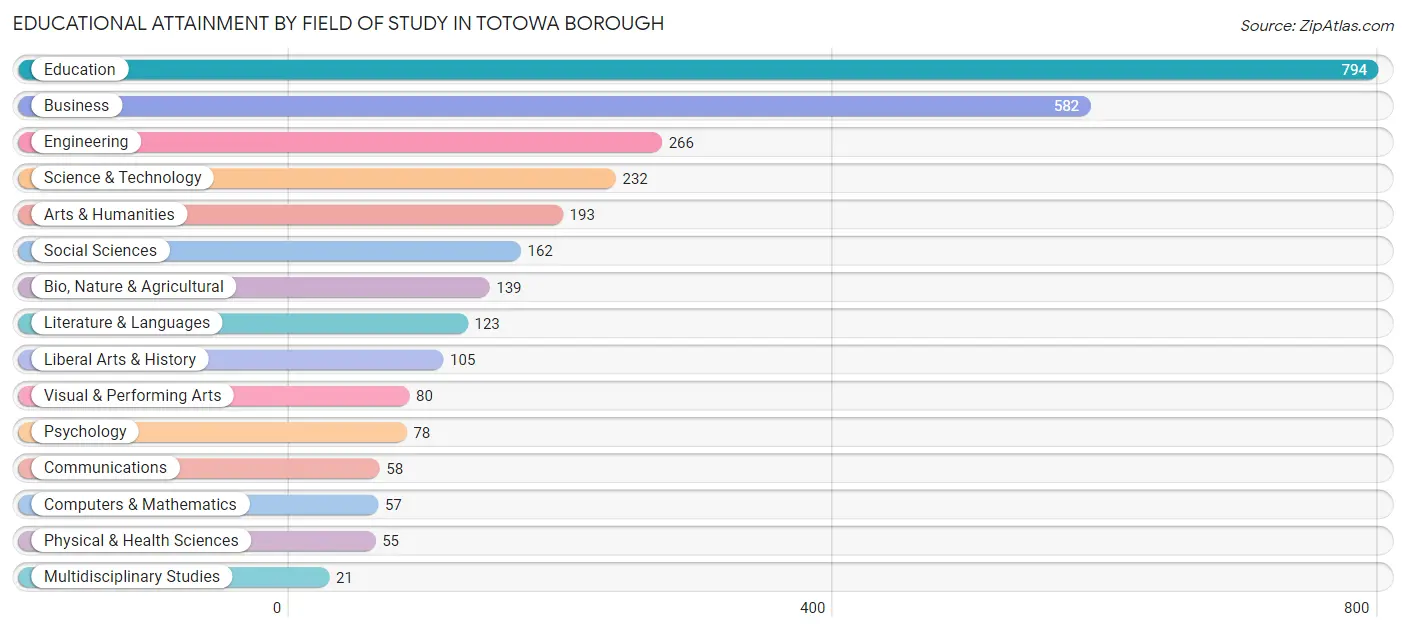
| Field of Study | # Graduates | % Graduates |
| Computers & Mathematics | 57 | 1.9% |
| Bio, Nature & Agricultural | 139 | 4.7% |
| Physical & Health Sciences | 55 | 1.9% |
| Psychology | 78 | 2.6% |
| Social Sciences | 162 | 5.5% |
| Engineering | 266 | 9.0% |
| Multidisciplinary Studies | 21 | 0.7% |
| Science & Technology | 232 | 7.9% |
| Business | 582 | 19.8% |
| Education | 794 | 27.0% |
| Literature & Languages | 123 | 4.2% |
| Liberal Arts & History | 105 | 3.6% |
| Visual & Performing Arts | 80 | 2.7% |
| Communications | 58 | 2.0% |
| Arts & Humanities | 193 | 6.6% |
| Total | 2,945 | 100.0% |
Transportation & Commute in Totowa borough
Vehicle Availability by Sex in Totowa borough
The most prevalent vehicle ownership categories in Totowa borough are males with 2 vehicles (986, accounting for 34.6%) and females with 2 vehicles (908, making up 38.7%).
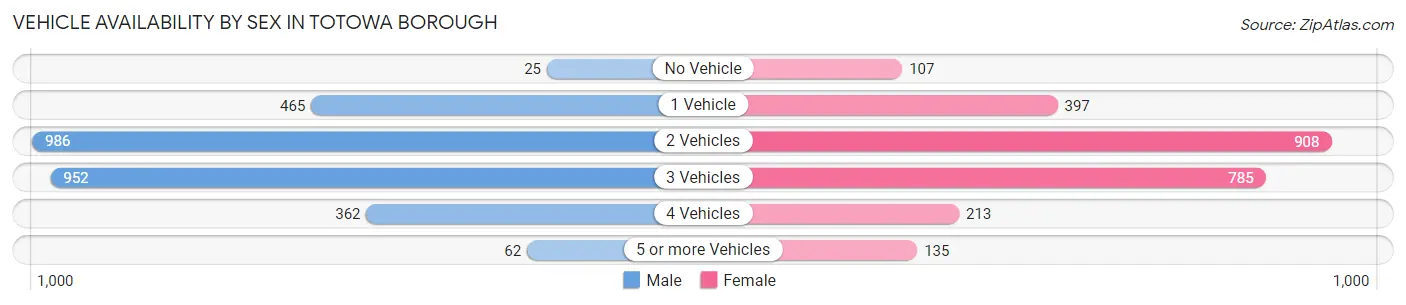
| Vehicles Available | Male | Female |
| No Vehicle | 25 (0.9%) | 107 (4.2%) |
| 1 Vehicle | 465 (16.3%) | 397 (15.6%) |
| 2 Vehicles | 986 (34.6%) | 908 (35.7%) |
| 3 Vehicles | 952 (33.4%) | 785 (30.8%) |
| 4 Vehicles | 362 (12.7%) | 213 (8.4%) |
| 5 or more Vehicles | 62 (2.2%) | 135 (5.3%) |
| Total | 2,852 (100.0%) | 2,545 (100.0%) |
Commute Time in Totowa borough
The most frequently occuring commute durations in Totowa borough are 30 to 34 minutes (849 commuters, 17.8%), 20 to 24 minutes (725 commuters, 15.2%), and 10 to 14 minutes (569 commuters, 11.9%).
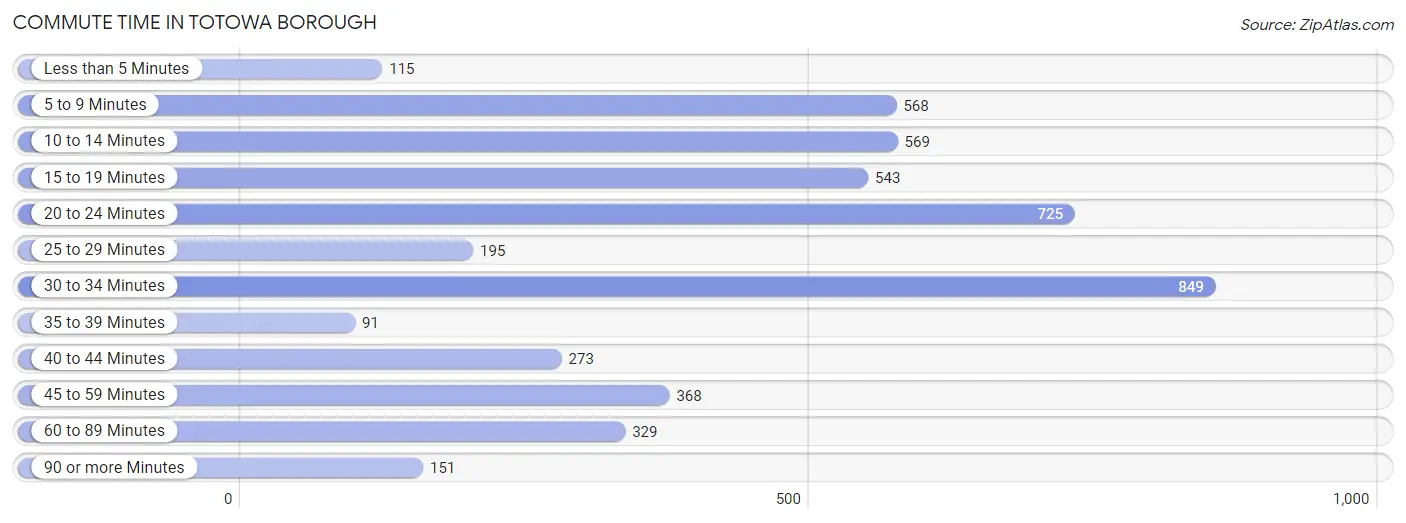
| Commute Time | # Commuters | % Commuters |
| Less than 5 Minutes | 115 | 2.4% |
| 5 to 9 Minutes | 568 | 11.9% |
| 10 to 14 Minutes | 569 | 11.9% |
| 15 to 19 Minutes | 543 | 11.4% |
| 20 to 24 Minutes | 725 | 15.2% |
| 25 to 29 Minutes | 195 | 4.1% |
| 30 to 34 Minutes | 849 | 17.8% |
| 35 to 39 Minutes | 91 | 1.9% |
| 40 to 44 Minutes | 273 | 5.7% |
| 45 to 59 Minutes | 368 | 7.7% |
| 60 to 89 Minutes | 329 | 6.9% |
| 90 or more Minutes | 151 | 3.2% |
Commute Time by Sex in Totowa borough
The most common commute times in Totowa borough are 30 to 34 minutes (517 commuters, 19.4%) for males and 10 to 14 minutes (365 commuters, 17.3%) for females.
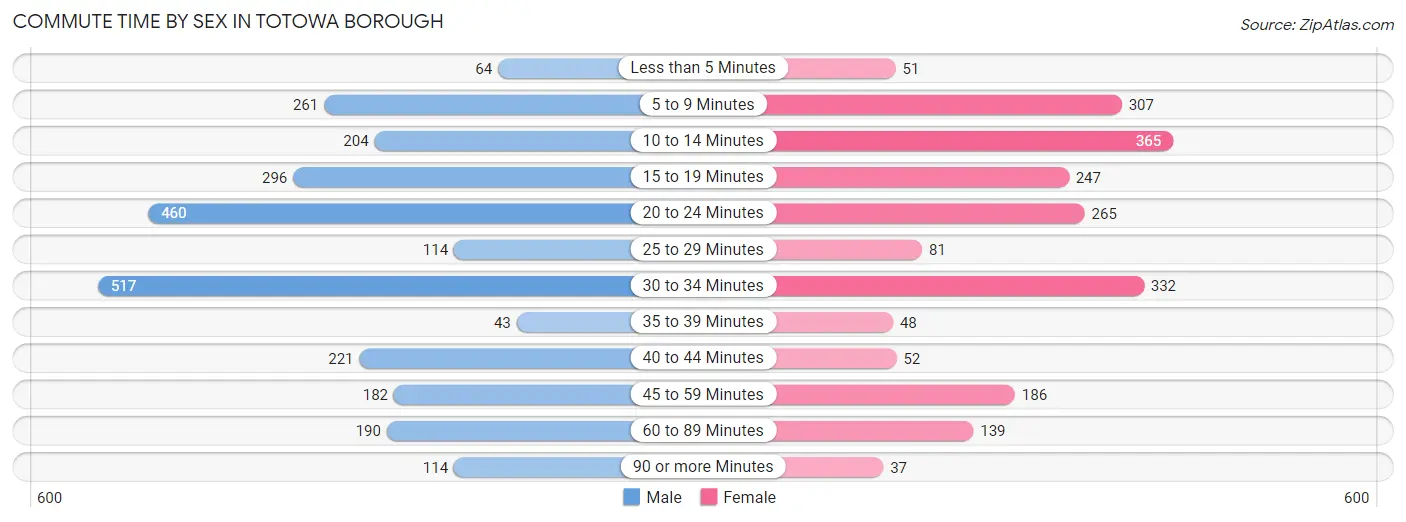
| Commute Time | Male | Female |
| Less than 5 Minutes | 64 (2.4%) | 51 (2.4%) |
| 5 to 9 Minutes | 261 (9.8%) | 307 (14.5%) |
| 10 to 14 Minutes | 204 (7.6%) | 365 (17.3%) |
| 15 to 19 Minutes | 296 (11.1%) | 247 (11.7%) |
| 20 to 24 Minutes | 460 (17.2%) | 265 (12.6%) |
| 25 to 29 Minutes | 114 (4.3%) | 81 (3.8%) |
| 30 to 34 Minutes | 517 (19.4%) | 332 (15.7%) |
| 35 to 39 Minutes | 43 (1.6%) | 48 (2.3%) |
| 40 to 44 Minutes | 221 (8.3%) | 52 (2.5%) |
| 45 to 59 Minutes | 182 (6.8%) | 186 (8.8%) |
| 60 to 89 Minutes | 190 (7.1%) | 139 (6.6%) |
| 90 or more Minutes | 114 (4.3%) | 37 (1.8%) |
Time of Departure to Work by Sex in Totowa borough
The most frequent times of departure to work in Totowa borough are 7:00 AM to 7:29 AM (400, 15.0%) for males and 8:30 AM to 8:59 AM (393, 18.6%) for females.
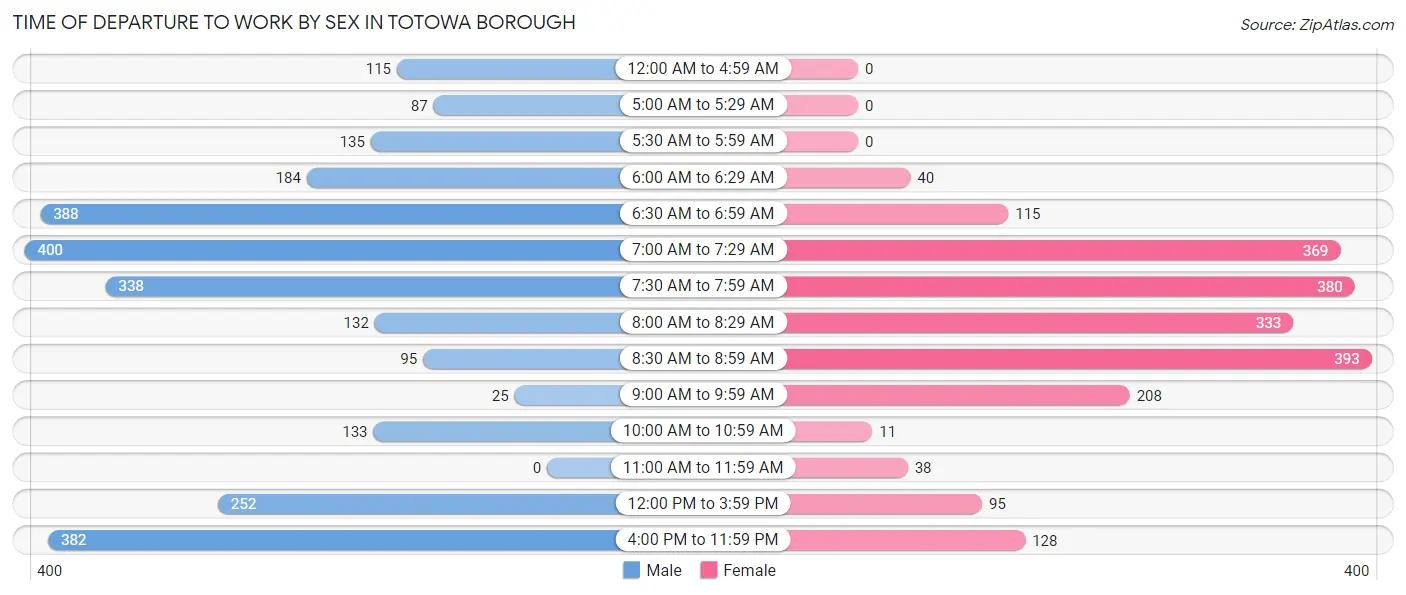
| Time of Departure | Male | Female |
| 12:00 AM to 4:59 AM | 115 (4.3%) | 0 (0.0%) |
| 5:00 AM to 5:29 AM | 87 (3.3%) | 0 (0.0%) |
| 5:30 AM to 5:59 AM | 135 (5.1%) | 0 (0.0%) |
| 6:00 AM to 6:29 AM | 184 (6.9%) | 40 (1.9%) |
| 6:30 AM to 6:59 AM | 388 (14.5%) | 115 (5.4%) |
| 7:00 AM to 7:29 AM | 400 (15.0%) | 369 (17.5%) |
| 7:30 AM to 7:59 AM | 338 (12.7%) | 380 (18.0%) |
| 8:00 AM to 8:29 AM | 132 (5.0%) | 333 (15.8%) |
| 8:30 AM to 8:59 AM | 95 (3.6%) | 393 (18.6%) |
| 9:00 AM to 9:59 AM | 25 (0.9%) | 208 (9.9%) |
| 10:00 AM to 10:59 AM | 133 (5.0%) | 11 (0.5%) |
| 11:00 AM to 11:59 AM | 0 (0.0%) | 38 (1.8%) |
| 12:00 PM to 3:59 PM | 252 (9.5%) | 95 (4.5%) |
| 4:00 PM to 11:59 PM | 382 (14.3%) | 128 (6.1%) |
| Total | 2,666 (100.0%) | 2,110 (100.0%) |
Housing Occupancy in Totowa borough
Occupancy by Ownership in Totowa borough
Of the total 3,781 dwellings in Totowa borough, owner-occupied units account for 2,929 (77.5%), while renter-occupied units make up 852 (22.5%).
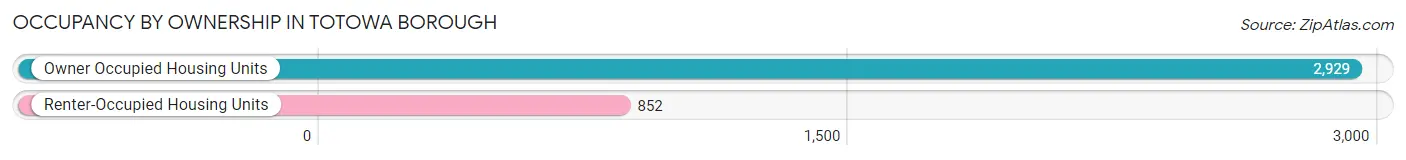
| Occupancy | # Housing Units | % Housing Units |
| Owner Occupied Housing Units | 2,929 | 77.5% |
| Renter-Occupied Housing Units | 852 | 22.5% |
| Total Occupied Housing Units | 3,781 | 100.0% |
Occupancy by Household Size in Totowa borough
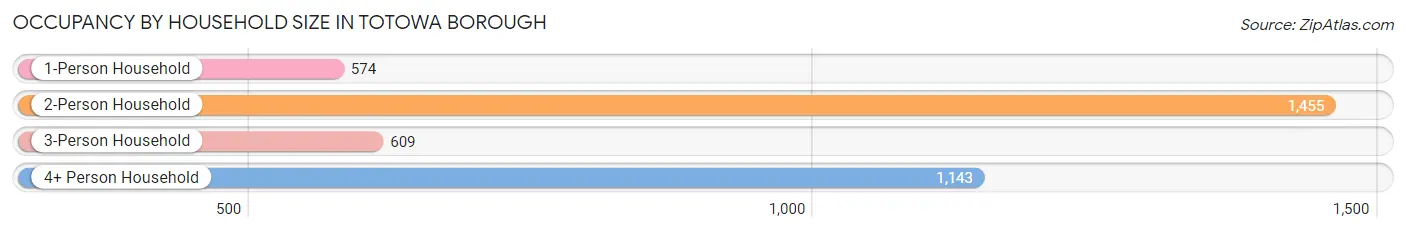
| Household Size | # Housing Units | % Housing Units |
| 1-Person Household | 574 | 15.2% |
| 2-Person Household | 1,455 | 38.5% |
| 3-Person Household | 609 | 16.1% |
| 4+ Person Household | 1,143 | 30.2% |
| Total Housing Units | 3,781 | 100.0% |
Occupancy by Ownership by Household Size in Totowa borough
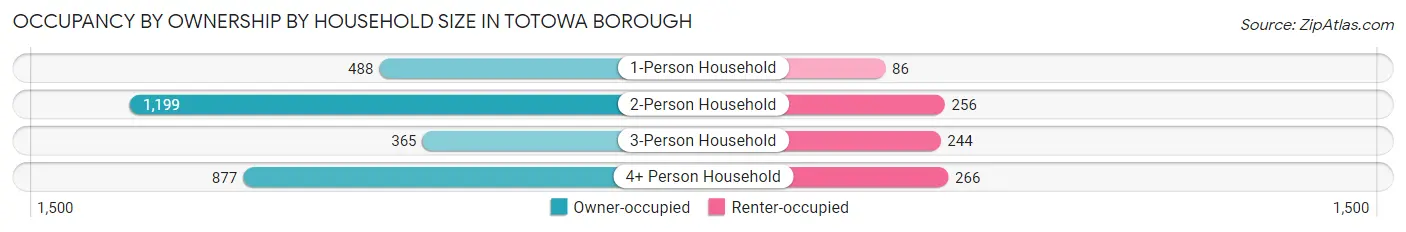
| Household Size | Owner-occupied | Renter-occupied |
| 1-Person Household | 488 (85.0%) | 86 (15.0%) |
| 2-Person Household | 1,199 (82.4%) | 256 (17.6%) |
| 3-Person Household | 365 (59.9%) | 244 (40.1%) |
| 4+ Person Household | 877 (76.7%) | 266 (23.3%) |
| Total Housing Units | 2,929 (77.5%) | 852 (22.5%) |
Occupancy by Educational Attainment in Totowa borough
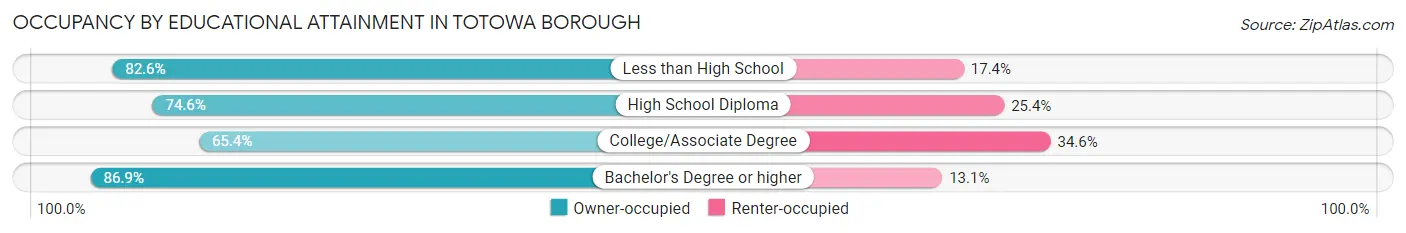
| Household Size | Owner-occupied | Renter-occupied |
| Less than High School | 190 (82.6%) | 40 (17.4%) |
| High School Diploma | 782 (74.6%) | 266 (25.4%) |
| College/Associate Degree | 664 (65.4%) | 351 (34.6%) |
| Bachelor's Degree or higher | 1,293 (86.9%) | 195 (13.1%) |
Occupancy by Age of Householder in Totowa borough
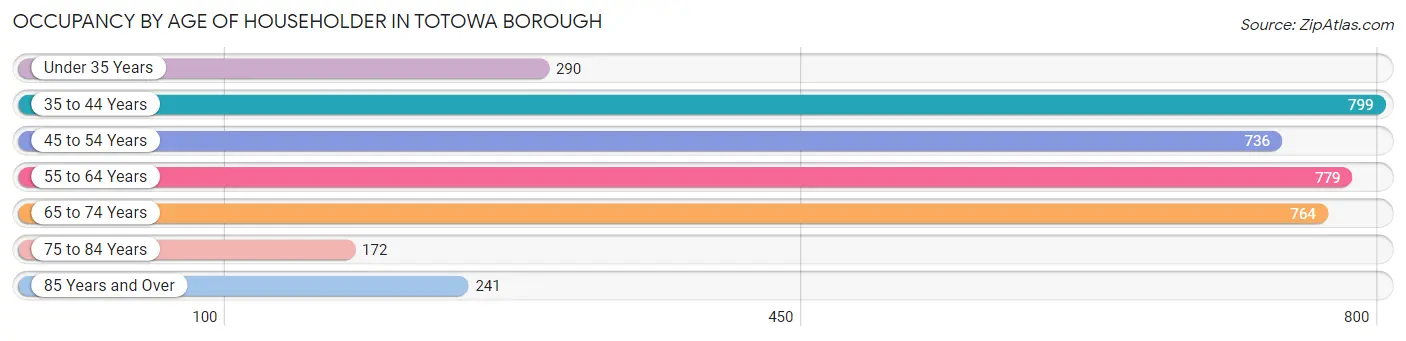
| Age Bracket | # Households | % Households |
| Under 35 Years | 290 | 7.7% |
| 35 to 44 Years | 799 | 21.1% |
| 45 to 54 Years | 736 | 19.5% |
| 55 to 64 Years | 779 | 20.6% |
| 65 to 74 Years | 764 | 20.2% |
| 75 to 84 Years | 172 | 4.5% |
| 85 Years and Over | 241 | 6.4% |
| Total | 3,781 | 100.0% |
Housing Finances in Totowa borough
Median Income by Occupancy in Totowa borough
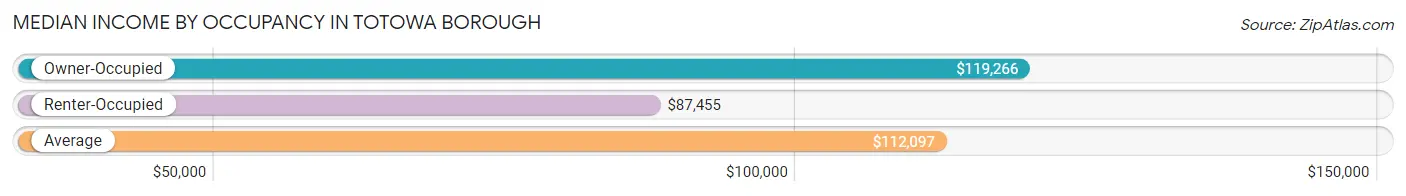
| Occupancy Type | # Households | Median Income |
| Owner-Occupied | 2,929 (77.5%) | $119,266 |
| Renter-Occupied | 852 (22.5%) | $87,455 |
| Average | 3,781 (100.0%) | $112,097 |
Occupancy by Householder Income Bracket in Totowa borough
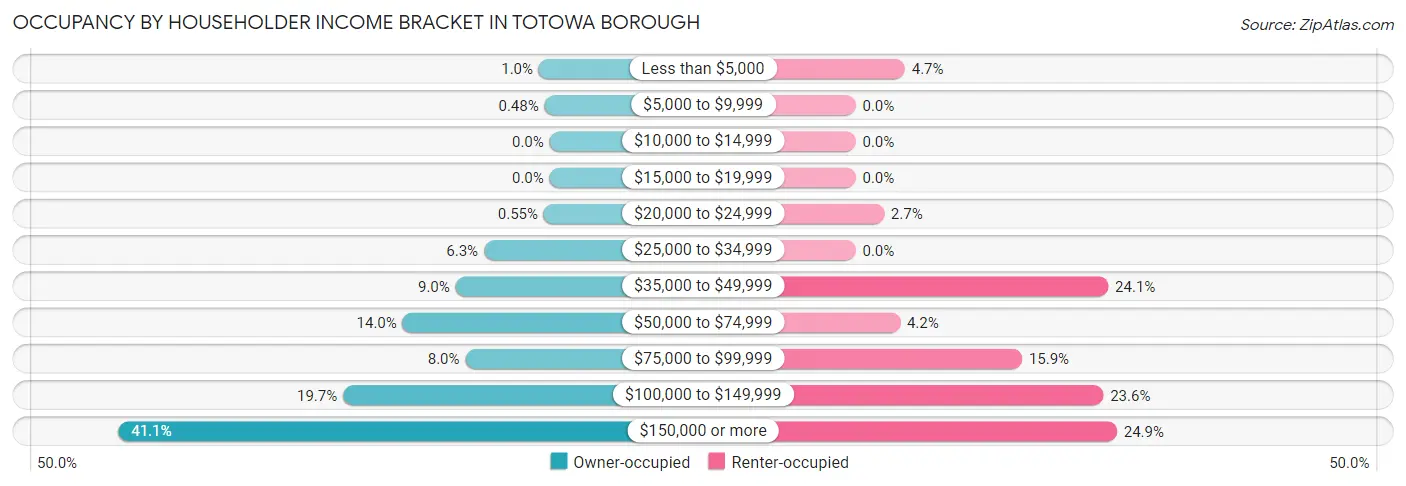
| Income Bracket | Owner-occupied | Renter-occupied |
| Less than $5,000 | 30 (1.0%) | 40 (4.7%) |
| $5,000 to $9,999 | 14 (0.5%) | 0 (0.0%) |
| $10,000 to $14,999 | 0 (0.0%) | 0 (0.0%) |
| $15,000 to $19,999 | 0 (0.0%) | 0 (0.0%) |
| $20,000 to $24,999 | 16 (0.5%) | 23 (2.7%) |
| $25,000 to $34,999 | 183 (6.2%) | 0 (0.0%) |
| $35,000 to $49,999 | 262 (8.9%) | 205 (24.1%) |
| $50,000 to $74,999 | 410 (14.0%) | 36 (4.2%) |
| $75,000 to $99,999 | 235 (8.0%) | 135 (15.9%) |
| $100,000 to $149,999 | 576 (19.7%) | 201 (23.6%) |
| $150,000 or more | 1,203 (41.1%) | 212 (24.9%) |
| Total | 2,929 (100.0%) | 852 (100.0%) |
Monthly Housing Cost Tiers in Totowa borough
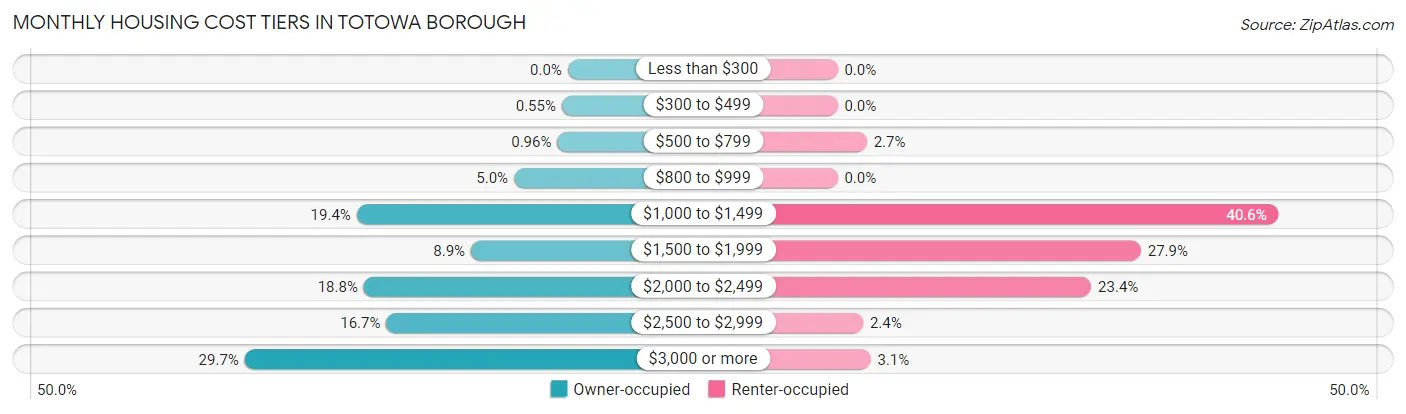
| Monthly Cost | Owner-occupied | Renter-occupied |
| Less than $300 | 0 (0.0%) | 0 (0.0%) |
| $300 to $499 | 16 (0.5%) | 0 (0.0%) |
| $500 to $799 | 28 (1.0%) | 23 (2.7%) |
| $800 to $999 | 145 (5.0%) | 0 (0.0%) |
| $1,000 to $1,499 | 569 (19.4%) | 346 (40.6%) |
| $1,500 to $1,999 | 261 (8.9%) | 238 (27.9%) |
| $2,000 to $2,499 | 550 (18.8%) | 199 (23.4%) |
| $2,500 to $2,999 | 489 (16.7%) | 20 (2.4%) |
| $3,000 or more | 871 (29.7%) | 26 (3.0%) |
| Total | 2,929 (100.0%) | 852 (100.0%) |
Physical Housing Characteristics in Totowa borough
Housing Structures in Totowa borough
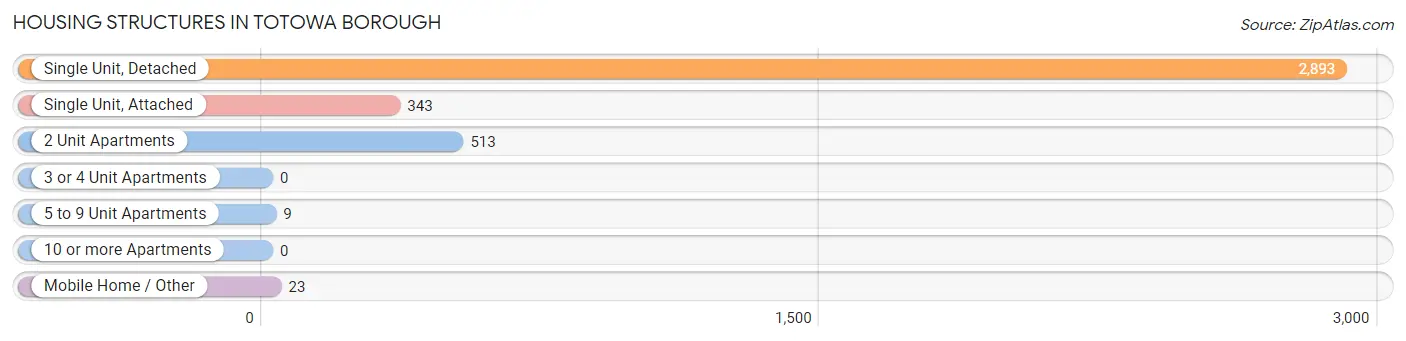
| Structure Type | # Housing Units | % Housing Units |
| Single Unit, Detached | 2,893 | 76.5% |
| Single Unit, Attached | 343 | 9.1% |
| 2 Unit Apartments | 513 | 13.6% |
| 3 or 4 Unit Apartments | 0 | 0.0% |
| 5 to 9 Unit Apartments | 9 | 0.2% |
| 10 or more Apartments | 0 | 0.0% |
| Mobile Home / Other | 23 | 0.6% |
| Total | 3,781 | 100.0% |
Housing Structures by Occupancy in Totowa borough
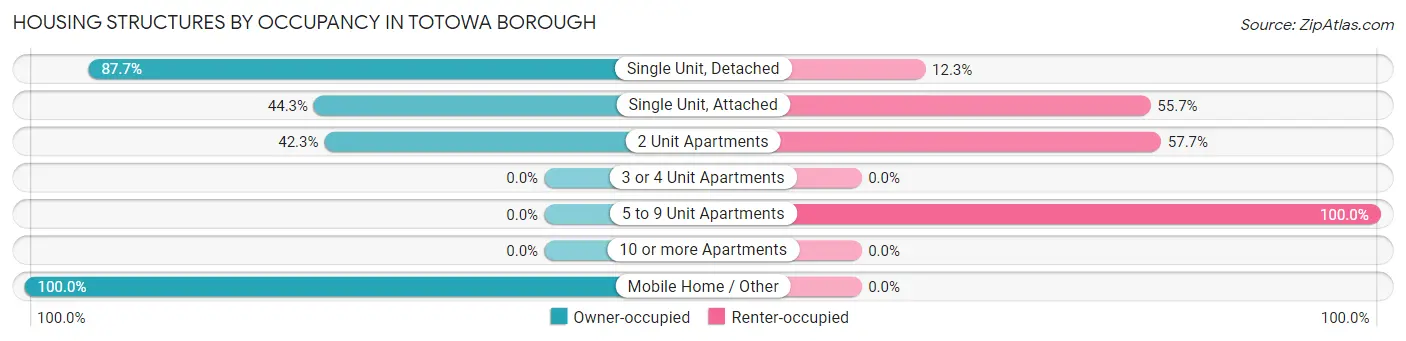
| Structure Type | Owner-occupied | Renter-occupied |
| Single Unit, Detached | 2,537 (87.7%) | 356 (12.3%) |
| Single Unit, Attached | 152 (44.3%) | 191 (55.7%) |
| 2 Unit Apartments | 217 (42.3%) | 296 (57.7%) |
| 3 or 4 Unit Apartments | 0 (0.0%) | 0 (0.0%) |
| 5 to 9 Unit Apartments | 0 (0.0%) | 9 (100.0%) |
| 10 or more Apartments | 0 (0.0%) | 0 (0.0%) |
| Mobile Home / Other | 23 (100.0%) | 0 (0.0%) |
| Total | 2,929 (77.5%) | 852 (22.5%) |
Housing Structures by Number of Rooms in Totowa borough
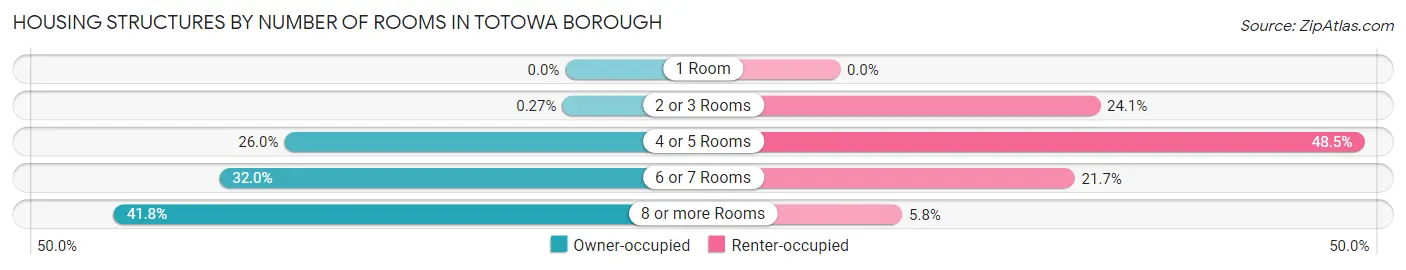
| Number of Rooms | Owner-occupied | Renter-occupied |
| 1 Room | 0 (0.0%) | 0 (0.0%) |
| 2 or 3 Rooms | 8 (0.3%) | 205 (24.1%) |
| 4 or 5 Rooms | 761 (26.0%) | 413 (48.5%) |
| 6 or 7 Rooms | 937 (32.0%) | 185 (21.7%) |
| 8 or more Rooms | 1,223 (41.7%) | 49 (5.8%) |
| Total | 2,929 (100.0%) | 852 (100.0%) |
Housing Structure by Heating Type in Totowa borough
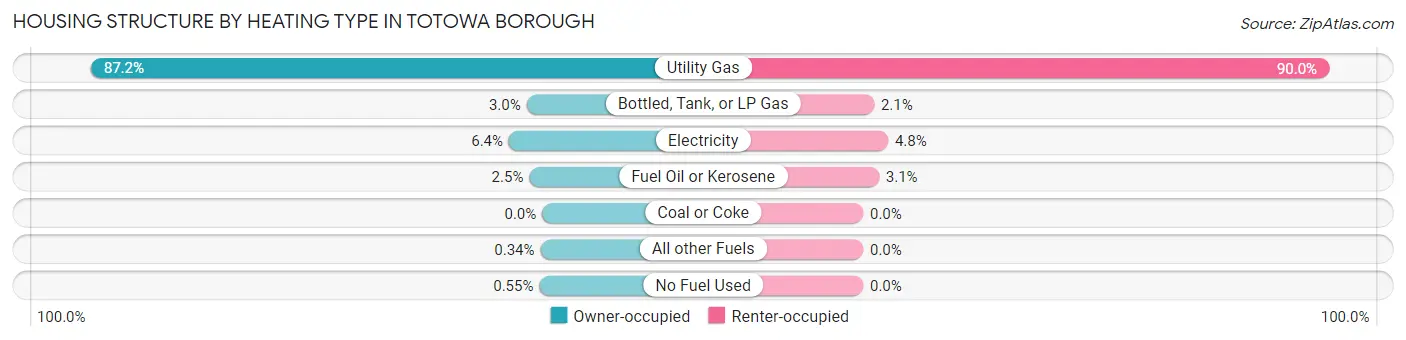
| Heating Type | Owner-occupied | Renter-occupied |
| Utility Gas | 2,554 (87.2%) | 767 (90.0%) |
| Bottled, Tank, or LP Gas | 88 (3.0%) | 18 (2.1%) |
| Electricity | 188 (6.4%) | 41 (4.8%) |
| Fuel Oil or Kerosene | 73 (2.5%) | 26 (3.0%) |
| Coal or Coke | 0 (0.0%) | 0 (0.0%) |
| All other Fuels | 10 (0.3%) | 0 (0.0%) |
| No Fuel Used | 16 (0.5%) | 0 (0.0%) |
| Total | 2,929 (100.0%) | 852 (100.0%) |
Household Vehicle Usage in Totowa borough
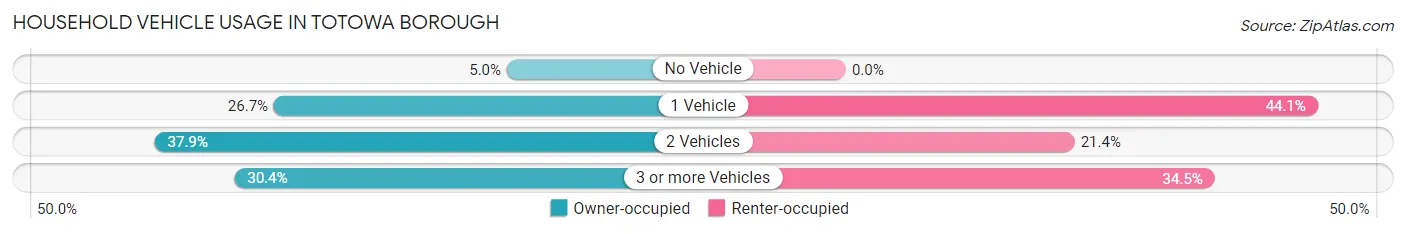
| Vehicles per Household | Owner-occupied | Renter-occupied |
| No Vehicle | 146 (5.0%) | 0 (0.0%) |
| 1 Vehicle | 783 (26.7%) | 376 (44.1%) |
| 2 Vehicles | 1,109 (37.9%) | 182 (21.4%) |
| 3 or more Vehicles | 891 (30.4%) | 294 (34.5%) |
| Total | 2,929 (100.0%) | 852 (100.0%) |
Real Estate & Mortgages in Totowa borough
Real Estate and Mortgage Overview in Totowa borough
| Characteristic | Without Mortgage | With Mortgage |
| Housing Units | 1,087 | 1,842 |
| Median Property Value | $468,600 | $471,700 |
| Median Household Income | $85,703 | $889 |
| Monthly Housing Costs | $1,303 | $853 |
| Real Estate Taxes | $9,894 | $21 |
Property Value by Mortgage Status in Totowa borough
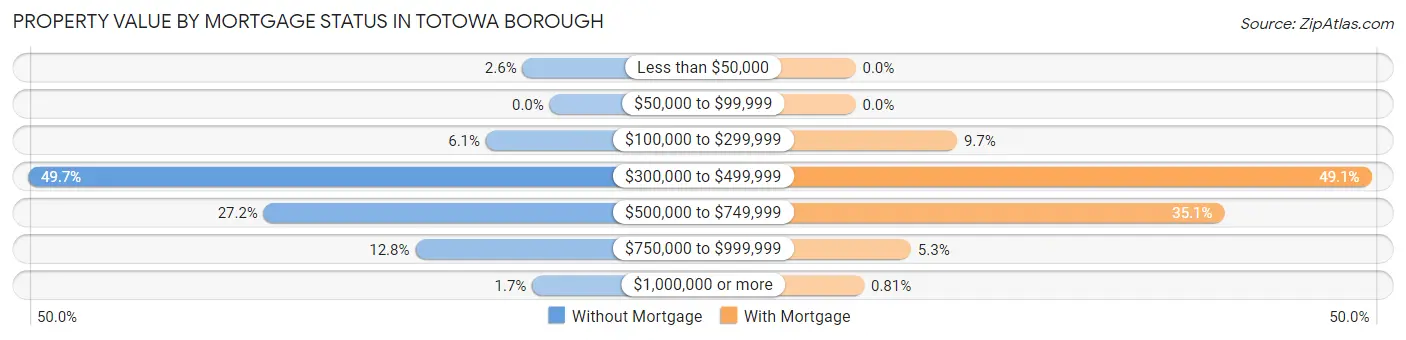
| Property Value | Without Mortgage | With Mortgage |
| Less than $50,000 | 28 (2.6%) | 0 (0.0%) |
| $50,000 to $99,999 | 0 (0.0%) | 0 (0.0%) |
| $100,000 to $299,999 | 66 (6.1%) | 178 (9.7%) |
| $300,000 to $499,999 | 540 (49.7%) | 905 (49.1%) |
| $500,000 to $749,999 | 296 (27.2%) | 647 (35.1%) |
| $750,000 to $999,999 | 139 (12.8%) | 97 (5.3%) |
| $1,000,000 or more | 18 (1.7%) | 15 (0.8%) |
| Total | 1,087 (100.0%) | 1,842 (100.0%) |
Household Income by Mortgage Status in Totowa borough
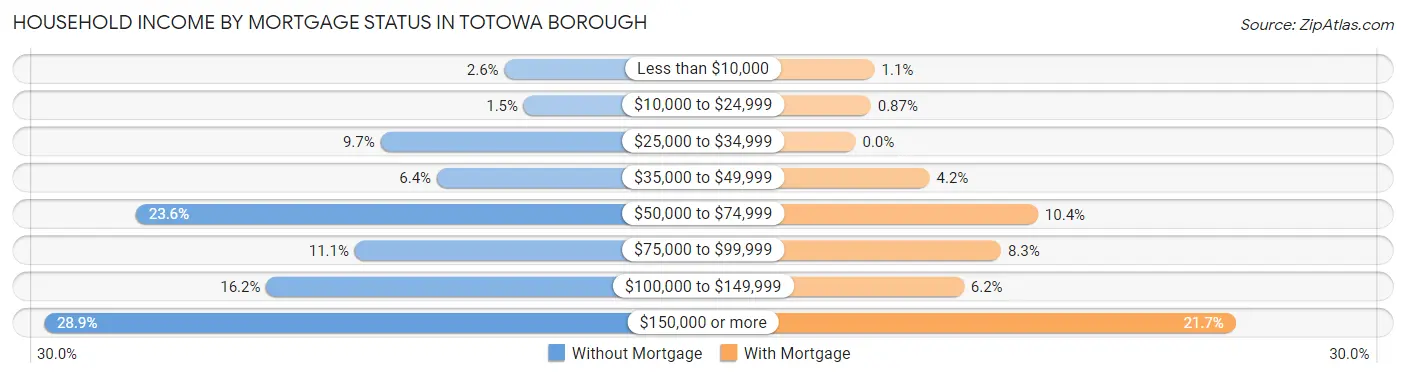
| Household Income | Without Mortgage | With Mortgage |
| Less than $10,000 | 28 (2.6%) | 20 (1.1%) |
| $10,000 to $24,999 | 16 (1.5%) | 16 (0.9%) |
| $25,000 to $34,999 | 105 (9.7%) | 0 (0.0%) |
| $35,000 to $49,999 | 70 (6.4%) | 78 (4.2%) |
| $50,000 to $74,999 | 257 (23.6%) | 192 (10.4%) |
| $75,000 to $99,999 | 121 (11.1%) | 153 (8.3%) |
| $100,000 to $149,999 | 176 (16.2%) | 114 (6.2%) |
| $150,000 or more | 314 (28.9%) | 400 (21.7%) |
| Total | 1,087 (100.0%) | 1,842 (100.0%) |
Property Value to Household Income Ratio in Totowa borough
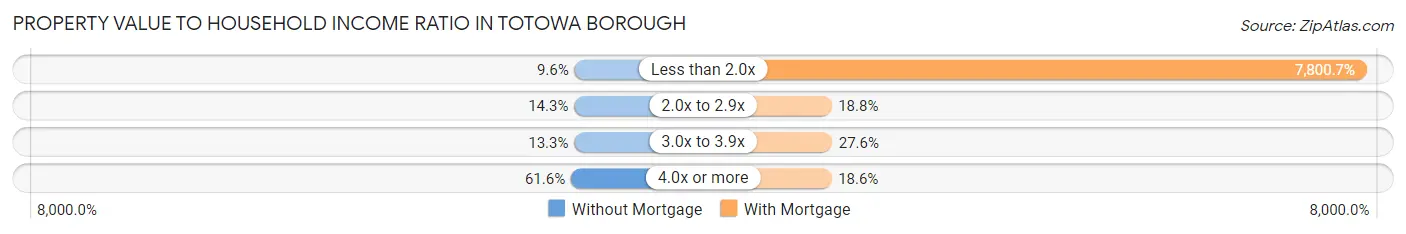
| Value-to-Income Ratio | Without Mortgage | With Mortgage |
| Less than 2.0x | 104 (9.6%) | 143,689 (7,800.7%) |
| 2.0x to 2.9x | 155 (14.3%) | 346 (18.8%) |
| 3.0x to 3.9x | 145 (13.3%) | 509 (27.6%) |
| 4.0x or more | 669 (61.6%) | 342 (18.6%) |
| Total | 1,087 (100.0%) | 1,842 (100.0%) |
Real Estate Taxes by Mortgage Status in Totowa borough
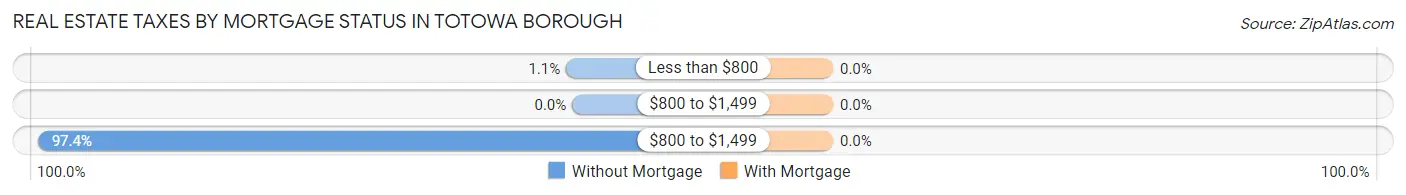
| Property Taxes | Without Mortgage | With Mortgage |
| Less than $800 | 12 (1.1%) | 0 (0.0%) |
| $800 to $1,499 | 0 (0.0%) | 0 (0.0%) |
| $800 to $1,499 | 1,059 (97.4%) | 0 (0.0%) |
| Total | 1,087 (100.0%) | 1,842 (100.0%) |
Health & Disability in Totowa borough
Health Insurance Coverage by Age in Totowa borough
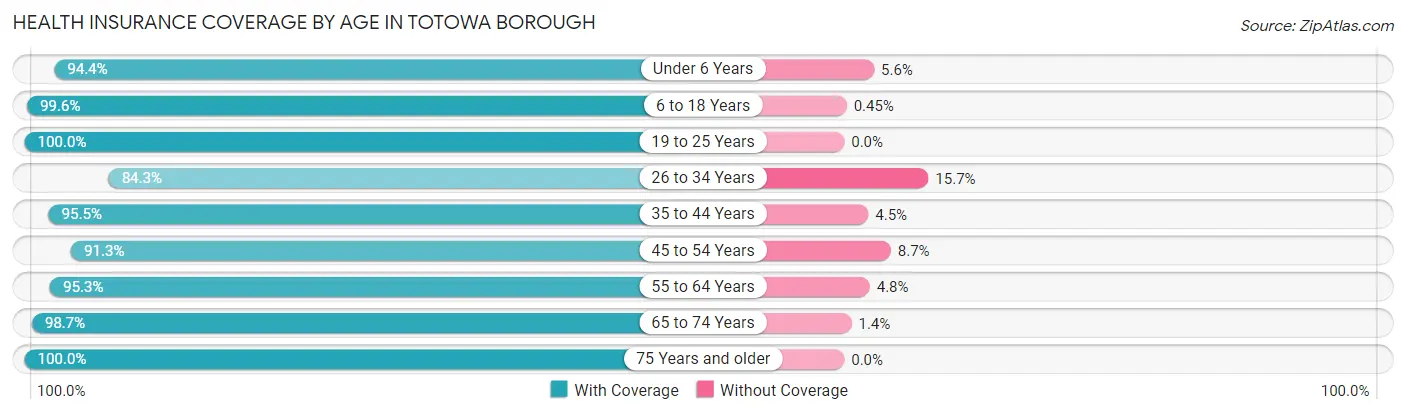
| Age Bracket | With Coverage | Without Coverage |
| Under 6 Years | 442 (94.4%) | 26 (5.6%) |
| 6 to 18 Years | 2,222 (99.6%) | 10 (0.4%) |
| 19 to 25 Years | 545 (100.0%) | 0 (0.0%) |
| 26 to 34 Years | 763 (84.3%) | 142 (15.7%) |
| 35 to 44 Years | 1,552 (95.5%) | 73 (4.5%) |
| 45 to 54 Years | 1,304 (91.3%) | 124 (8.7%) |
| 55 to 64 Years | 1,543 (95.3%) | 77 (4.8%) |
| 65 to 74 Years | 1,238 (98.7%) | 17 (1.3%) |
| 75 Years and older | 780 (100.0%) | 0 (0.0%) |
| Total | 10,389 (95.7%) | 469 (4.3%) |
Health Insurance Coverage by Citizenship Status in Totowa borough
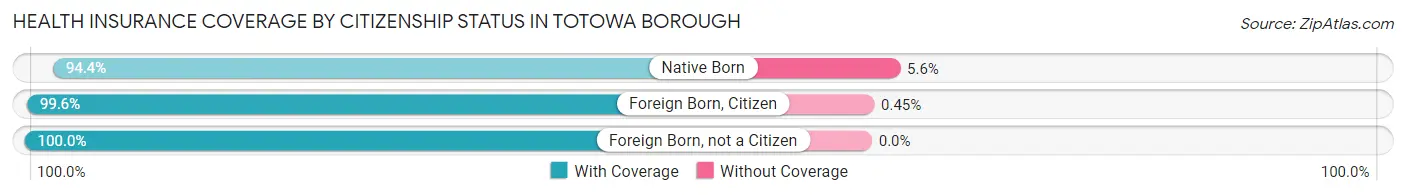
| Citizenship Status | With Coverage | Without Coverage |
| Native Born | 442 (94.4%) | 26 (5.6%) |
| Foreign Born, Citizen | 2,222 (99.6%) | 10 (0.4%) |
| Foreign Born, not a Citizen | 545 (100.0%) | 0 (0.0%) |
Health Insurance Coverage by Household Income in Totowa borough
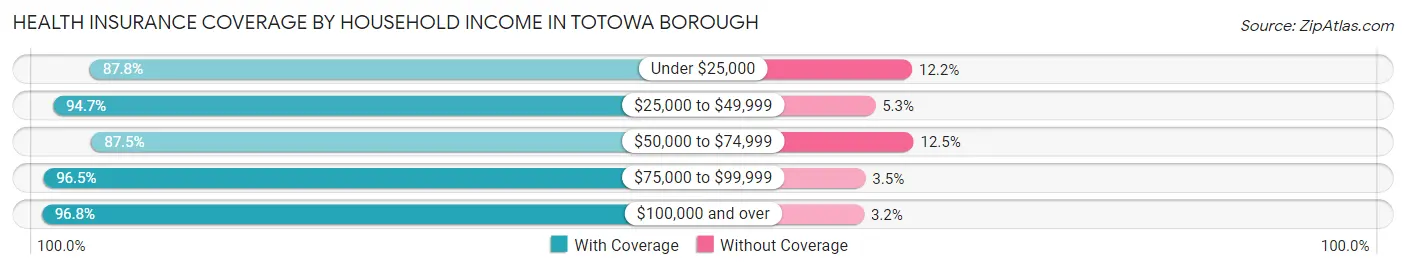
| Household Income | With Coverage | Without Coverage |
| Under $25,000 | 194 (87.8%) | 27 (12.2%) |
| $25,000 to $49,999 | 1,656 (94.7%) | 93 (5.3%) |
| $50,000 to $74,999 | 616 (87.5%) | 88 (12.5%) |
| $75,000 to $99,999 | 884 (96.5%) | 32 (3.5%) |
| $100,000 and over | 6,898 (96.8%) | 229 (3.2%) |
Public vs Private Health Insurance Coverage by Age in Totowa borough
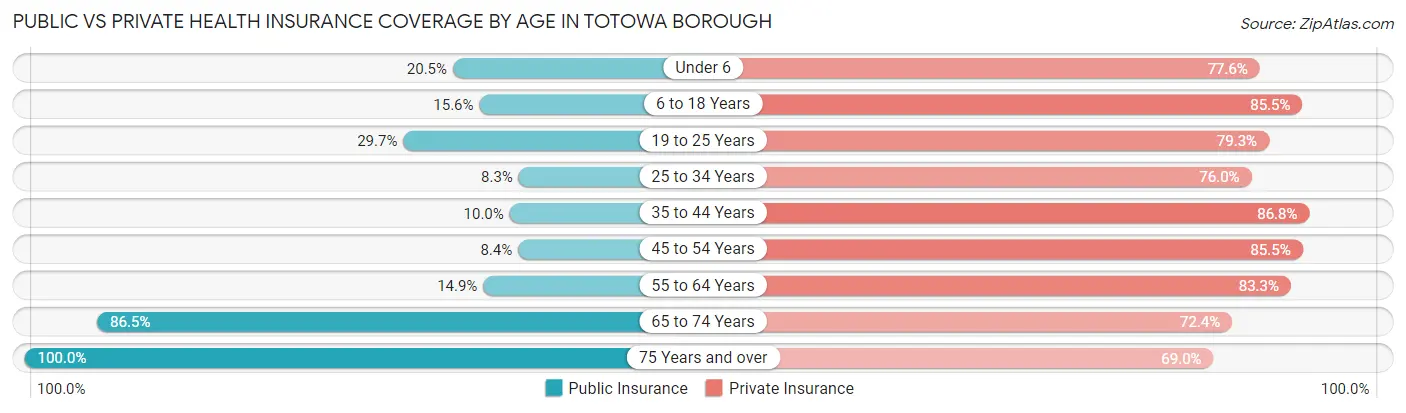
| Age Bracket | Public Insurance | Private Insurance |
| Under 6 | 96 (20.5%) | 363 (77.6%) |
| 6 to 18 Years | 348 (15.6%) | 1,908 (85.5%) |
| 19 to 25 Years | 162 (29.7%) | 432 (79.3%) |
| 25 to 34 Years | 75 (8.3%) | 688 (76.0%) |
| 35 to 44 Years | 162 (10.0%) | 1,410 (86.8%) |
| 45 to 54 Years | 120 (8.4%) | 1,221 (85.5%) |
| 55 to 64 Years | 241 (14.9%) | 1,350 (83.3%) |
| 65 to 74 Years | 1,086 (86.5%) | 909 (72.4%) |
| 75 Years and over | 780 (100.0%) | 538 (69.0%) |
| Total | 3,070 (28.3%) | 8,819 (81.2%) |
Disability Status by Sex by Age in Totowa borough
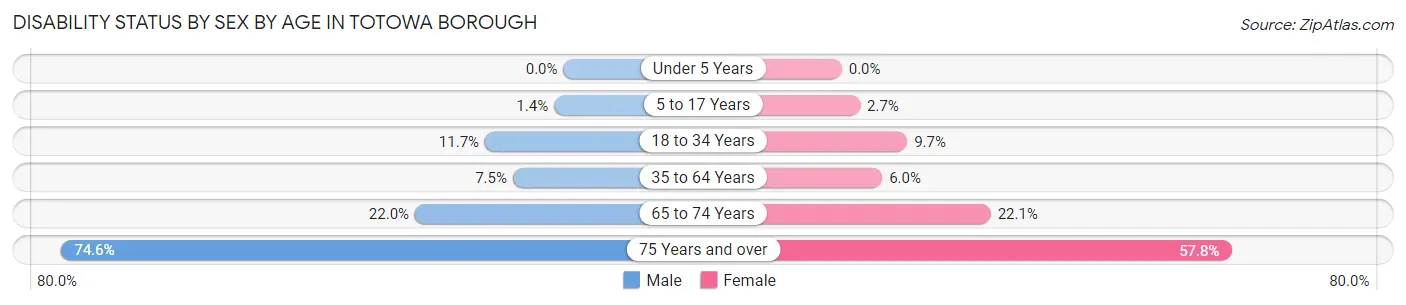
| Age Bracket | Male | Female |
| Under 5 Years | 0 (0.0%) | 0 (0.0%) |
| 5 to 17 Years | 17 (1.4%) | 24 (2.7%) |
| 18 to 34 Years | 96 (11.7%) | 79 (9.7%) |
| 35 to 64 Years | 158 (7.5%) | 154 (6.0%) |
| 65 to 74 Years | 147 (22.0%) | 130 (22.1%) |
| 75 Years and over | 205 (74.6%) | 292 (57.8%) |
Disability Class by Sex by Age in Totowa borough
Disability Class: Hearing Difficulty
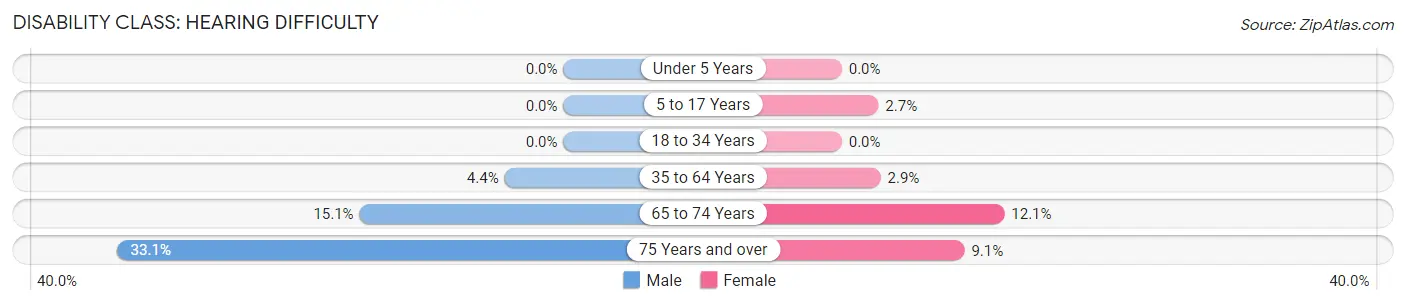
| Age Bracket | Male | Female |
| Under 5 Years | 0 (0.0%) | 0 (0.0%) |
| 5 to 17 Years | 0 (0.0%) | 24 (2.7%) |
| 18 to 34 Years | 0 (0.0%) | 0 (0.0%) |
| 35 to 64 Years | 92 (4.4%) | 74 (2.9%) |
| 65 to 74 Years | 101 (15.1%) | 71 (12.1%) |
| 75 Years and over | 91 (33.1%) | 46 (9.1%) |
Disability Class: Vision Difficulty
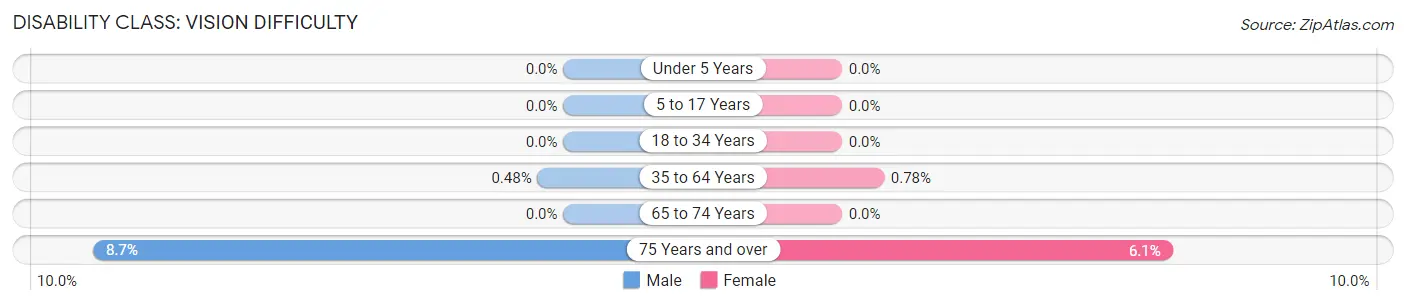
| Age Bracket | Male | Female |
| Under 5 Years | 0 (0.0%) | 0 (0.0%) |
| 5 to 17 Years | 0 (0.0%) | 0 (0.0%) |
| 18 to 34 Years | 0 (0.0%) | 0 (0.0%) |
| 35 to 64 Years | 10 (0.5%) | 20 (0.8%) |
| 65 to 74 Years | 0 (0.0%) | 0 (0.0%) |
| 75 Years and over | 24 (8.7%) | 31 (6.1%) |
Disability Class: Cognitive Difficulty
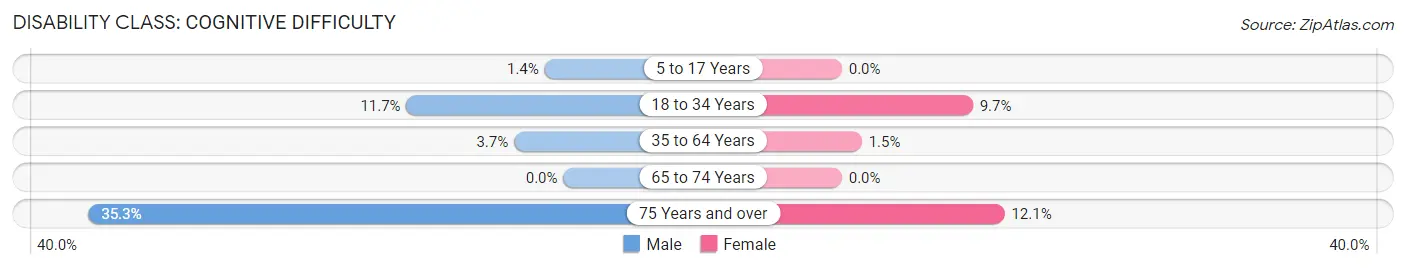
| Age Bracket | Male | Female |
| 5 to 17 Years | 17 (1.4%) | 0 (0.0%) |
| 18 to 34 Years | 96 (11.7%) | 79 (9.7%) |
| 35 to 64 Years | 77 (3.7%) | 38 (1.5%) |
| 65 to 74 Years | 0 (0.0%) | 0 (0.0%) |
| 75 Years and over | 97 (35.3%) | 61 (12.1%) |
Disability Class: Ambulatory Difficulty
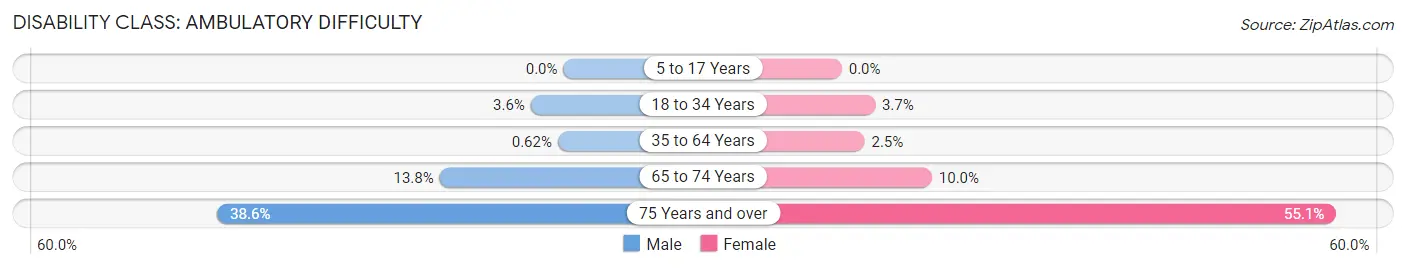
| Age Bracket | Male | Female |
| 5 to 17 Years | 0 (0.0%) | 0 (0.0%) |
| 18 to 34 Years | 30 (3.6%) | 30 (3.7%) |
| 35 to 64 Years | 13 (0.6%) | 65 (2.5%) |
| 65 to 74 Years | 92 (13.8%) | 59 (10.0%) |
| 75 Years and over | 106 (38.6%) | 278 (55.0%) |
Disability Class: Self-Care Difficulty
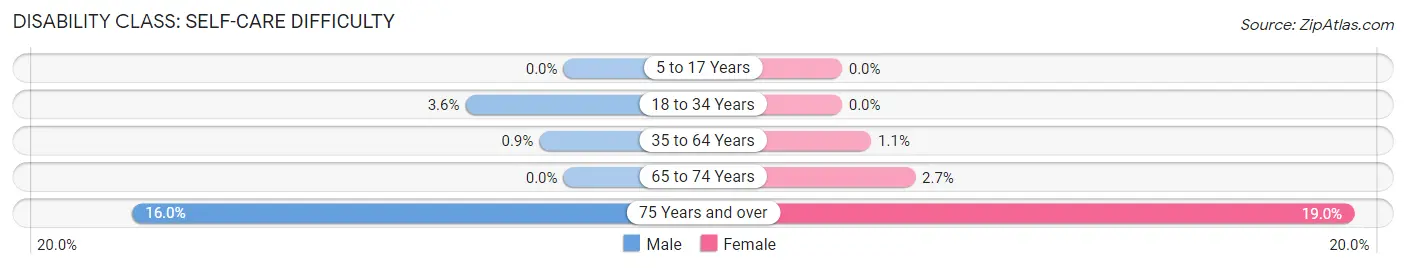
| Age Bracket | Male | Female |
| 5 to 17 Years | 0 (0.0%) | 0 (0.0%) |
| 18 to 34 Years | 30 (3.6%) | 0 (0.0%) |
| 35 to 64 Years | 19 (0.9%) | 28 (1.1%) |
| 65 to 74 Years | 0 (0.0%) | 16 (2.7%) |
| 75 Years and over | 44 (16.0%) | 96 (19.0%) |
Technology Access in Totowa borough
Computing Device Access in Totowa borough
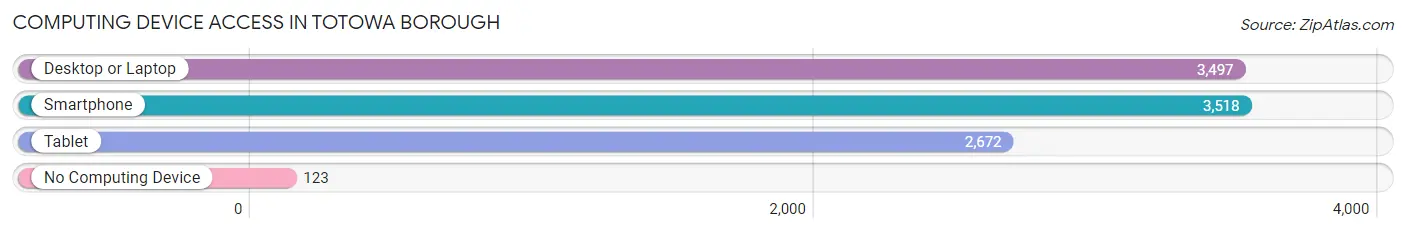
| Device Type | # Households | % Households |
| Desktop or Laptop | 3,497 | 92.5% |
| Smartphone | 3,518 | 93.0% |
| Tablet | 2,672 | 70.7% |
| No Computing Device | 123 | 3.3% |
| Total | 3,781 | 100.0% |
Internet Access in Totowa borough
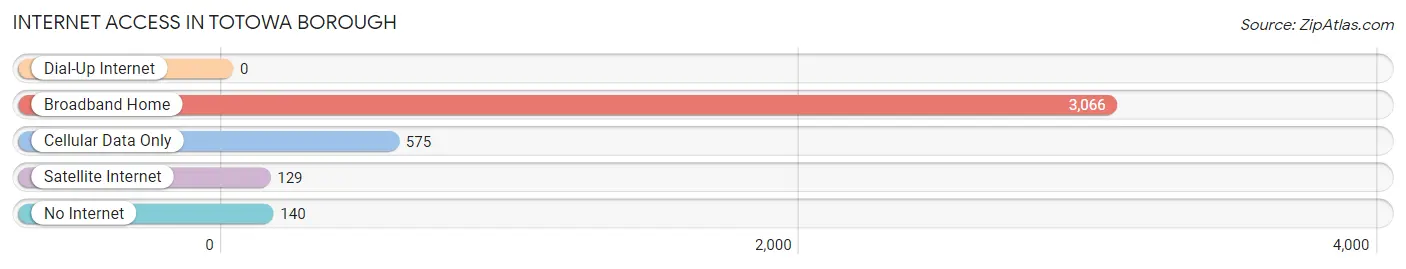
| Internet Type | # Households | % Households |
| Dial-Up Internet | 0 | 0.0% |
| Broadband Home | 3,066 | 81.1% |
| Cellular Data Only | 575 | 15.2% |
| Satellite Internet | 129 | 3.4% |
| No Internet | 140 | 3.7% |
| Total | 3,781 | 100.0% |
Totowa borough Summary
Totowa Borough is a small borough located in Passaic County, New Jersey. It is situated in the northern part of the state, just west of the city of Paterson. The borough is bordered by the towns of Wayne, Little Falls, Woodland Park, and Paterson. Totowa Borough has a population of 8,817 as of the 2010 census, making it the smallest municipality in Passaic County.
History
Totowa Borough was originally part of the Township of Manchester, which was created in 1720. In 1837, the Township of Manchester was divided into two parts, with the northern part becoming the Township of Totowa. The name Totowa is derived from the Lenape Native American word for “where the river bends”. The borough was officially incorporated in 1898.
Geography
Totowa Borough is located at 40°54'N 74°11'W (40.9, -74.18). It is situated in the northern part of the state, just west of the city of Paterson. The borough is bordered by the towns of Wayne, Little Falls, Woodland Park, and Paterson. Totowa Borough has a total area of 1.7 square miles, all of which is land.
Economy
Totowa Borough is home to a variety of businesses and industries. The borough is home to several manufacturing companies, including a plastics manufacturer, a paper products manufacturer, and a metal fabrication company. The borough is also home to a variety of retail stores, restaurants, and other businesses.
Demographics
As of the 2010 census, Totowa Borough had a population of 8,817. The racial makeup of the borough was 79.2% White, 8.2% African American, 0.3% Native American, 5.2% Asian, and 6.1% from other races. Hispanic or Latino of any race were 18.2% of the population.
The median household income in Totowa Borough was $63,917 in 2017. The per capita income for the borough was $30,945. About 6.2% of families and 8.3% of the population were below the poverty line, including 10.2% of those under age 18 and 8.2% of those age 65 or over.
Conclusion
Totowa Borough is a small borough located in Passaic County, New Jersey. It is situated in the northern part of the state, just west of the city of Paterson. The borough is bordered by the towns of Wayne, Little Falls, Woodland Park, and Paterson. Totowa Borough has a population of 8,817 as of the 2010 census, making it the smallest municipality in Passaic County. The borough is home to a variety of businesses and industries, and the median household income in Totowa Borough was $63,917 in 2017.
Common Questions
What is Per Capita Income in Totowa borough?
Per Capita income in Totowa borough is $50,260.
What is the Median Family Income in Totowa borough?
Median Family Income in Totowa borough is $117,989.
What is the Median Household income in Totowa borough?
Median Household Income in Totowa borough is $112,097.
What is Income or Wage Gap in Totowa borough?
Income or Wage Gap in Totowa borough is 7.8%.
Women in Totowa borough earn 92.2 cents for every dollar earned by a man.
What is Inequality or Gini Index in Totowa borough?
Inequality or Gini Index in Totowa borough is 0.41.
What is the Total Population of Totowa borough?
Total Population of Totowa borough is 10,975.
What is the Total Male Population of Totowa borough?
Total Male Population of Totowa borough is 5,362.
What is the Total Female Population of Totowa borough?
Total Female Population of Totowa borough is 5,613.
What is the Ratio of Males per 100 Females in Totowa borough?
There are 95.53 Males per 100 Females in Totowa borough.
What is the Ratio of Females per 100 Males in Totowa borough?
There are 104.68 Females per 100 Males in Totowa borough.
What is the Median Population Age in Totowa borough?
Median Population Age in Totowa borough is 43.9 Years.
What is the Average Family Size in Totowa borough
Average Family Size in Totowa borough is 3.2 People.
What is the Average Household Size in Totowa borough
Average Household Size in Totowa borough is 2.8 People.
How Large is the Labor Force in Totowa borough?
There are 5,848 People in the Labor Forcein in Totowa borough.
What is the Percentage of People in the Labor Force in Totowa borough?
67.0% of People are in the Labor Force in Totowa borough.
What is the Unemployment Rate in Totowa borough?
Unemployment Rate in Totowa borough is 5.4%.