Mantoloking borough, NJ Map & Demographics
Mantoloking borough Overview
$159,649
PER CAPITA INCOME
$250,001
AVG FAMILY INCOME
$240,417
AVG HOUSEHOLD INCOME
60.7%
WAGE / INCOME GAP [ % ]
39.3¢/ $1
WAGE / INCOME GAP [ $ ]
0.53
INEQUALITY / GINI INDEX
417
TOTAL POPULATION
195
MALE POPULATION
222
FEMALE POPULATION
87.84
MALES / 100 FEMALES
113.85
FEMALES / 100 MALES
56.7
MEDIAN AGE
2.8
AVG FAMILY SIZE
2.5
AVG HOUSEHOLD SIZE
204
LABOR FORCE [ PEOPLE ]
54.7%
PERCENT IN LABOR FORCE
3.4%
UNEMPLOYMENT RATE
Income in Mantoloking borough
Income Overview in Mantoloking borough
Per Capita Income in Mantoloking borough is $159,649, while median incomes of families and households are $250,001 and $240,417 respectively.
| Characteristic | Number | Measure |
| Per Capita Income | 417 | $159,649 |
| Median Family Income | 130 | $250,001 |
| Mean Family Income | 130 | $402,611 |
| Median Household Income | 168 | $240,417 |
| Mean Household Income | 168 | $377,855 |
| Income Deficit | 130 | $0 |
| Wage / Income Gap (%) | 417 | 60.67% |
| Wage / Income Gap ($) | 417 | 39.33¢ per $1 |
| Gini / Inequality Index | 417 | 0.53 |
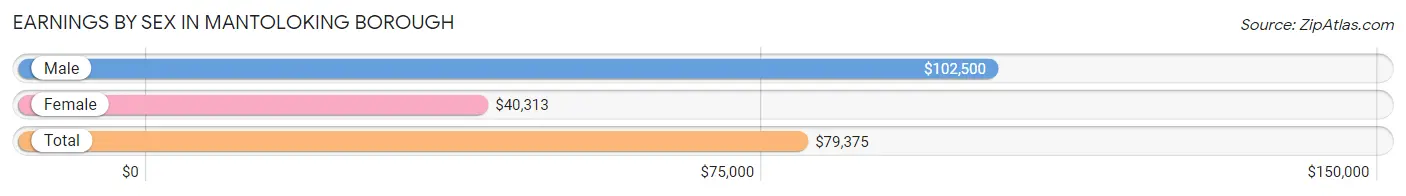
Earnings by Sex in Mantoloking borough
Average Earnings in Mantoloking borough are $79,375, $102,500 for men and $40,313 for women, a difference of 60.7%.
| Sex | Number | Average Earnings |
| Male | 128 (57.4%) | $102,500 |
| Female | 95 (42.6%) | $40,313 |
| Total | 223 (100.0%) | $79,375 |
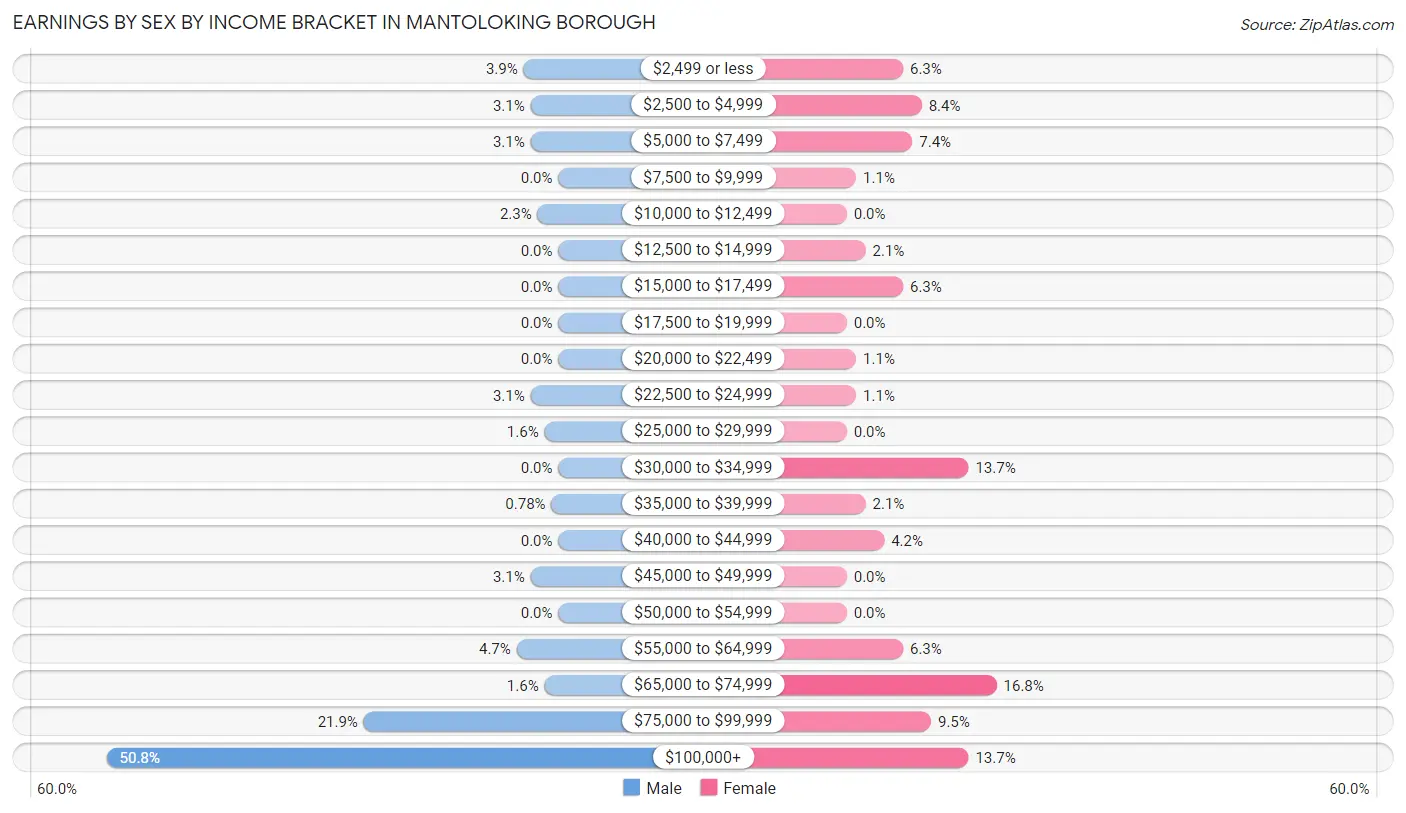
Earnings by Sex by Income Bracket in Mantoloking borough
The most common earnings brackets in Mantoloking borough are $100,000+ for men (65 | 50.8%) and $65,000 to $74,999 for women (16 | 16.8%).
| Income | Male | Female |
| $2,499 or less | 5 (3.9%) | 6 (6.3%) |
| $2,500 to $4,999 | 4 (3.1%) | 8 (8.4%) |
| $5,000 to $7,499 | 4 (3.1%) | 7 (7.4%) |
| $7,500 to $9,999 | 0 (0.0%) | 1 (1.1%) |
| $10,000 to $12,499 | 3 (2.3%) | 0 (0.0%) |
| $12,500 to $14,999 | 0 (0.0%) | 2 (2.1%) |
| $15,000 to $17,499 | 0 (0.0%) | 6 (6.3%) |
| $17,500 to $19,999 | 0 (0.0%) | 0 (0.0%) |
| $20,000 to $22,499 | 0 (0.0%) | 1 (1.1%) |
| $22,500 to $24,999 | 4 (3.1%) | 1 (1.1%) |
| $25,000 to $29,999 | 2 (1.6%) | 0 (0.0%) |
| $30,000 to $34,999 | 0 (0.0%) | 13 (13.7%) |
| $35,000 to $39,999 | 1 (0.8%) | 2 (2.1%) |
| $40,000 to $44,999 | 0 (0.0%) | 4 (4.2%) |
| $45,000 to $49,999 | 4 (3.1%) | 0 (0.0%) |
| $50,000 to $54,999 | 0 (0.0%) | 0 (0.0%) |
| $55,000 to $64,999 | 6 (4.7%) | 6 (6.3%) |
| $65,000 to $74,999 | 2 (1.6%) | 16 (16.8%) |
| $75,000 to $99,999 | 28 (21.9%) | 9 (9.5%) |
| $100,000+ | 65 (50.8%) | 13 (13.7%) |
| Total | 128 (100.0%) | 95 (100.0%) |
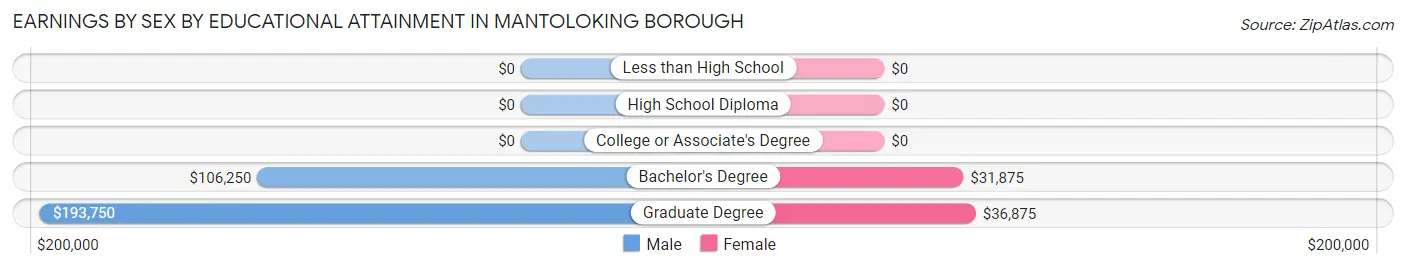
Earnings by Sex by Educational Attainment in Mantoloking borough
Average earnings in Mantoloking borough are $116,250 for men and $35,000 for women, a difference of 69.9%. Men with an educational attainment of graduate degree enjoy the highest average annual earnings of $193,750, while those with bachelor's degree education earn the least with $106,250. Women with an educational attainment of graduate degree earn the most with the average annual earnings of $36,875, while those with bachelor's degree education have the smallest earnings of $31,875.
| Educational Attainment | Male Income | Female Income |
| Less than High School | - | - |
| High School Diploma | - | - |
| College or Associate's Degree | - | - |
| Bachelor's Degree | $106,250 | $31,875 |
| Graduate Degree | $193,750 | $36,875 |
| Total | $116,250 | $35,000 |
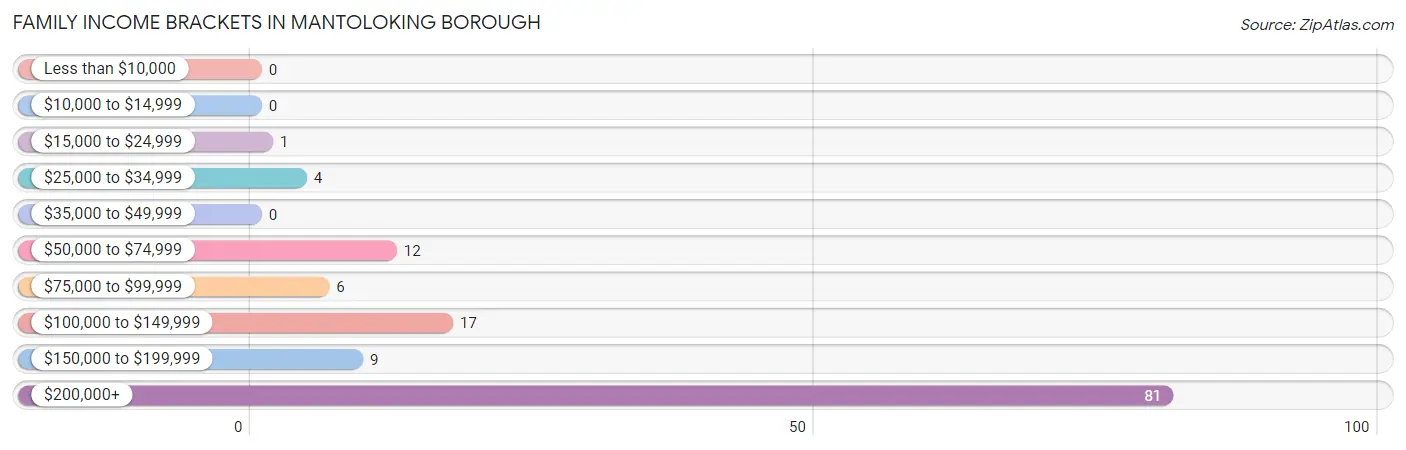
Family Income in Mantoloking borough
Family Income Brackets in Mantoloking borough
According to the Mantoloking borough family income data, there are 81 families falling into the $200,000+ income range, which is the most common income bracket and makes up 62.3% of all families.
| Income Bracket | # Families | % Families |
| Less than $10,000 | 0 | 0.0% |
| $10,000 to $14,999 | 0 | 0.0% |
| $15,000 to $24,999 | 1 | 0.8% |
| $25,000 to $34,999 | 4 | 3.1% |
| $35,000 to $49,999 | 0 | 0.0% |
| $50,000 to $74,999 | 12 | 9.2% |
| $75,000 to $99,999 | 6 | 4.6% |
| $100,000 to $149,999 | 17 | 13.1% |
| $150,000 to $199,999 | 9 | 6.9% |
| $200,000+ | 81 | 62.3% |
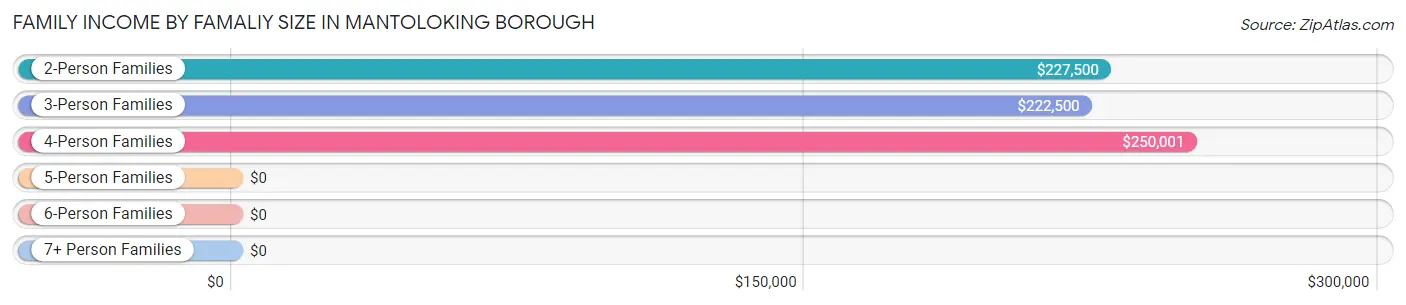
Family Income by Famaliy Size in Mantoloking borough
4-person families (24 | 18.5%) account for the highest median family income in Mantoloking borough with $250,001 per family, while 2-person families (78 | 60.0%) have the highest median income of $113,750 per family member.
| Income Bracket | # Families | Median Income |
| 2-Person Families | 78 (60.0%) | $227,500 |
| 3-Person Families | 18 (13.9%) | $222,500 |
| 4-Person Families | 24 (18.5%) | $250,001 |
| 5-Person Families | 3 (2.3%) | $0 |
| 6-Person Families | 7 (5.4%) | $0 |
| 7+ Person Families | 0 (0.0%) | $0 |
| Total | 130 (100.0%) | $250,001 |
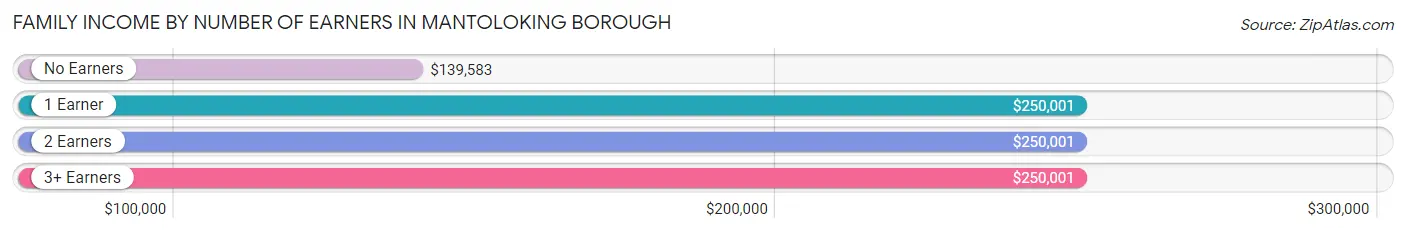
Family Income by Number of Earners in Mantoloking borough
The median family income in Mantoloking borough is $250,001, with families comprising 1 earner (45) having the highest median family income of $250,001, while families with no earners (29) have the lowest median family income of $139,583, accounting for 34.6% and 22.3% of families, respectively.
| Number of Earners | # Families | Median Income |
| No Earners | 29 (22.3%) | $139,583 |
| 1 Earner | 45 (34.6%) | $250,001 |
| 2 Earners | 34 (26.2%) | $250,001 |
| 3+ Earners | 22 (16.9%) | $250,001 |
| Total | 130 (100.0%) | $250,001 |
Household Income in Mantoloking borough
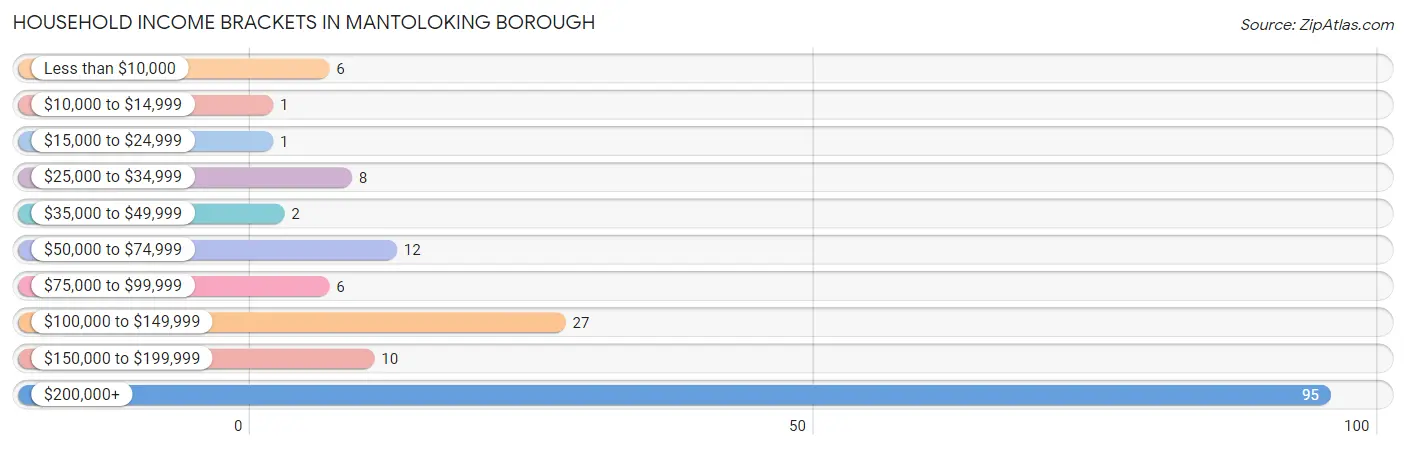
Household Income Brackets in Mantoloking borough
With 95 households falling in the category, the $200,000+ income range is the most frequent in Mantoloking borough, accounting for 56.6% of all households. In contrast, only 1 households (0.6%) fall into the $10,000 to $14,999 income bracket, making it the least populous group.
| Income Bracket | # Households | % Households |
| Less than $10,000 | 6 | 3.6% |
| $10,000 to $14,999 | 1 | 0.6% |
| $15,000 to $24,999 | 1 | 0.6% |
| $25,000 to $34,999 | 8 | 4.8% |
| $35,000 to $49,999 | 2 | 1.2% |
| $50,000 to $74,999 | 12 | 7.1% |
| $75,000 to $99,999 | 6 | 3.6% |
| $100,000 to $149,999 | 27 | 16.1% |
| $150,000 to $199,999 | 10 | 6.0% |
| $200,000+ | 95 | 56.5% |
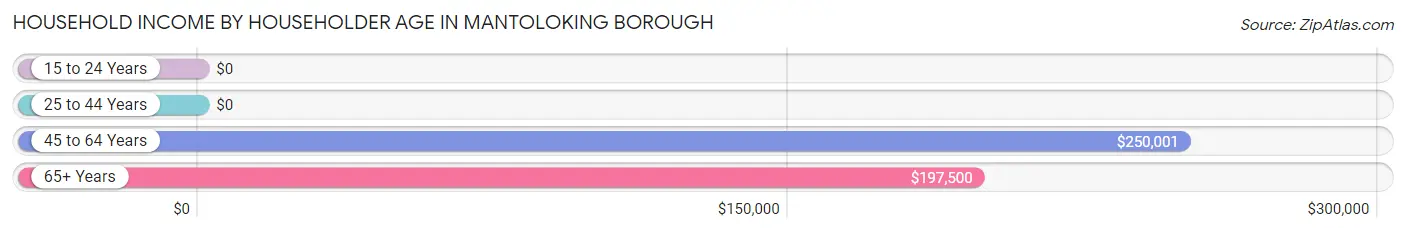
Household Income by Householder Age in Mantoloking borough
The median household income in Mantoloking borough is $240,417, with the highest median household income of $250,001 found in the 45 to 64 years age bracket for the primary householder. A total of 66 households (39.3%) fall into this category. Meanwhile, the 15 to 24 years age bracket for the primary householder has the lowest median household income of $0, with 4 households (2.4%) in this group.
| Income Bracket | # Households | Median Income |
| 15 to 24 Years | 4 (2.4%) | $0 |
| 25 to 44 Years | 14 (8.3%) | $0 |
| 45 to 64 Years | 66 (39.3%) | $250,001 |
| 65+ Years | 84 (50.0%) | $197,500 |
| Total | 168 (100.0%) | $240,417 |
Poverty in Mantoloking borough
Income Below Poverty by Sex and Age in Mantoloking borough
With 1.6% poverty level for males and 3.2% for females among the residents of Mantoloking borough, 25 to 34 year old males and 25 to 34 year old females are the most vulnerable to poverty, with 2 males (9.5%) and 2 females (12.5%) in their respective age groups living below the poverty level.
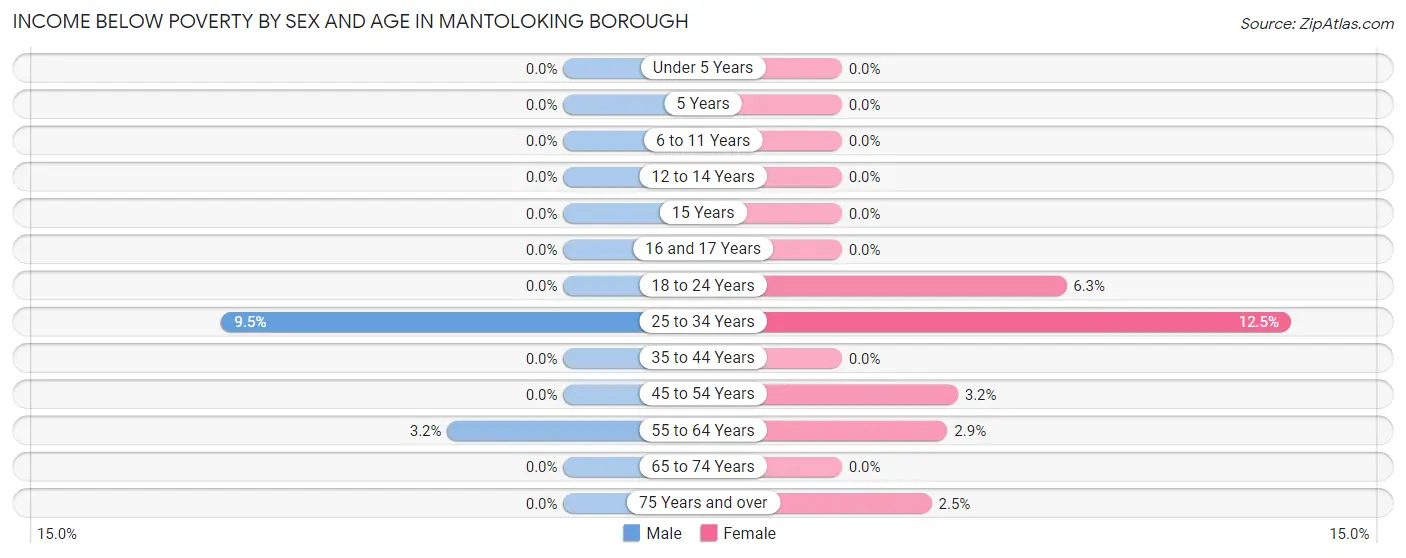
| Age Bracket | Male | Female |
| Under 5 Years | 0 (0.0%) | 0 (0.0%) |
| 5 Years | 0 (0.0%) | 0 (0.0%) |
| 6 to 11 Years | 0 (0.0%) | 0 (0.0%) |
| 12 to 14 Years | 0 (0.0%) | 0 (0.0%) |
| 15 Years | 0 (0.0%) | 0 (0.0%) |
| 16 and 17 Years | 0 (0.0%) | 0 (0.0%) |
| 18 to 24 Years | 0 (0.0%) | 2 (6.2%) |
| 25 to 34 Years | 2 (9.5%) | 2 (12.5%) |
| 35 to 44 Years | 0 (0.0%) | 0 (0.0%) |
| 45 to 54 Years | 0 (0.0%) | 1 (3.2%) |
| 55 to 64 Years | 1 (3.2%) | 1 (2.9%) |
| 65 to 74 Years | 0 (0.0%) | 0 (0.0%) |
| 75 Years and over | 0 (0.0%) | 1 (2.5%) |
| Total | 3 (1.6%) | 7 (3.2%) |
Income Above Poverty by Sex and Age in Mantoloking borough
According to the poverty statistics in Mantoloking borough, males aged under 5 years and females aged under 5 years are the age groups that are most secure financially, with 100.0% of males and 100.0% of females in these age groups living above the poverty line.
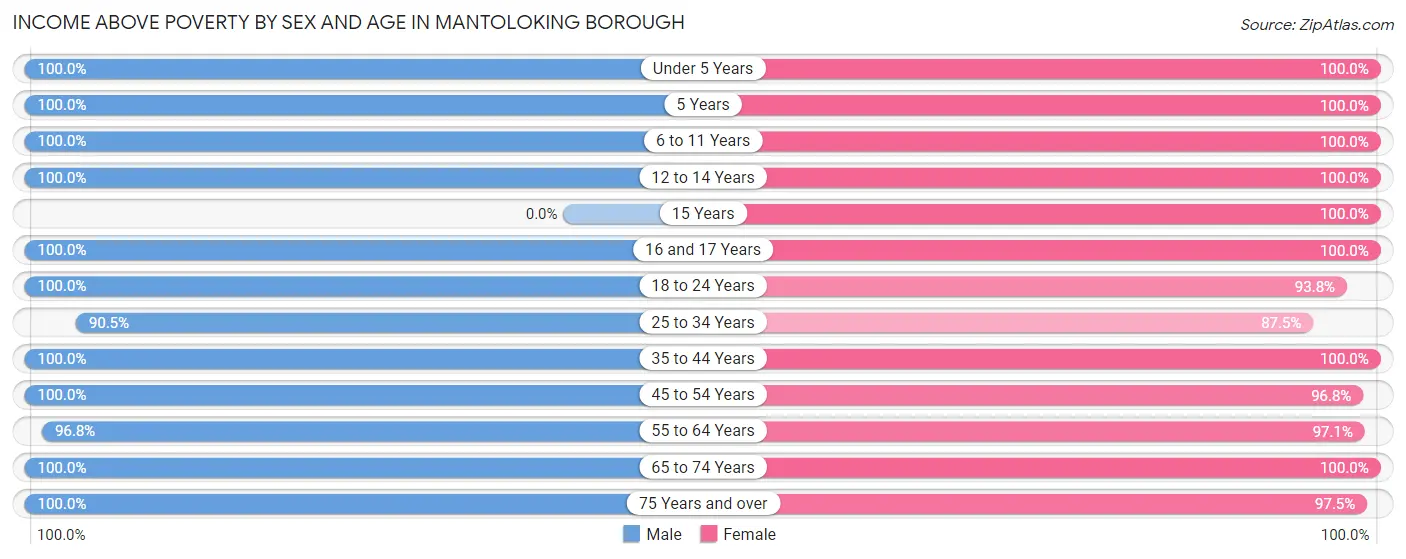
| Age Bracket | Male | Female |
| Under 5 Years | 8 (100.0%) | 4 (100.0%) |
| 5 Years | 2 (100.0%) | 2 (100.0%) |
| 6 to 11 Years | 7 (100.0%) | 2 (100.0%) |
| 12 to 14 Years | 2 (100.0%) | 10 (100.0%) |
| 15 Years | 0 (0.0%) | 4 (100.0%) |
| 16 and 17 Years | 9 (100.0%) | 4 (100.0%) |
| 18 to 24 Years | 2 (100.0%) | 30 (93.8%) |
| 25 to 34 Years | 19 (90.5%) | 14 (87.5%) |
| 35 to 44 Years | 6 (100.0%) | 3 (100.0%) |
| 45 to 54 Years | 28 (100.0%) | 30 (96.8%) |
| 55 to 64 Years | 30 (96.8%) | 33 (97.1%) |
| 65 to 74 Years | 36 (100.0%) | 37 (100.0%) |
| 75 Years and over | 40 (100.0%) | 39 (97.5%) |
| Total | 189 (98.4%) | 212 (96.8%) |
Income Below Poverty Among Married-Couple Families in Mantoloking borough
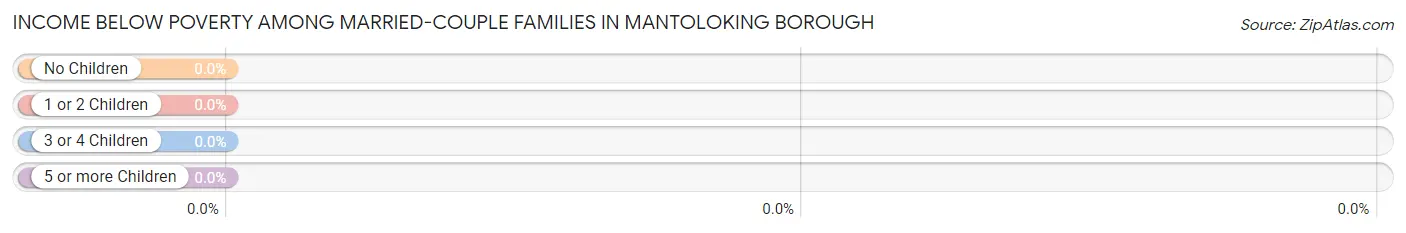
| Children | Above Poverty | Below Poverty |
| No Children | 93 (100.0%) | 0 (0.0%) |
| 1 or 2 Children | 22 (100.0%) | 0 (0.0%) |
| 3 or 4 Children | 2 (100.0%) | 0 (0.0%) |
| 5 or more Children | 0 (0.0%) | 0 (0.0%) |
| Total | 117 (100.0%) | 0 (0.0%) |
Income Below Poverty Among Single-Parent Households in Mantoloking borough
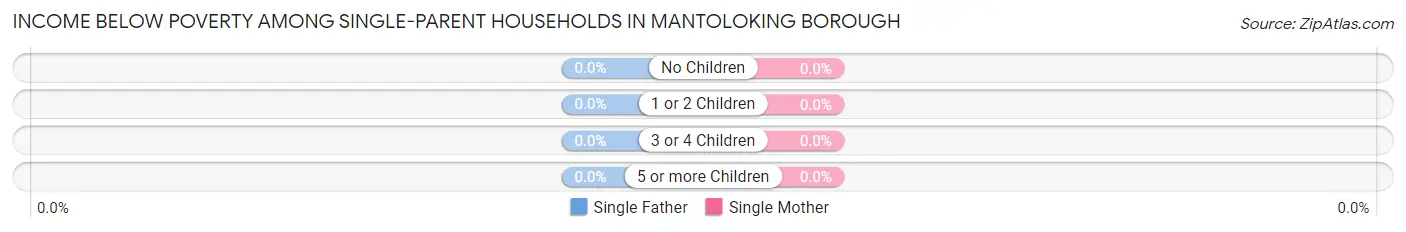
| Children | Single Father | Single Mother |
| No Children | 0 (0.0%) | 0 (0.0%) |
| 1 or 2 Children | 0 (0.0%) | 0 (0.0%) |
| 3 or 4 Children | 0 (0.0%) | 0 (0.0%) |
| 5 or more Children | 0 (0.0%) | 0 (0.0%) |
| Total | 0 (0.0%) | 0 (0.0%) |
Income Below Poverty Among Married-Couple vs Single-Parent Households in Mantoloking borough
| Children | Married-Couple Families | Single-Parent Households |
| No Children | 0 (0.0%) | 0 (0.0%) |
| 1 or 2 Children | 0 (0.0%) | 0 (0.0%) |
| 3 or 4 Children | 0 (0.0%) | 0 (0.0%) |
| 5 or more Children | 0 (0.0%) | 0 (0.0%) |
| Total | 0 (0.0%) | 0 (0.0%) |
Race in Mantoloking borough
The most populous races in Mantoloking borough are White / Caucasian (401 | 96.2%), Hispanic or Latino (21 | 5.0%), and Two or more Races (9 | 2.2%).
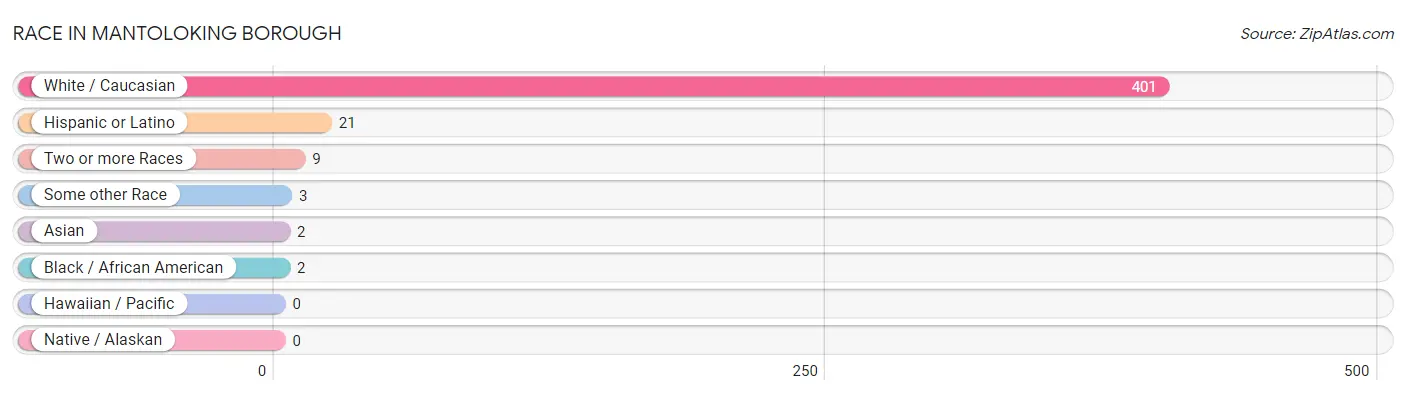
| Race | # Population | % Population |
| Asian | 2 | 0.5% |
| Black / African American | 2 | 0.5% |
| Hawaiian / Pacific | 0 | 0.0% |
| Hispanic or Latino | 21 | 5.0% |
| Native / Alaskan | 0 | 0.0% |
| White / Caucasian | 401 | 96.2% |
| Two or more Races | 9 | 2.2% |
| Some other Race | 3 | 0.7% |
| Total | 417 | 100.0% |
Ancestry in Mantoloking borough
The most populous ancestries reported in Mantoloking borough are Irish (123 | 29.5%), Italian (114 | 27.3%), English (69 | 16.6%), European (39 | 9.3%), and German (38 | 9.1%), together accounting for 91.8% of all Mantoloking borough residents.
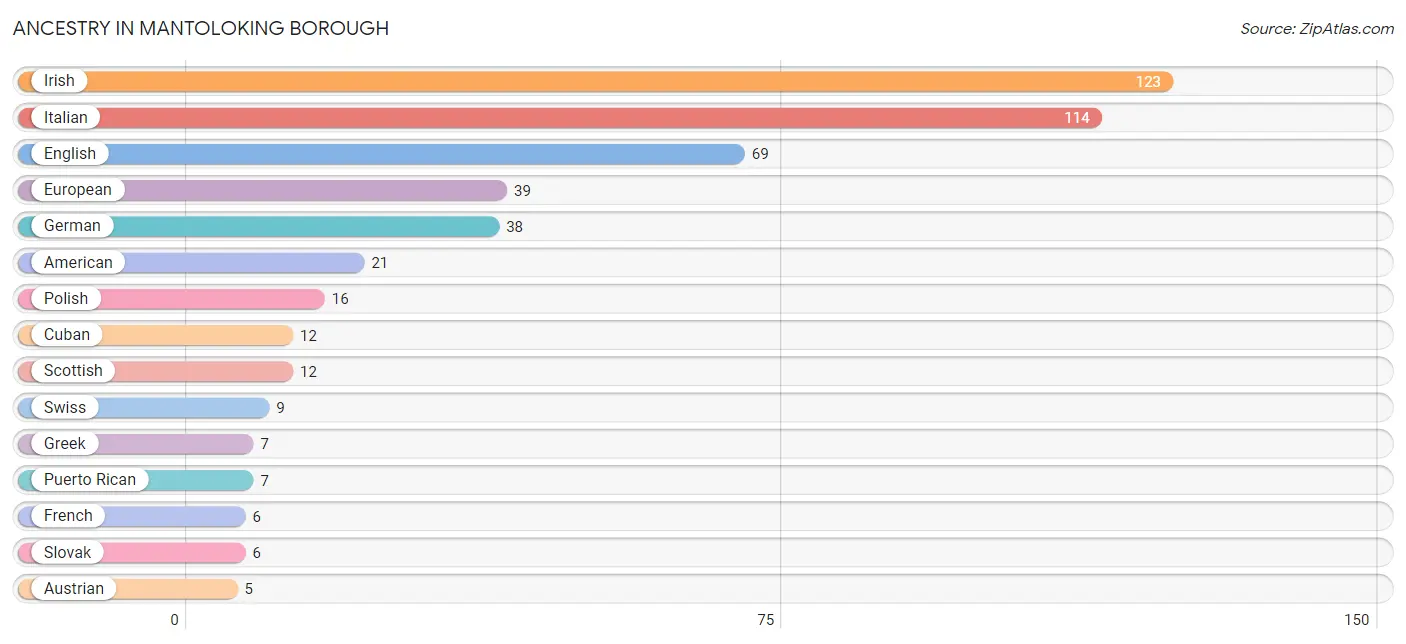
| Ancestry | # Population | % Population |
| Albanian | 4 | 1.0% |
| American | 21 | 5.0% |
| Austrian | 5 | 1.2% |
| Barbadian | 1 | 0.2% |
| Bhutanese | 2 | 0.5% |
| Cuban | 12 | 2.9% |
| Dutch | 3 | 0.7% |
| English | 69 | 16.6% |
| European | 39 | 9.3% |
| Finnish | 2 | 0.5% |
| French | 6 | 1.4% |
| French Canadian | 1 | 0.2% |
| German | 38 | 9.1% |
| Greek | 7 | 1.7% |
| Irish | 123 | 29.5% |
| Italian | 114 | 27.3% |
| Lithuanian | 2 | 0.5% |
| Norwegian | 3 | 0.7% |
| Polish | 16 | 3.8% |
| Portuguese | 1 | 0.2% |
| Puerto Rican | 7 | 1.7% |
| Romanian | 1 | 0.2% |
| Russian | 2 | 0.5% |
| Scandinavian | 1 | 0.2% |
| Scotch-Irish | 2 | 0.5% |
| Scottish | 12 | 2.9% |
| Slovak | 6 | 1.4% |
| Spaniard | 2 | 0.5% |
| Swiss | 9 | 2.2% |
| Ukrainian | 1 | 0.2% |
| Welsh | 1 | 0.2% | View All 31 Rows |
Immigrants in Mantoloking borough
The most numerous immigrant groups reported in Mantoloking borough came from Caribbean (4 | 1.0%), Cuba (4 | 1.0%), Latin America (4 | 1.0%), Asia (2 | 0.5%), and Eastern Asia (2 | 0.5%), together accounting for 3.8% of all Mantoloking borough residents.
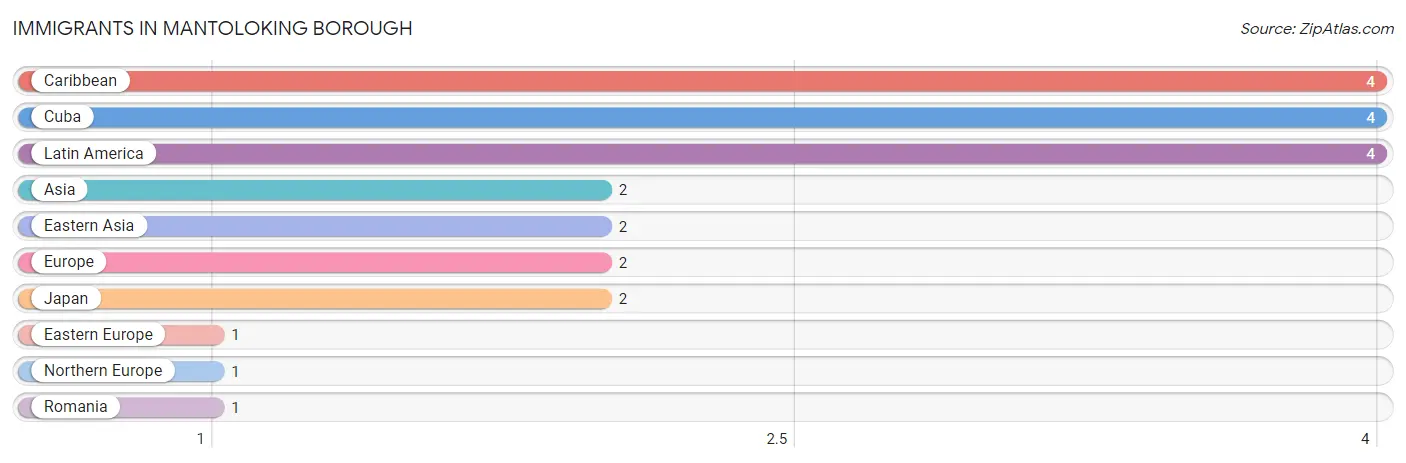
| Immigration Origin | # Population | % Population |
| Asia | 2 | 0.5% |
| Caribbean | 4 | 1.0% |
| Cuba | 4 | 1.0% |
| Eastern Asia | 2 | 0.5% |
| Eastern Europe | 1 | 0.2% |
| Europe | 2 | 0.5% |
| Japan | 2 | 0.5% |
| Latin America | 4 | 1.0% |
| Northern Europe | 1 | 0.2% |
| Romania | 1 | 0.2% | View All 10 Rows |
Sex and Age in Mantoloking borough
Sex and Age in Mantoloking borough
The most populous age groups in Mantoloking borough are 65 to 69 Years (21 | 10.8%) for men and 20 to 24 Years (22 | 9.9%) for women.
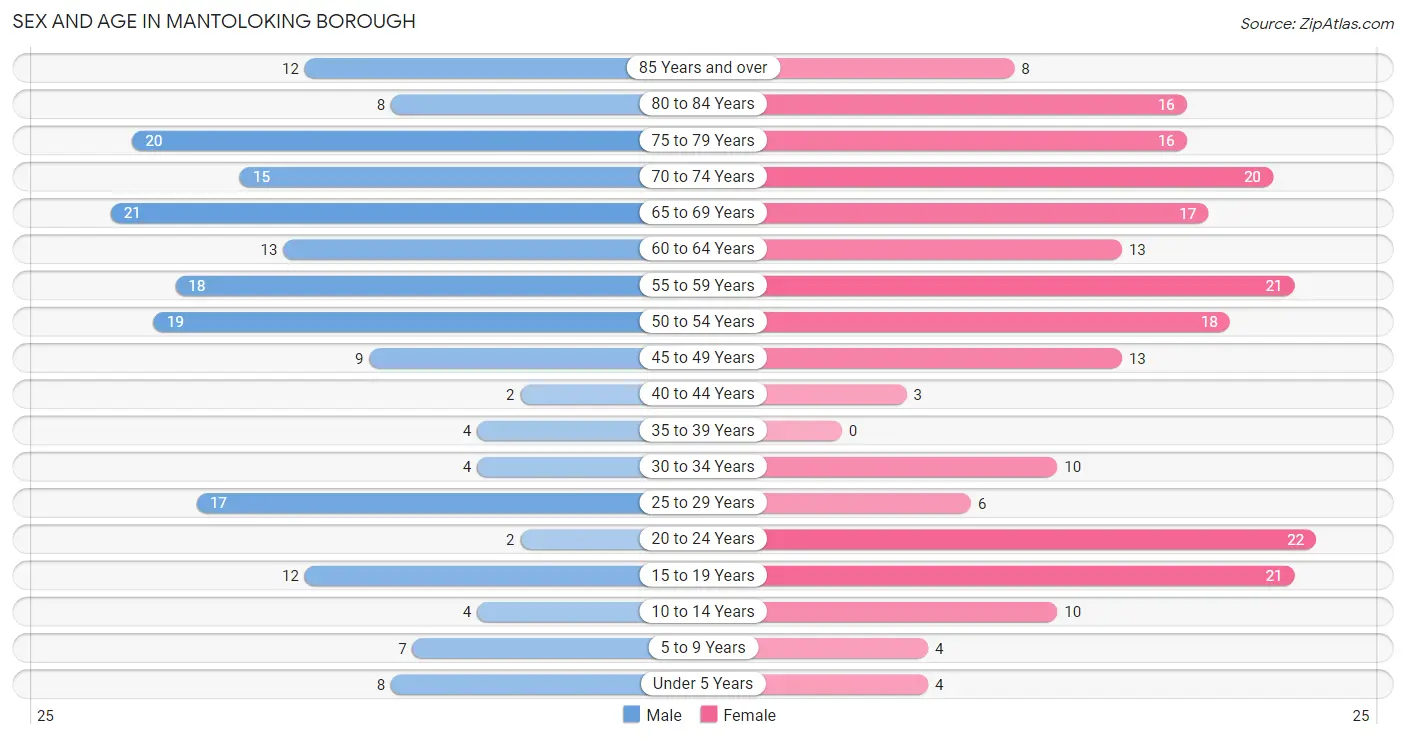
| Age Bracket | Male | Female |
| Under 5 Years | 8 (4.1%) | 4 (1.8%) |
| 5 to 9 Years | 7 (3.6%) | 4 (1.8%) |
| 10 to 14 Years | 4 (2.1%) | 10 (4.5%) |
| 15 to 19 Years | 12 (6.1%) | 21 (9.5%) |
| 20 to 24 Years | 2 (1.0%) | 22 (9.9%) |
| 25 to 29 Years | 17 (8.7%) | 6 (2.7%) |
| 30 to 34 Years | 4 (2.1%) | 10 (4.5%) |
| 35 to 39 Years | 4 (2.1%) | 0 (0.0%) |
| 40 to 44 Years | 2 (1.0%) | 3 (1.3%) |
| 45 to 49 Years | 9 (4.6%) | 13 (5.9%) |
| 50 to 54 Years | 19 (9.7%) | 18 (8.1%) |
| 55 to 59 Years | 18 (9.2%) | 21 (9.5%) |
| 60 to 64 Years | 13 (6.7%) | 13 (5.9%) |
| 65 to 69 Years | 21 (10.8%) | 17 (7.7%) |
| 70 to 74 Years | 15 (7.7%) | 20 (9.0%) |
| 75 to 79 Years | 20 (10.3%) | 16 (7.2%) |
| 80 to 84 Years | 8 (4.1%) | 16 (7.2%) |
| 85 Years and over | 12 (6.1%) | 8 (3.6%) |
| Total | 195 (100.0%) | 222 (100.0%) |
Families and Households in Mantoloking borough
Median Family Size in Mantoloking borough
The median family size in Mantoloking borough is 2.75 persons per family, with single female/mother families (5 | 3.8%) accounting for the largest median family size of 3.6 persons per family. On the other hand, single male/father families (8 | 6.1%) represent the smallest median family size with 1.88 persons per family.
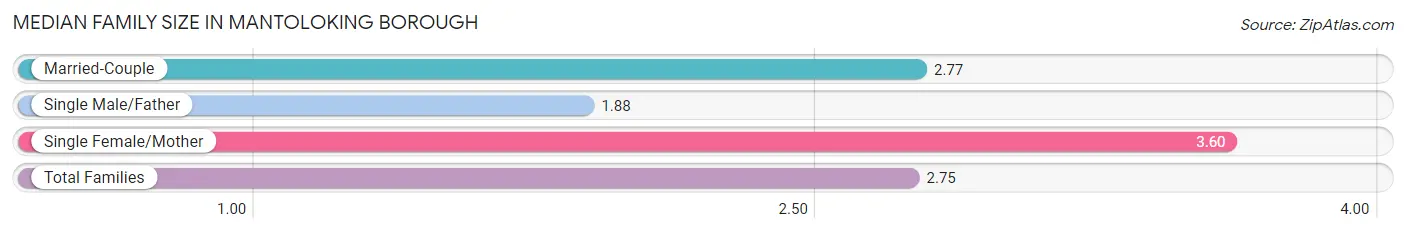
| Family Type | # Families | Family Size |
| Married-Couple | 117 (90.0%) | 2.77 |
| Single Male/Father | 8 (6.1%) | 1.88 |
| Single Female/Mother | 5 (3.8%) | 3.60 |
| Total Families | 130 (100.0%) | 2.75 |
Median Household Size in Mantoloking borough
The median household size in Mantoloking borough is 2.45 persons per household, with single female/mother households (5 | 3.0%) accounting for the largest median household size of 3.6 persons per household. non-family households (38 | 22.6%) represent the smallest median household size with 1.18 persons per household.
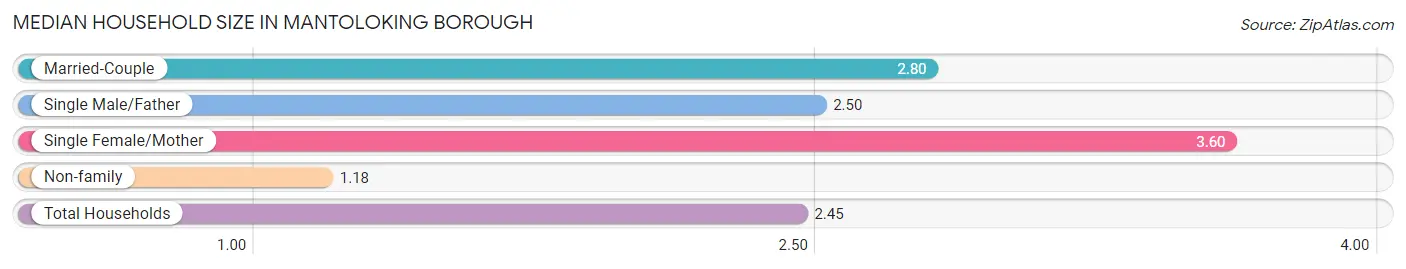
| Household Type | # Households | Household Size |
| Married-Couple | 117 (69.6%) | 2.80 |
| Single Male/Father | 8 (4.8%) | 2.50 |
| Single Female/Mother | 5 (3.0%) | 3.60 |
| Non-family | 38 (22.6%) | 1.18 |
| Total Households | 168 (100.0%) | 2.45 |
Household Size by Marriage Status in Mantoloking borough
Out of a total of 168 households in Mantoloking borough, 130 (77.4%) are family households, while 38 (22.6%) are nonfamily households. The most numerous type of family households are 2-person households, comprising 70, and the most common type of nonfamily households are 1-person households, comprising 32.
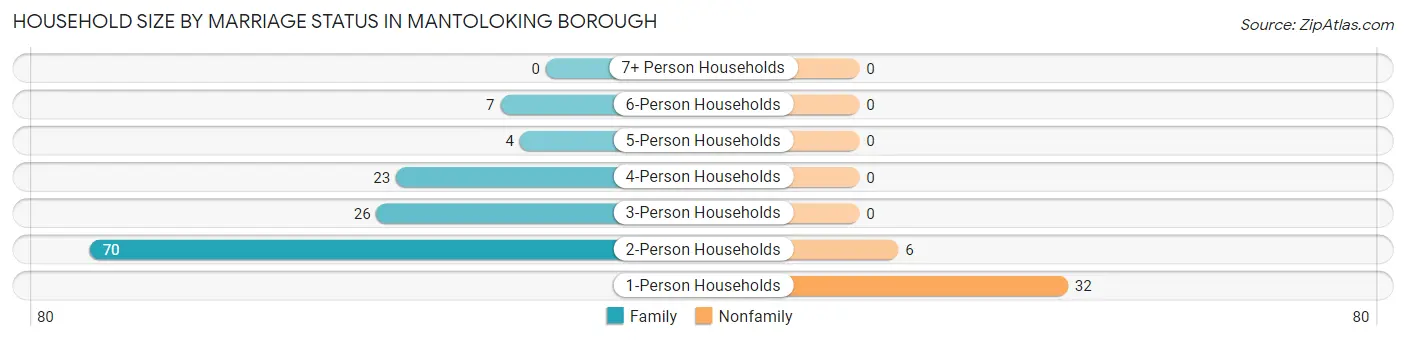
| Household Size | Family Households | Nonfamily Households |
| 1-Person Households | - | 32 (19.1%) |
| 2-Person Households | 70 (41.7%) | 6 (3.6%) |
| 3-Person Households | 26 (15.5%) | 0 (0.0%) |
| 4-Person Households | 23 (13.7%) | 0 (0.0%) |
| 5-Person Households | 4 (2.4%) | 0 (0.0%) |
| 6-Person Households | 7 (4.2%) | 0 (0.0%) |
| 7+ Person Households | 0 (0.0%) | 0 (0.0%) |
| Total | 130 (77.4%) | 38 (22.6%) |
Female Fertility in Mantoloking borough
Fertility by Age in Mantoloking borough
| Age Bracket | Women with Births | Births / 1,000 Women |
| 15 to 19 years | 0 (0.0%) | 0.0 |
| 20 to 34 years | 0 (0.0%) | 0.0 |
| 35 to 50 years | 0 (0.0%) | 0.0 |
| Total | 0 (0.0%) | 0.0 |
Fertility by Age by Marriage Status in Mantoloking borough
| Age Bracket | Married | Unmarried |
| 15 to 19 years | 0 (0.0%) | 0 (0.0%) |
| 20 to 34 years | 0 (0.0%) | 0 (0.0%) |
| 35 to 50 years | 0 (0.0%) | 0 (0.0%) |
| Total | 0 (0.0%) | 0 (0.0%) |
Fertility by Education in Mantoloking borough
| Educational Attainment | Women with Births | Births / 1,000 Women |
| Less than High School | 0 (0.0%) | 0.0 |
| High School Diploma | 0 (0.0%) | 0.0 |
| College or Associate's Degree | 0 (0.0%) | 0.0 |
| Bachelor's Degree | 0 (0.0%) | 0.0 |
| Graduate Degree | 0 (0.0%) | 0.0 |
| Total | 0 (0.0%) | 0.0 |
Fertility by Education by Marriage Status in Mantoloking borough
| Educational Attainment | Married | Unmarried |
| Less than High School | 0 (0.0%) | 0 (0.0%) |
| High School Diploma | 0 (0.0%) | 0 (0.0%) |
| College or Associate's Degree | 0 (0.0%) | 0 (0.0%) |
| Bachelor's Degree | 0 (0.0%) | 0 (0.0%) |
| Graduate Degree | 0 (0.0%) | 0 (0.0%) |
| Total | 0 (0.0%) | 0 (0.0%) |
Employment Characteristics in Mantoloking borough
Employment by Class of Employer in Mantoloking borough
Among the 195 employed individuals in Mantoloking borough, private company employees (118 | 60.5%), self-employed (incorporated) (26 | 13.3%), and self-employed (not incorporated) (24 | 12.3%) make up the most common classes of employment.
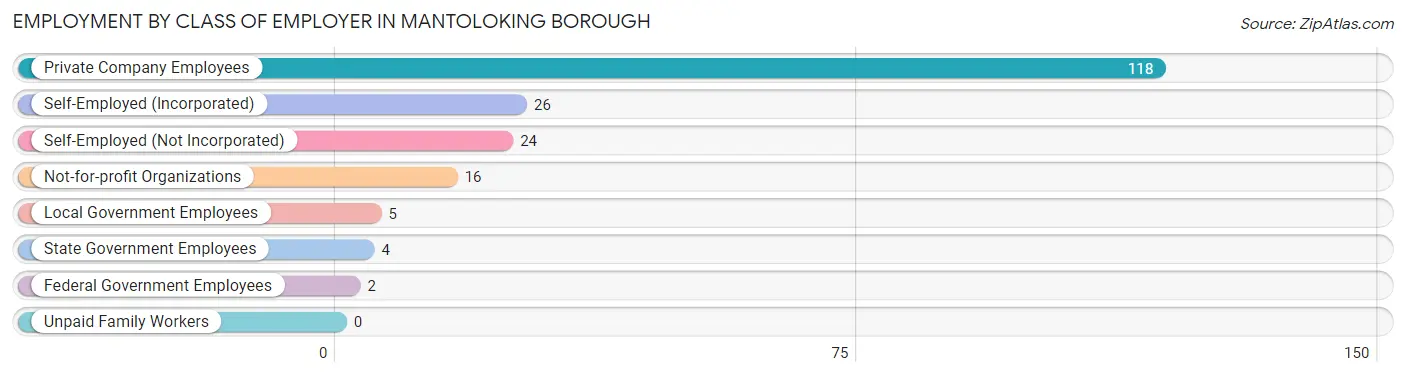
| Employer Class | # Employees | % Employees |
| Private Company Employees | 118 | 60.5% |
| Self-Employed (Incorporated) | 26 | 13.3% |
| Self-Employed (Not Incorporated) | 24 | 12.3% |
| Not-for-profit Organizations | 16 | 8.2% |
| Local Government Employees | 5 | 2.6% |
| State Government Employees | 4 | 2.1% |
| Federal Government Employees | 2 | 1.0% |
| Unpaid Family Workers | 0 | 0.0% |
| Total | 195 | 100.0% |
Employment Status by Age in Mantoloking borough
According to the labor force statistics for Mantoloking borough, out of the total population over 16 years of age (373), 54.7% or 204 individuals are in the labor force, with 3.4% or 7 of them unemployed. The age group with the highest labor force participation rate is 55 to 59 years, with 92.3% or 36 individuals in the labor force. Within the labor force, the 30 to 34 years age range has the highest percentage of unemployed individuals, with 20.0% or 2 of them being unemployed.
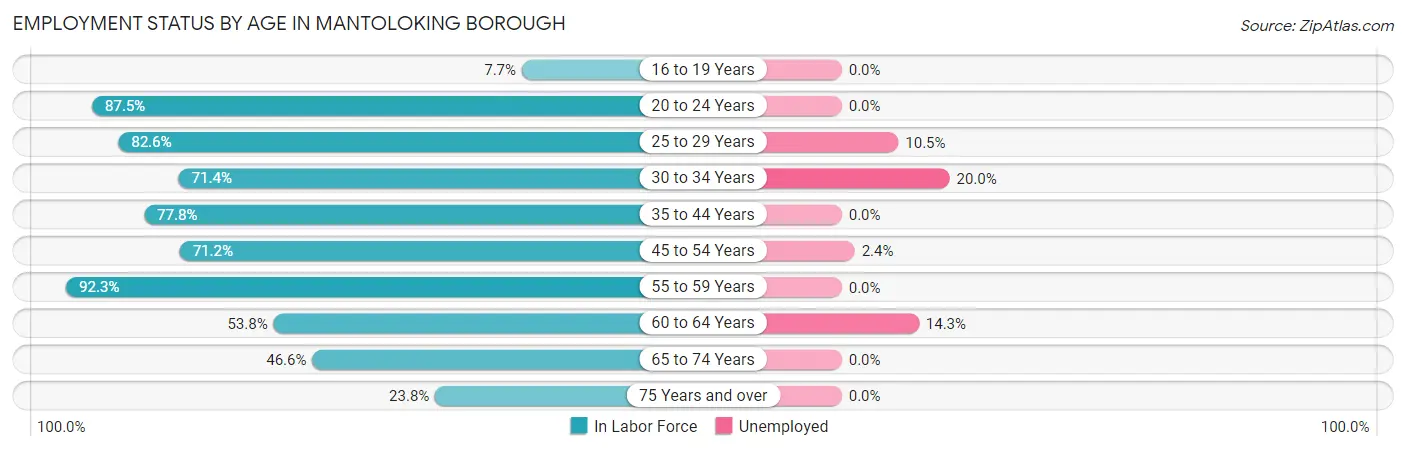
| Age Bracket | In Labor Force | Unemployed |
| 16 to 19 Years | 2 (7.7%) | 0 (0.0%) |
| 20 to 24 Years | 21 (87.5%) | 0 (0.0%) |
| 25 to 29 Years | 19 (82.6%) | 2 (10.5%) |
| 30 to 34 Years | 10 (71.4%) | 2 (20.0%) |
| 35 to 44 Years | 7 (77.8%) | 0 (0.0%) |
| 45 to 54 Years | 42 (71.2%) | 1 (2.4%) |
| 55 to 59 Years | 36 (92.3%) | 0 (0.0%) |
| 60 to 64 Years | 14 (53.8%) | 2 (14.3%) |
| 65 to 74 Years | 34 (46.6%) | 0 (0.0%) |
| 75 Years and over | 19 (23.8%) | 0 (0.0%) |
| Total | 204 (54.7%) | 7 (3.4%) |
Employment Status by Educational Attainment in Mantoloking borough
According to labor force statistics for Mantoloking borough, 75.3% of individuals (128) out of the total population between 25 and 64 years of age (170) are in the labor force, with 5.5% or 7 of them being unemployed. The group with the highest labor force participation rate are those with the educational attainment of bachelor's degree or higher, with 75.7% or 115 individuals in the labor force. Within the labor force, individuals with high school diploma education have the highest percentage of unemployment, with 33.3% or 2 of them being unemployed.
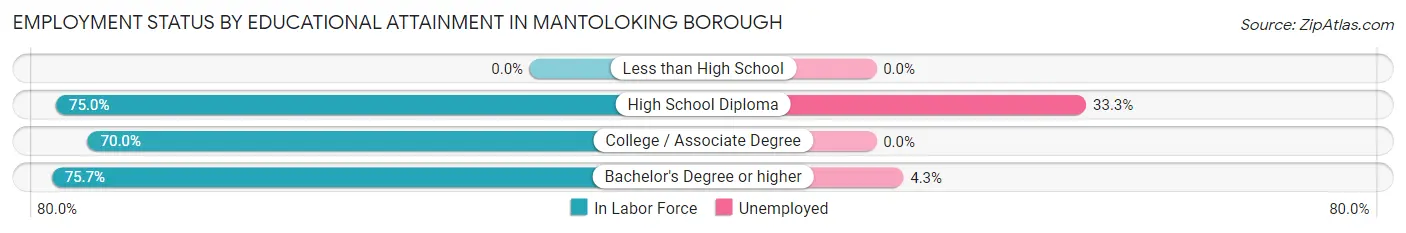
| Educational Attainment | In Labor Force | Unemployed |
| Less than High School | 0 (0.0%) | 0 (0.0%) |
| High School Diploma | 6 (75.0%) | 3 (33.3%) |
| College / Associate Degree | 7 (70.0%) | 0 (0.0%) |
| Bachelor's Degree or higher | 115 (75.7%) | 7 (4.3%) |
| Total | 128 (75.3%) | 9 (5.5%) |
Employment Occupations by Sex in Mantoloking borough
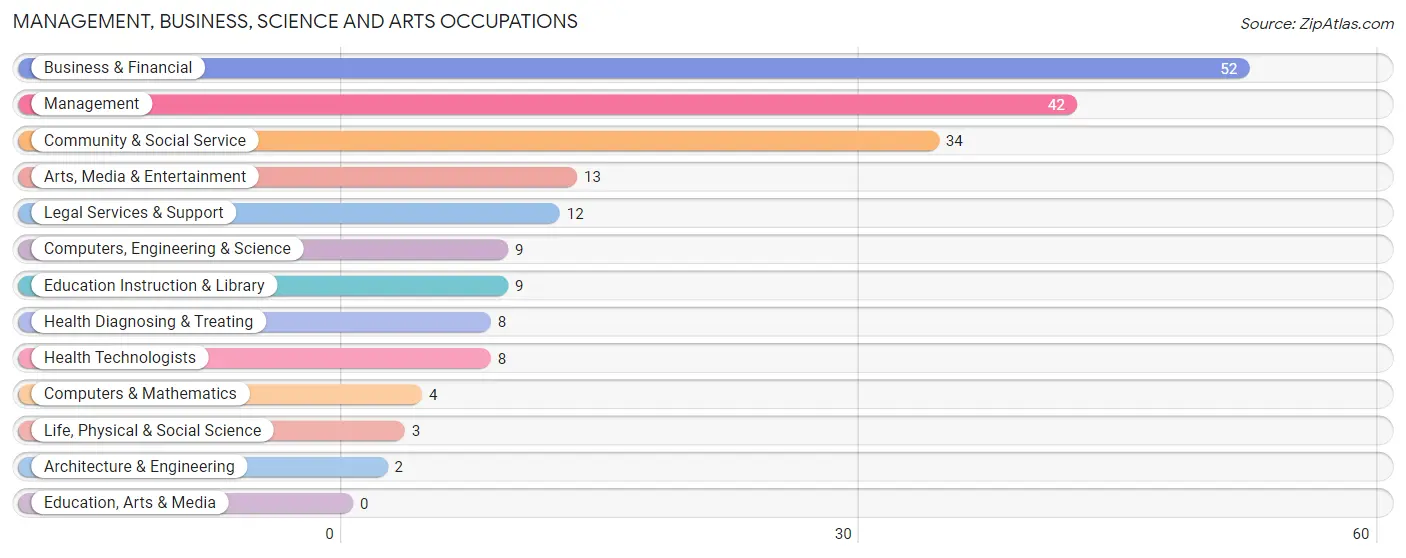
Management, Business, Science and Arts Occupations
The most common Management, Business, Science and Arts occupations in Mantoloking borough are Business & Financial (52 | 26.4%), Management (42 | 21.3%), Community & Social Service (34 | 17.3%), Arts, Media & Entertainment (13 | 6.6%), and Legal Services & Support (12 | 6.1%).
Management, Business, Science and Arts Occupations by Sex
Within the Management, Business, Science and Arts occupations in Mantoloking borough, the most male-oriented occupations are Computers & Mathematics (100.0%), Legal Services & Support (100.0%), and Health Diagnosing & Treating (100.0%), while the most female-oriented occupations are Architecture & Engineering (100.0%), Arts, Media & Entertainment (76.9%), and Life, Physical & Social Science (66.7%).
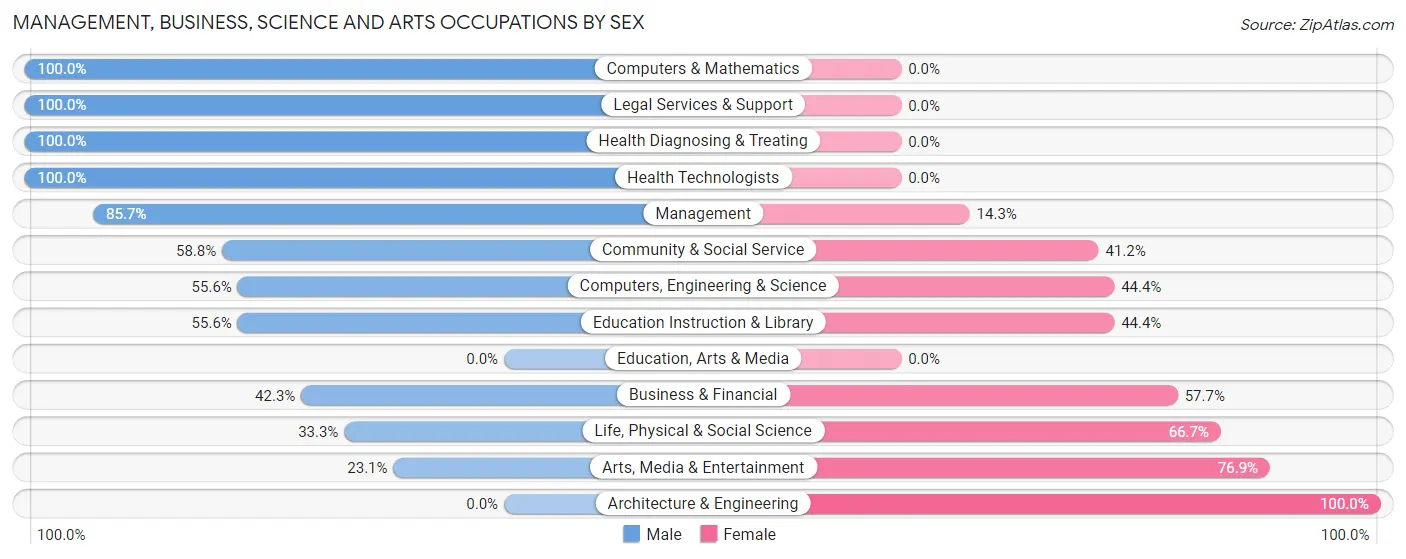
| Occupation | Male | Female |
| Management | 36 (85.7%) | 6 (14.3%) |
| Business & Financial | 22 (42.3%) | 30 (57.7%) |
| Computers, Engineering & Science | 5 (55.6%) | 4 (44.4%) |
| Computers & Mathematics | 4 (100.0%) | 0 (0.0%) |
| Architecture & Engineering | 0 (0.0%) | 2 (100.0%) |
| Life, Physical & Social Science | 1 (33.3%) | 2 (66.7%) |
| Community & Social Service | 20 (58.8%) | 14 (41.2%) |
| Education, Arts & Media | 0 (0.0%) | 0 (0.0%) |
| Legal Services & Support | 12 (100.0%) | 0 (0.0%) |
| Education Instruction & Library | 5 (55.6%) | 4 (44.4%) |
| Arts, Media & Entertainment | 3 (23.1%) | 10 (76.9%) |
| Health Diagnosing & Treating | 8 (100.0%) | 0 (0.0%) |
| Health Technologists | 8 (100.0%) | 0 (0.0%) |
| Total (Category) | 91 (62.8%) | 54 (37.2%) |
| Total (Overall) | 122 (61.9%) | 75 (38.1%) |
Services Occupations
The most common Services occupations in Mantoloking borough are Personal Care & Service (4 | 2.0%), Security & Protection (2 | 1.0%), and Law Enforcement (2 | 1.0%).
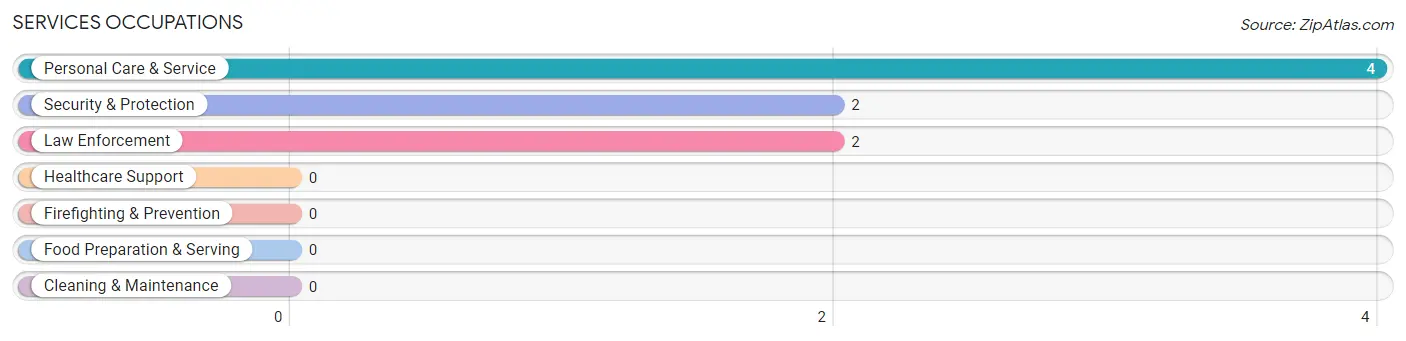
Services Occupations by Sex
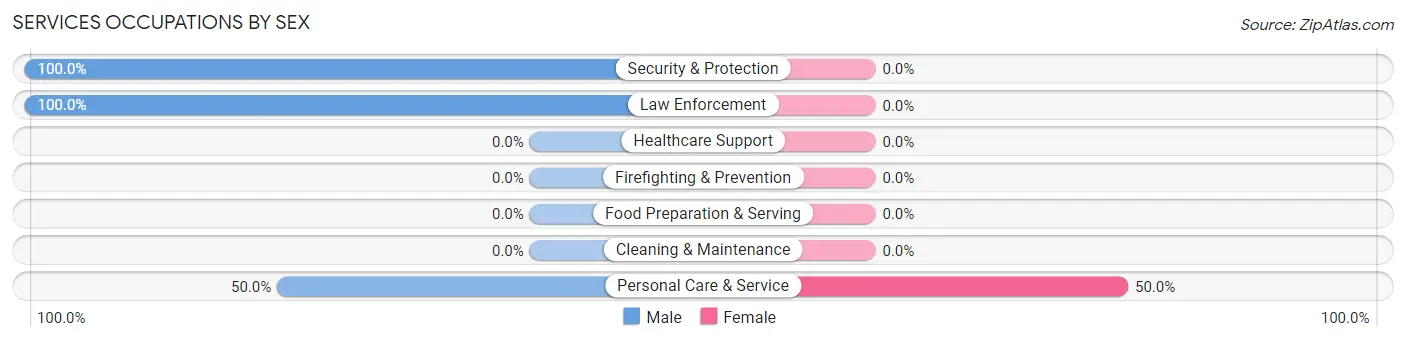
| Occupation | Male | Female |
| Healthcare Support | 0 (0.0%) | 0 (0.0%) |
| Security & Protection | 2 (100.0%) | 0 (0.0%) |
| Firefighting & Prevention | 0 (0.0%) | 0 (0.0%) |
| Law Enforcement | 2 (100.0%) | 0 (0.0%) |
| Food Preparation & Serving | 0 (0.0%) | 0 (0.0%) |
| Cleaning & Maintenance | 0 (0.0%) | 0 (0.0%) |
| Personal Care & Service | 2 (50.0%) | 2 (50.0%) |
| Total (Category) | 4 (66.7%) | 2 (33.3%) |
| Total (Overall) | 122 (61.9%) | 75 (38.1%) |
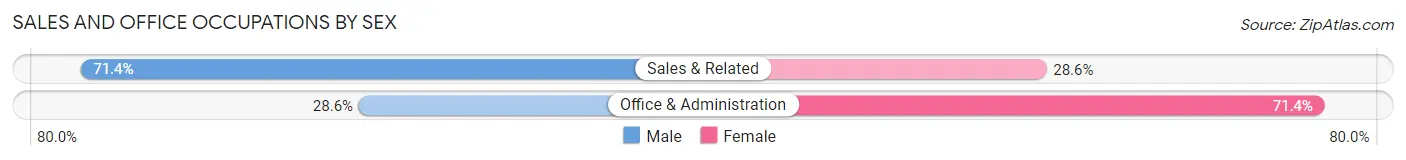
Sales and Office Occupations
The most common Sales and Office occupations in Mantoloking borough are Sales & Related (35 | 17.8%), and Office & Administration (7 | 3.5%).
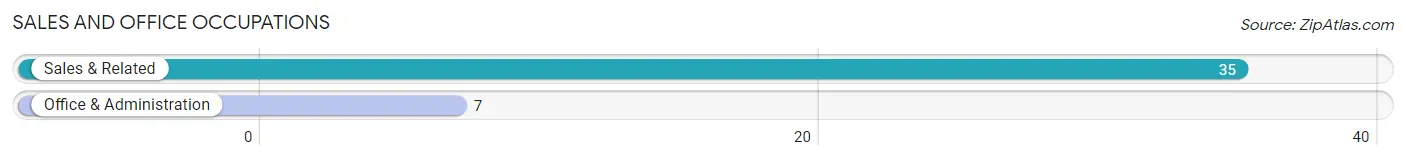
Sales and Office Occupations by Sex
| Occupation | Male | Female |
| Sales & Related | 25 (71.4%) | 10 (28.6%) |
| Office & Administration | 2 (28.6%) | 5 (71.4%) |
| Total (Category) | 27 (64.3%) | 15 (35.7%) |
| Total (Overall) | 122 (61.9%) | 75 (38.1%) |
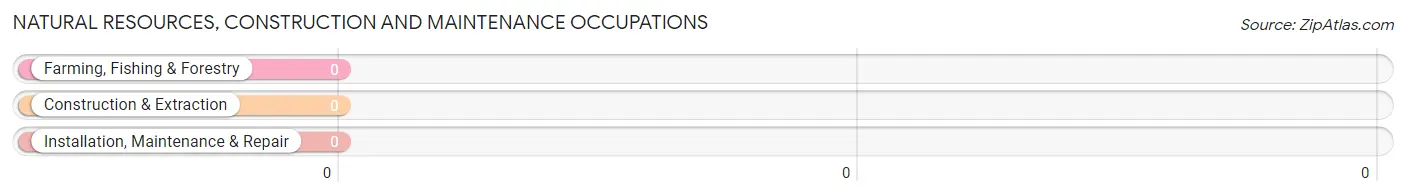
Natural Resources, Construction and Maintenance Occupations
Natural Resources, Construction and Maintenance Occupations by Sex
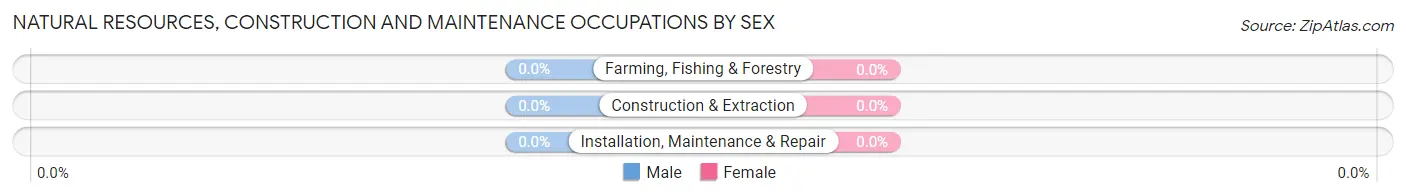
| Occupation | Male | Female |
| Farming, Fishing & Forestry | 0 (0.0%) | 0 (0.0%) |
| Construction & Extraction | 0 (0.0%) | 0 (0.0%) |
| Installation, Maintenance & Repair | 0 (0.0%) | 0 (0.0%) |
| Total (Category) | 0 (0.0%) | 0 (0.0%) |
| Total (Overall) | 122 (61.9%) | 75 (38.1%) |
Production, Transportation and Moving Occupations
The most common Production, Transportation and Moving occupations in Mantoloking borough are , and Production (4 | 2.0%).
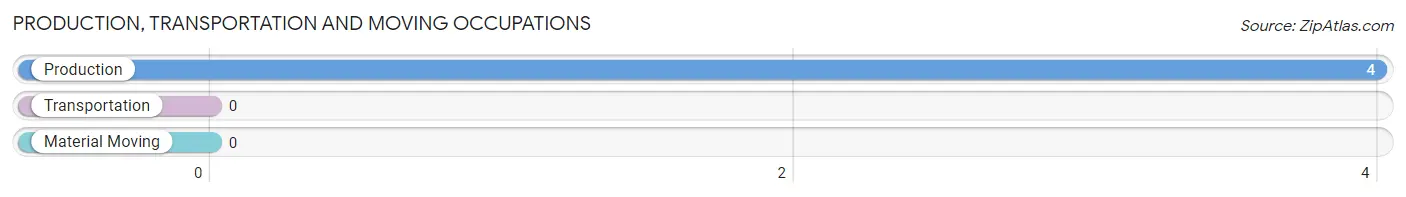
Production, Transportation and Moving Occupations by Sex
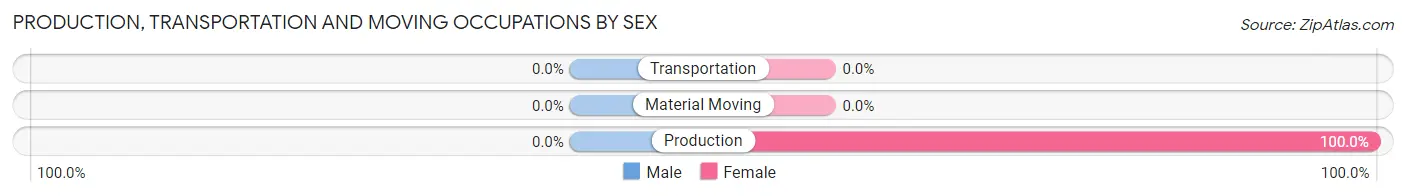
| Occupation | Male | Female |
| Production | 0 (0.0%) | 4 (100.0%) |
| Transportation | 0 (0.0%) | 0 (0.0%) |
| Material Moving | 0 (0.0%) | 0 (0.0%) |
| Total (Category) | 0 (0.0%) | 4 (100.0%) |
| Total (Overall) | 122 (61.9%) | 75 (38.1%) |
Employment Industries by Sex in Mantoloking borough
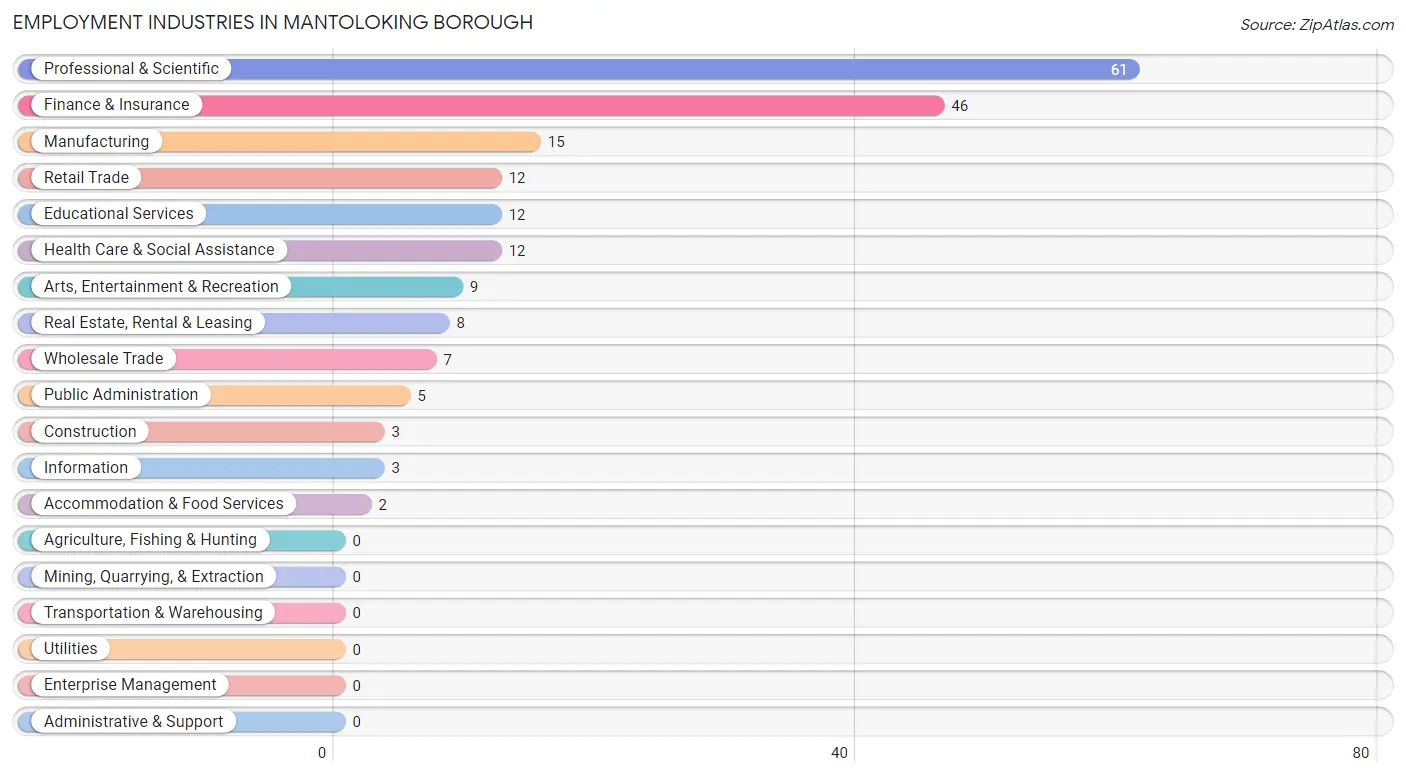
Employment Industries in Mantoloking borough
The major employment industries in Mantoloking borough include Professional & Scientific (61 | 31.0%), Finance & Insurance (46 | 23.4%), Manufacturing (15 | 7.6%), Retail Trade (12 | 6.1%), and Educational Services (12 | 6.1%).
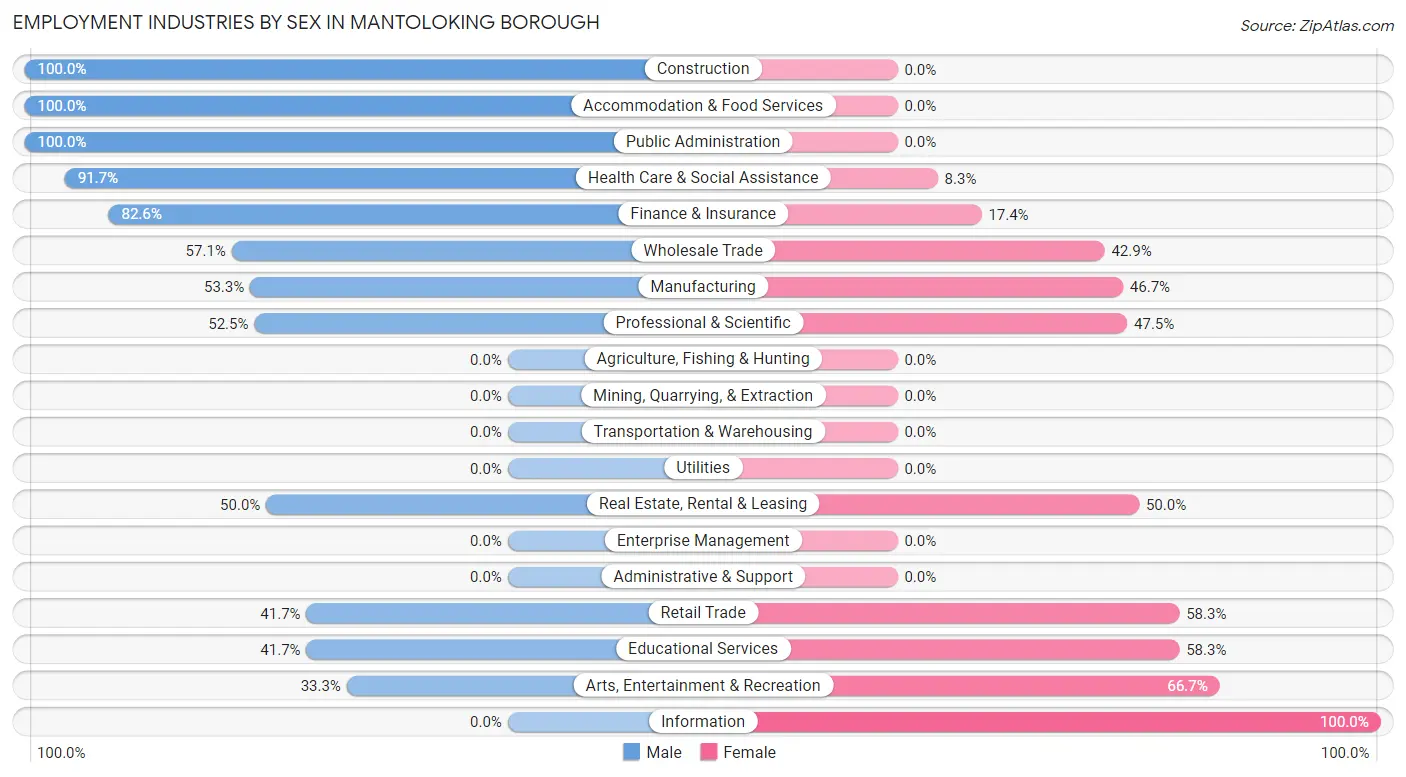
Employment Industries by Sex in Mantoloking borough
The Mantoloking borough industries that see more men than women are Construction (100.0%), Accommodation & Food Services (100.0%), and Public Administration (100.0%), whereas the industries that tend to have a higher number of women are Information (100.0%), Arts, Entertainment & Recreation (66.7%), and Retail Trade (58.3%).
| Industry | Male | Female |
| Agriculture, Fishing & Hunting | 0 (0.0%) | 0 (0.0%) |
| Mining, Quarrying, & Extraction | 0 (0.0%) | 0 (0.0%) |
| Construction | 3 (100.0%) | 0 (0.0%) |
| Manufacturing | 8 (53.3%) | 7 (46.7%) |
| Wholesale Trade | 4 (57.1%) | 3 (42.9%) |
| Retail Trade | 5 (41.7%) | 7 (58.3%) |
| Transportation & Warehousing | 0 (0.0%) | 0 (0.0%) |
| Utilities | 0 (0.0%) | 0 (0.0%) |
| Information | 0 (0.0%) | 3 (100.0%) |
| Finance & Insurance | 38 (82.6%) | 8 (17.4%) |
| Real Estate, Rental & Leasing | 4 (50.0%) | 4 (50.0%) |
| Professional & Scientific | 32 (52.5%) | 29 (47.5%) |
| Enterprise Management | 0 (0.0%) | 0 (0.0%) |
| Administrative & Support | 0 (0.0%) | 0 (0.0%) |
| Educational Services | 5 (41.7%) | 7 (58.3%) |
| Health Care & Social Assistance | 11 (91.7%) | 1 (8.3%) |
| Arts, Entertainment & Recreation | 3 (33.3%) | 6 (66.7%) |
| Accommodation & Food Services | 2 (100.0%) | 0 (0.0%) |
| Public Administration | 5 (100.0%) | 0 (0.0%) |
| Total | 122 (61.9%) | 75 (38.1%) |
Education in Mantoloking borough
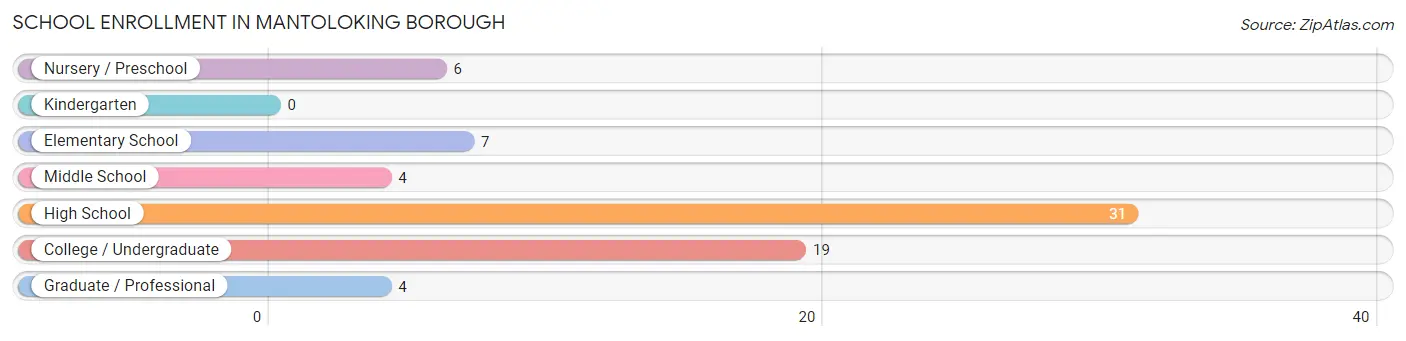
School Enrollment in Mantoloking borough
The most common levels of schooling among the 71 students in Mantoloking borough are high school (31 | 43.7%), college / undergraduate (19 | 26.8%), and elementary school (7 | 9.9%).
| School Level | # Students | % Students |
| Nursery / Preschool | 6 | 8.5% |
| Kindergarten | 0 | 0.0% |
| Elementary School | 7 | 9.9% |
| Middle School | 4 | 5.6% |
| High School | 31 | 43.7% |
| College / Undergraduate | 19 | 26.8% |
| Graduate / Professional | 4 | 5.6% |
| Total | 71 | 100.0% |
School Enrollment by Age by Funding Source in Mantoloking borough
Out of a total of 71 students who are enrolled in schools in Mantoloking borough, 44 (62.0%) attend a private institution, while the remaining 27 (38.0%) are enrolled in public schools. The age group of 18 to 19 year olds has the highest likelihood of being enrolled in private schools, with 11 (100.0% in the age bracket) enrolled. Conversely, the age group of 3 to 4 year olds has the lowest likelihood of being enrolled in a private school, with 2 (100.0% in the age bracket) attending a public institution.
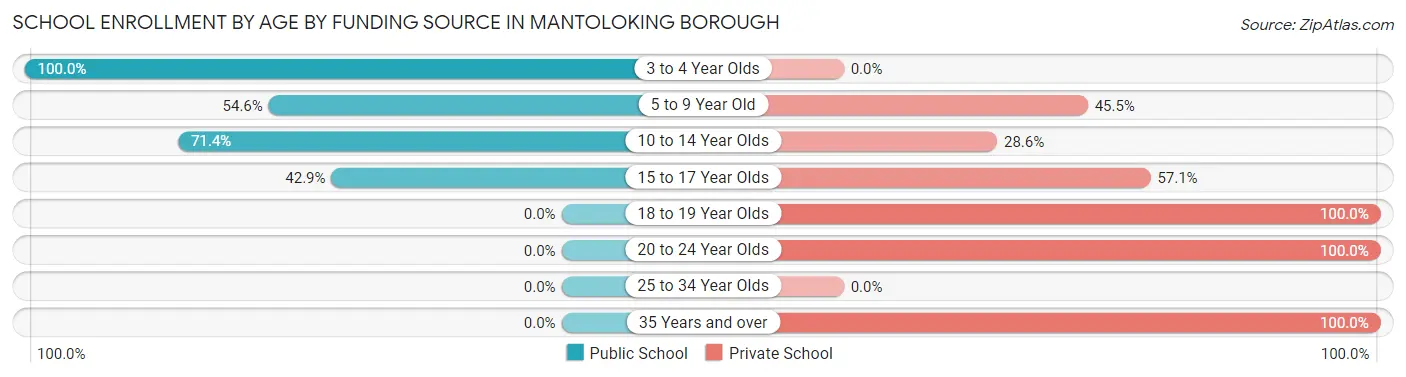
| Age Bracket | Public School | Private School |
| 3 to 4 Year Olds | 2 (100.0%) | 0 (0.0%) |
| 5 to 9 Year Old | 6 (54.5%) | 5 (45.5%) |
| 10 to 14 Year Olds | 10 (71.4%) | 4 (28.6%) |
| 15 to 17 Year Olds | 9 (42.9%) | 12 (57.1%) |
| 18 to 19 Year Olds | 0 (0.0%) | 11 (100.0%) |
| 20 to 24 Year Olds | 0 (0.0%) | 8 (100.0%) |
| 25 to 34 Year Olds | 0 (0.0%) | 0 (0.0%) |
| 35 Years and over | 0 (0.0%) | 4 (100.0%) |
| Total | 27 (38.0%) | 44 (62.0%) |
Educational Attainment by Field of Study in Mantoloking borough
Business (62 | 20.4%), social sciences (42 | 13.8%), liberal arts & history (37 | 12.2%), education (33 | 10.9%), and engineering (23 | 7.6%) are the most common fields of study among 304 individuals in Mantoloking borough who have obtained a bachelor's degree or higher.
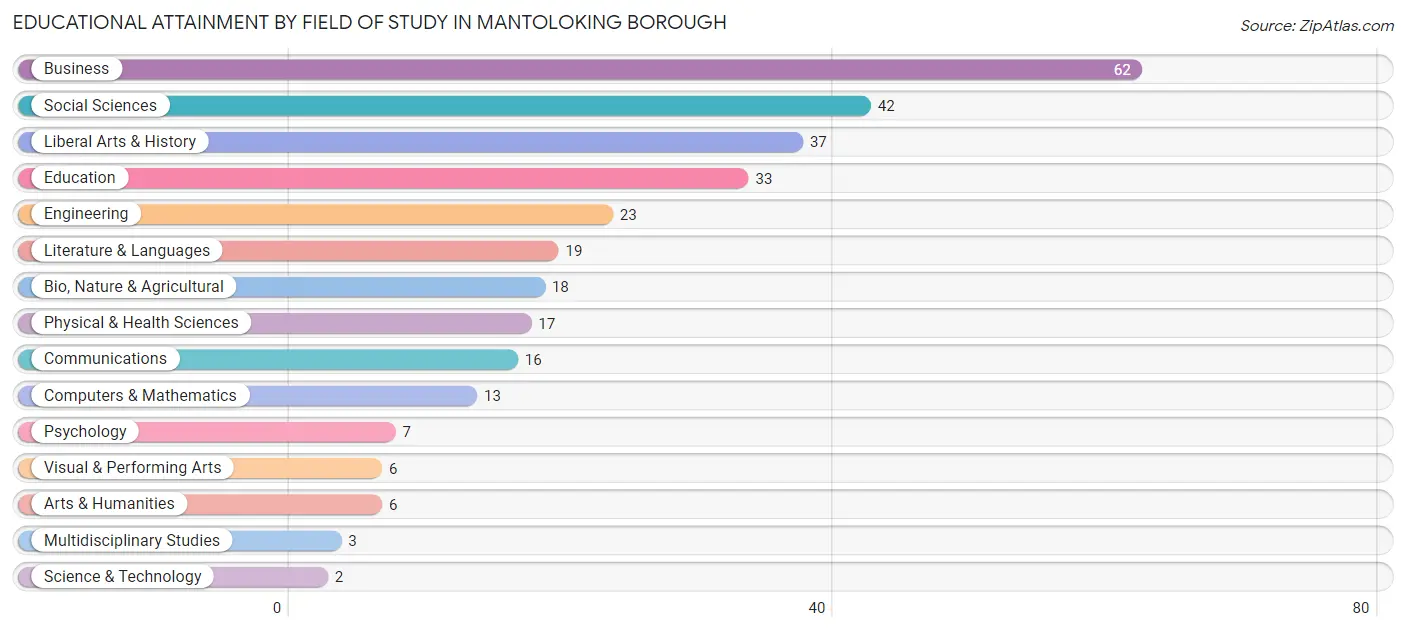
| Field of Study | # Graduates | % Graduates |
| Computers & Mathematics | 13 | 4.3% |
| Bio, Nature & Agricultural | 18 | 5.9% |
| Physical & Health Sciences | 17 | 5.6% |
| Psychology | 7 | 2.3% |
| Social Sciences | 42 | 13.8% |
| Engineering | 23 | 7.6% |
| Multidisciplinary Studies | 3 | 1.0% |
| Science & Technology | 2 | 0.7% |
| Business | 62 | 20.4% |
| Education | 33 | 10.9% |
| Literature & Languages | 19 | 6.2% |
| Liberal Arts & History | 37 | 12.2% |
| Visual & Performing Arts | 6 | 2.0% |
| Communications | 16 | 5.3% |
| Arts & Humanities | 6 | 2.0% |
| Total | 304 | 100.0% |
Transportation & Commute in Mantoloking borough
Vehicle Availability by Sex in Mantoloking borough
The most prevalent vehicle ownership categories in Mantoloking borough are males with 3 vehicles (57, accounting for 47.5%) and females with 3 vehicles (42, making up 76.0%).
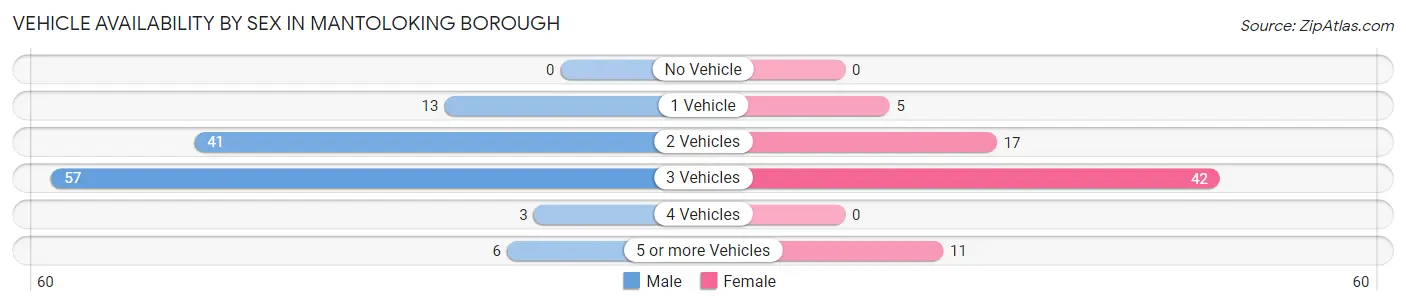
| Vehicles Available | Male | Female |
| No Vehicle | 0 (0.0%) | 0 (0.0%) |
| 1 Vehicle | 13 (10.8%) | 5 (6.7%) |
| 2 Vehicles | 41 (34.2%) | 17 (22.7%) |
| 3 Vehicles | 57 (47.5%) | 42 (56.0%) |
| 4 Vehicles | 3 (2.5%) | 0 (0.0%) |
| 5 or more Vehicles | 6 (5.0%) | 11 (14.7%) |
| Total | 120 (100.0%) | 75 (100.0%) |
Commute Time in Mantoloking borough
The most frequently occuring commute durations in Mantoloking borough are 15 to 19 minutes (25 commuters, 22.5%), 30 to 34 minutes (24 commuters, 21.6%), and 20 to 24 minutes (17 commuters, 15.3%).
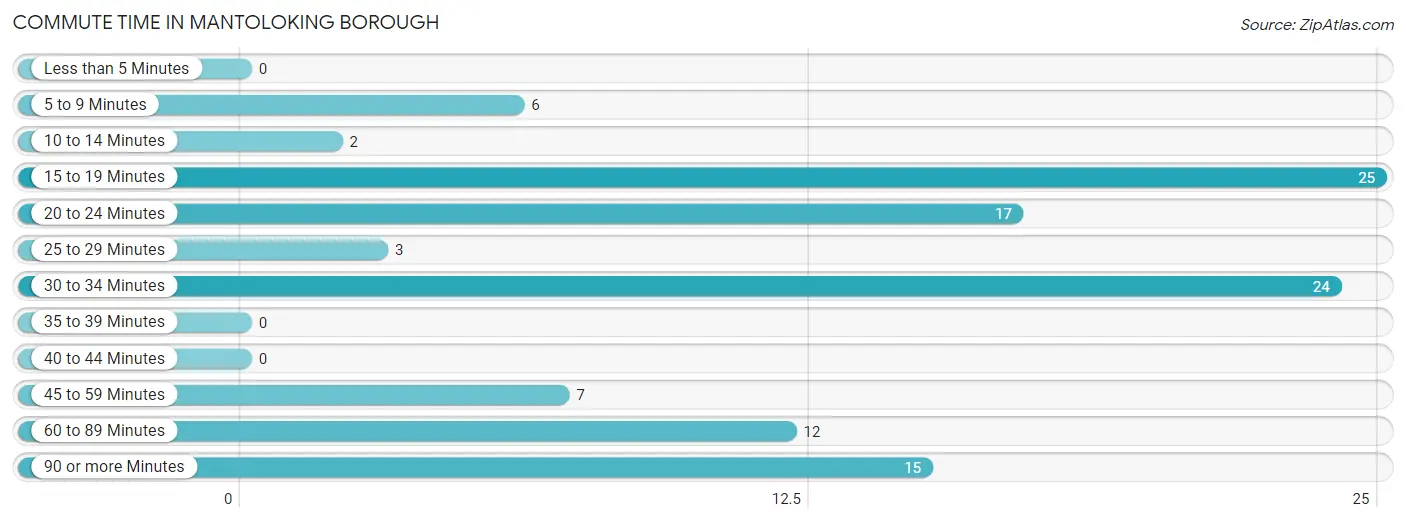
| Commute Time | # Commuters | % Commuters |
| Less than 5 Minutes | 0 | 0.0% |
| 5 to 9 Minutes | 6 | 5.4% |
| 10 to 14 Minutes | 2 | 1.8% |
| 15 to 19 Minutes | 25 | 22.5% |
| 20 to 24 Minutes | 17 | 15.3% |
| 25 to 29 Minutes | 3 | 2.7% |
| 30 to 34 Minutes | 24 | 21.6% |
| 35 to 39 Minutes | 0 | 0.0% |
| 40 to 44 Minutes | 0 | 0.0% |
| 45 to 59 Minutes | 7 | 6.3% |
| 60 to 89 Minutes | 12 | 10.8% |
| 90 or more Minutes | 15 | 13.5% |
Commute Time by Sex in Mantoloking borough
The most common commute times in Mantoloking borough are 30 to 34 minutes (15 commuters, 23.8%) for males and 15 to 19 minutes (14 commuters, 29.2%) for females.
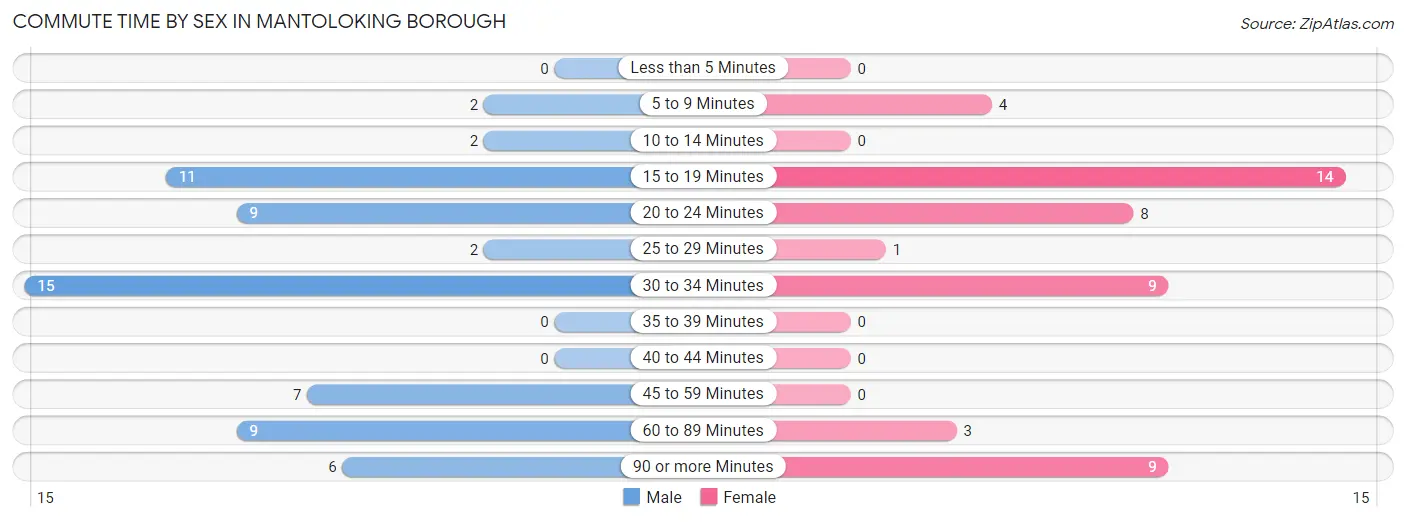
| Commute Time | Male | Female |
| Less than 5 Minutes | 0 (0.0%) | 0 (0.0%) |
| 5 to 9 Minutes | 2 (3.2%) | 4 (8.3%) |
| 10 to 14 Minutes | 2 (3.2%) | 0 (0.0%) |
| 15 to 19 Minutes | 11 (17.5%) | 14 (29.2%) |
| 20 to 24 Minutes | 9 (14.3%) | 8 (16.7%) |
| 25 to 29 Minutes | 2 (3.2%) | 1 (2.1%) |
| 30 to 34 Minutes | 15 (23.8%) | 9 (18.8%) |
| 35 to 39 Minutes | 0 (0.0%) | 0 (0.0%) |
| 40 to 44 Minutes | 0 (0.0%) | 0 (0.0%) |
| 45 to 59 Minutes | 7 (11.1%) | 0 (0.0%) |
| 60 to 89 Minutes | 9 (14.3%) | 3 (6.2%) |
| 90 or more Minutes | 6 (9.5%) | 9 (18.8%) |
Time of Departure to Work by Sex in Mantoloking borough
The most frequent times of departure to work in Mantoloking borough are 8:00 AM to 8:29 AM (27, 42.9%) for males and 8:00 AM to 8:29 AM (20, 41.7%) for females.
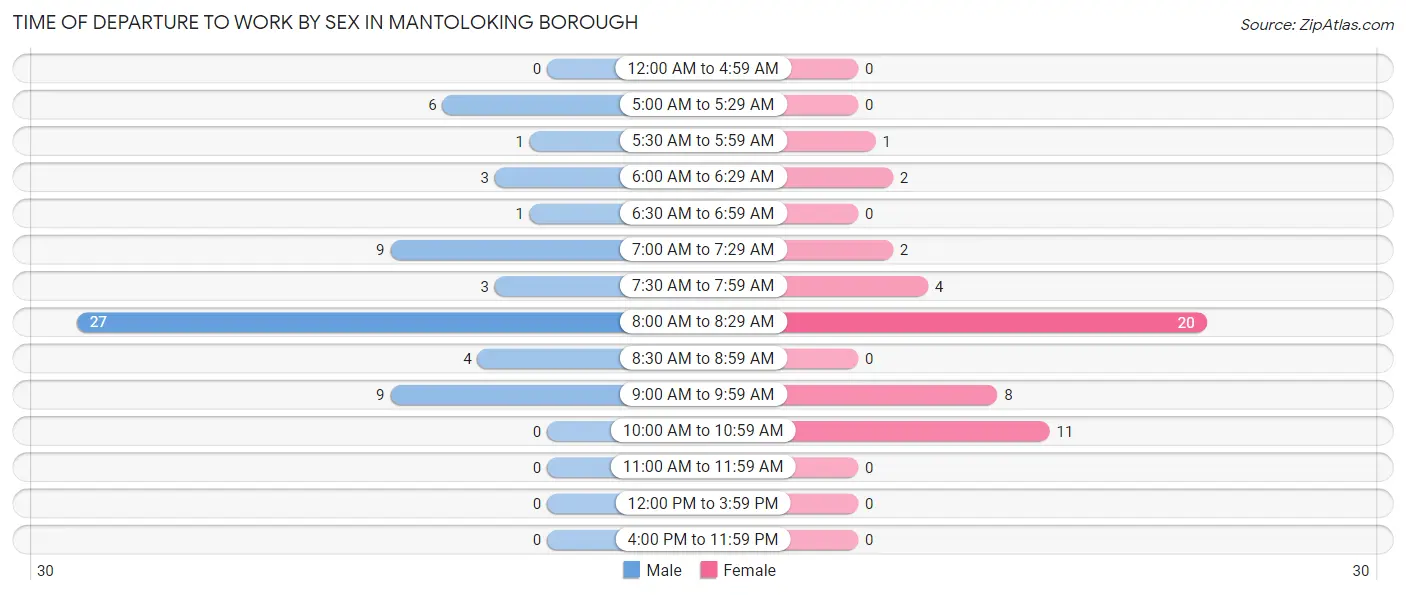
| Time of Departure | Male | Female |
| 12:00 AM to 4:59 AM | 0 (0.0%) | 0 (0.0%) |
| 5:00 AM to 5:29 AM | 6 (9.5%) | 0 (0.0%) |
| 5:30 AM to 5:59 AM | 1 (1.6%) | 1 (2.1%) |
| 6:00 AM to 6:29 AM | 3 (4.8%) | 2 (4.2%) |
| 6:30 AM to 6:59 AM | 1 (1.6%) | 0 (0.0%) |
| 7:00 AM to 7:29 AM | 9 (14.3%) | 2 (4.2%) |
| 7:30 AM to 7:59 AM | 3 (4.8%) | 4 (8.3%) |
| 8:00 AM to 8:29 AM | 27 (42.9%) | 20 (41.7%) |
| 8:30 AM to 8:59 AM | 4 (6.4%) | 0 (0.0%) |
| 9:00 AM to 9:59 AM | 9 (14.3%) | 8 (16.7%) |
| 10:00 AM to 10:59 AM | 0 (0.0%) | 11 (22.9%) |
| 11:00 AM to 11:59 AM | 0 (0.0%) | 0 (0.0%) |
| 12:00 PM to 3:59 PM | 0 (0.0%) | 0 (0.0%) |
| 4:00 PM to 11:59 PM | 0 (0.0%) | 0 (0.0%) |
| Total | 63 (100.0%) | 48 (100.0%) |
Housing Occupancy in Mantoloking borough
Occupancy by Ownership in Mantoloking borough
Of the total 168 dwellings in Mantoloking borough, owner-occupied units account for 166 (98.8%), while renter-occupied units make up 2 (1.2%).
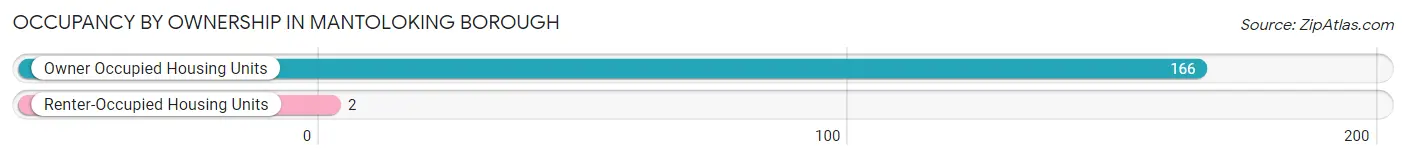
| Occupancy | # Housing Units | % Housing Units |
| Owner Occupied Housing Units | 166 | 98.8% |
| Renter-Occupied Housing Units | 2 | 1.2% |
| Total Occupied Housing Units | 168 | 100.0% |
Occupancy by Household Size in Mantoloking borough
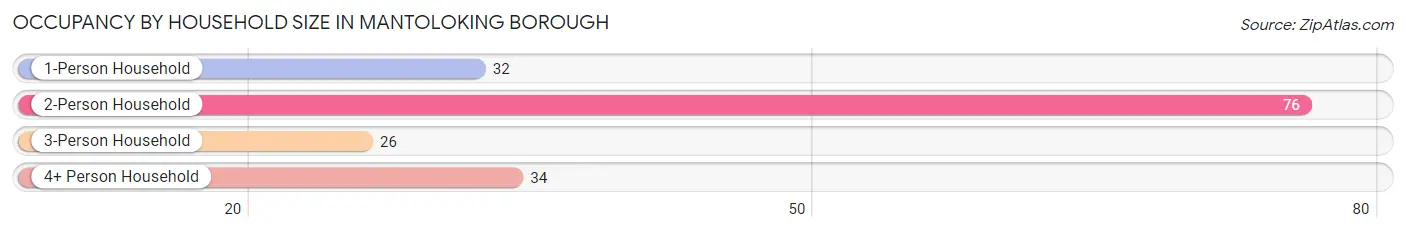
| Household Size | # Housing Units | % Housing Units |
| 1-Person Household | 32 | 19.1% |
| 2-Person Household | 76 | 45.2% |
| 3-Person Household | 26 | 15.5% |
| 4+ Person Household | 34 | 20.2% |
| Total Housing Units | 168 | 100.0% |
Occupancy by Ownership by Household Size in Mantoloking borough
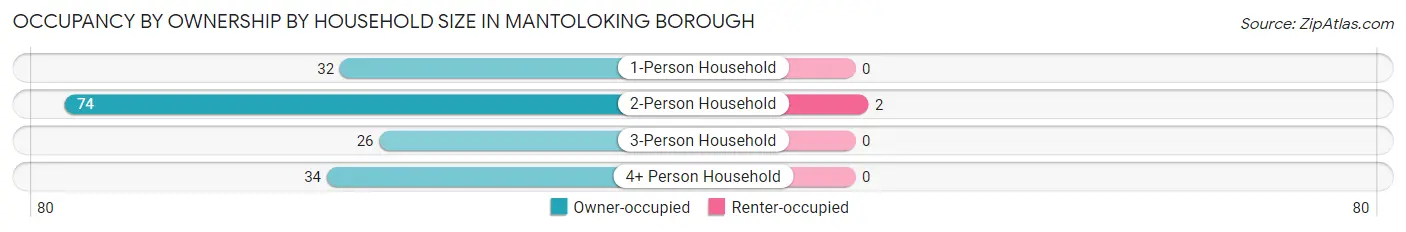
| Household Size | Owner-occupied | Renter-occupied |
| 1-Person Household | 32 (100.0%) | 0 (0.0%) |
| 2-Person Household | 74 (97.4%) | 2 (2.6%) |
| 3-Person Household | 26 (100.0%) | 0 (0.0%) |
| 4+ Person Household | 34 (100.0%) | 0 (0.0%) |
| Total Housing Units | 166 (98.8%) | 2 (1.2%) |
Occupancy by Educational Attainment in Mantoloking borough
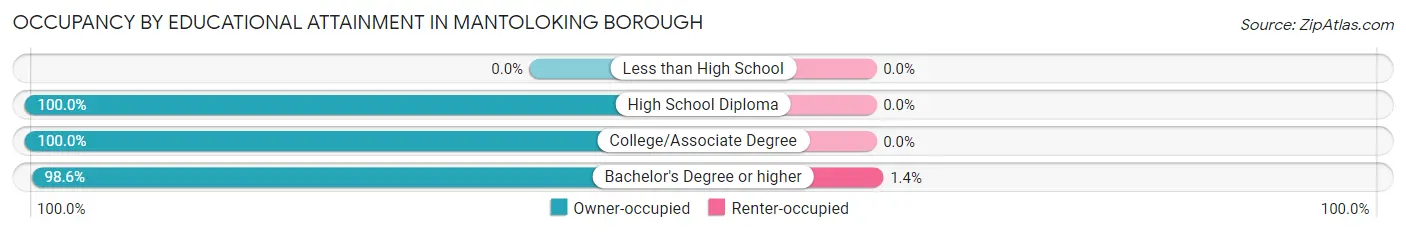
| Household Size | Owner-occupied | Renter-occupied |
| Less than High School | 0 (0.0%) | 0 (0.0%) |
| High School Diploma | 6 (100.0%) | 0 (0.0%) |
| College/Associate Degree | 19 (100.0%) | 0 (0.0%) |
| Bachelor's Degree or higher | 141 (98.6%) | 2 (1.4%) |
Occupancy by Age of Householder in Mantoloking borough
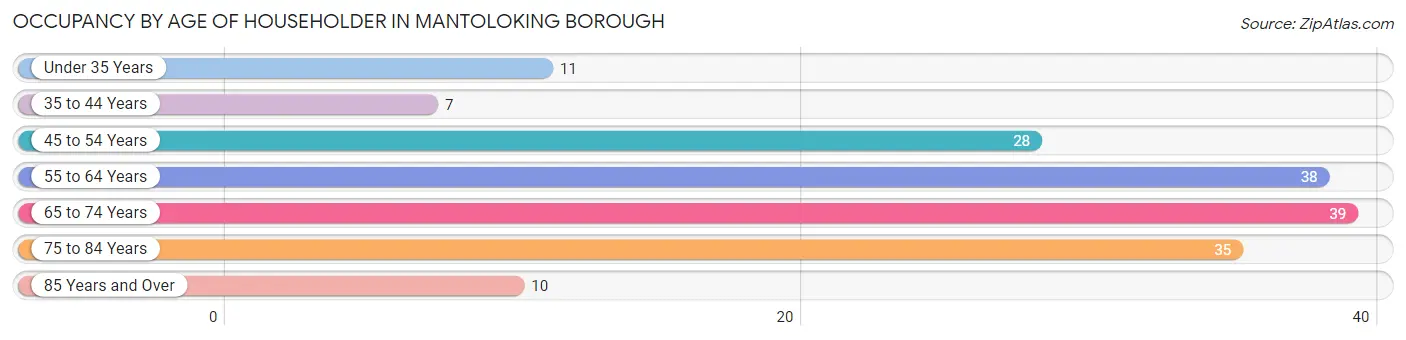
| Age Bracket | # Households | % Households |
| Under 35 Years | 11 | 6.6% |
| 35 to 44 Years | 7 | 4.2% |
| 45 to 54 Years | 28 | 16.7% |
| 55 to 64 Years | 38 | 22.6% |
| 65 to 74 Years | 39 | 23.2% |
| 75 to 84 Years | 35 | 20.8% |
| 85 Years and Over | 10 | 5.9% |
| Total | 168 | 100.0% |
Housing Finances in Mantoloking borough
Median Income by Occupancy in Mantoloking borough
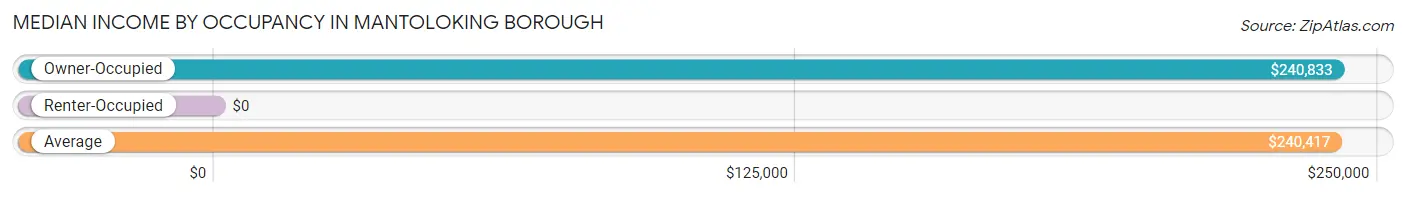
| Occupancy Type | # Households | Median Income |
| Owner-Occupied | 166 (98.8%) | $240,833 |
| Renter-Occupied | 2 (1.2%) | $0 |
| Average | 168 (100.0%) | $240,417 |
Occupancy by Householder Income Bracket in Mantoloking borough
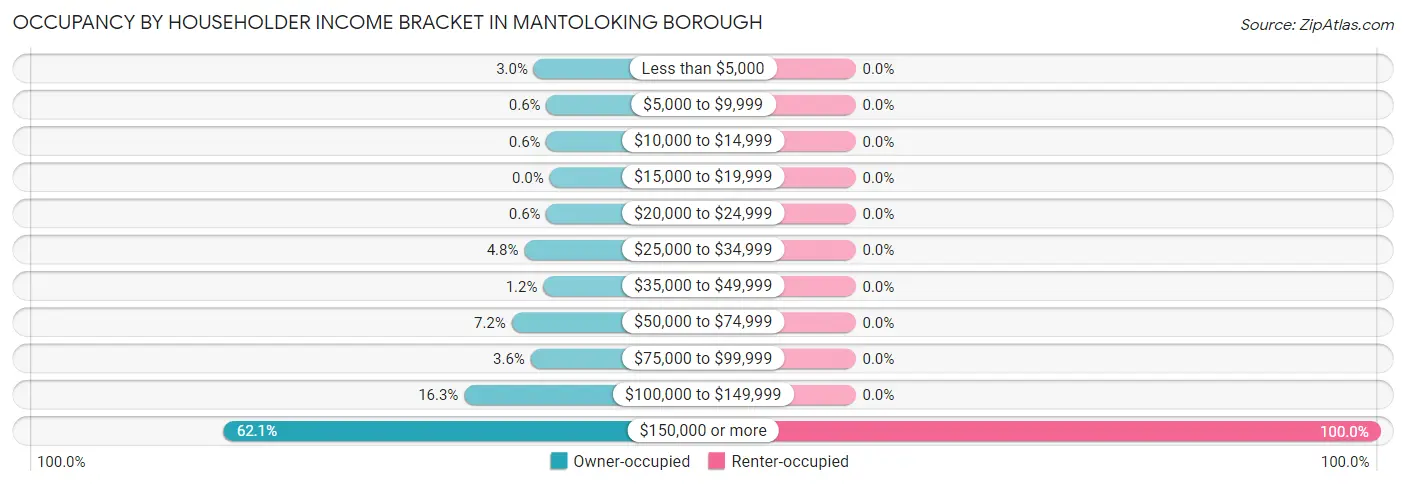
| Income Bracket | Owner-occupied | Renter-occupied |
| Less than $5,000 | 5 (3.0%) | 0 (0.0%) |
| $5,000 to $9,999 | 1 (0.6%) | 0 (0.0%) |
| $10,000 to $14,999 | 1 (0.6%) | 0 (0.0%) |
| $15,000 to $19,999 | 0 (0.0%) | 0 (0.0%) |
| $20,000 to $24,999 | 1 (0.6%) | 0 (0.0%) |
| $25,000 to $34,999 | 8 (4.8%) | 0 (0.0%) |
| $35,000 to $49,999 | 2 (1.2%) | 0 (0.0%) |
| $50,000 to $74,999 | 12 (7.2%) | 0 (0.0%) |
| $75,000 to $99,999 | 6 (3.6%) | 0 (0.0%) |
| $100,000 to $149,999 | 27 (16.3%) | 0 (0.0%) |
| $150,000 or more | 103 (62.1%) | 2 (100.0%) |
| Total | 166 (100.0%) | 2 (100.0%) |
Monthly Housing Cost Tiers in Mantoloking borough
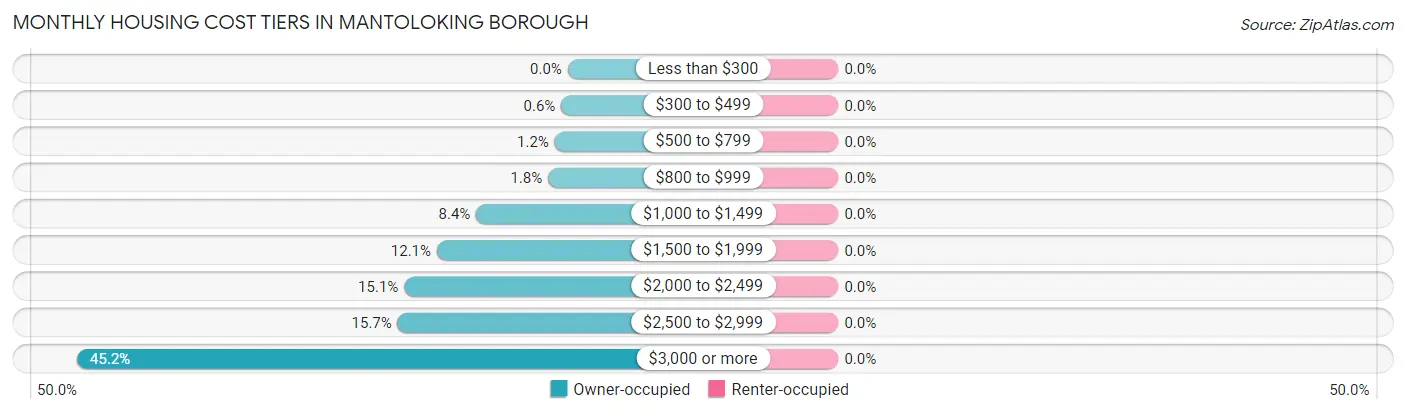
| Monthly Cost | Owner-occupied | Renter-occupied |
| Less than $300 | 0 (0.0%) | 0 (0.0%) |
| $300 to $499 | 1 (0.6%) | 0 (0.0%) |
| $500 to $799 | 2 (1.2%) | 0 (0.0%) |
| $800 to $999 | 3 (1.8%) | 0 (0.0%) |
| $1,000 to $1,499 | 14 (8.4%) | 0 (0.0%) |
| $1,500 to $1,999 | 20 (12.0%) | 0 (0.0%) |
| $2,000 to $2,499 | 25 (15.1%) | 0 (0.0%) |
| $2,500 to $2,999 | 26 (15.7%) | 0 (0.0%) |
| $3,000 or more | 75 (45.2%) | 0 (0.0%) |
| Total | 166 (100.0%) | 2 (100.0%) |
Physical Housing Characteristics in Mantoloking borough
Housing Structures in Mantoloking borough
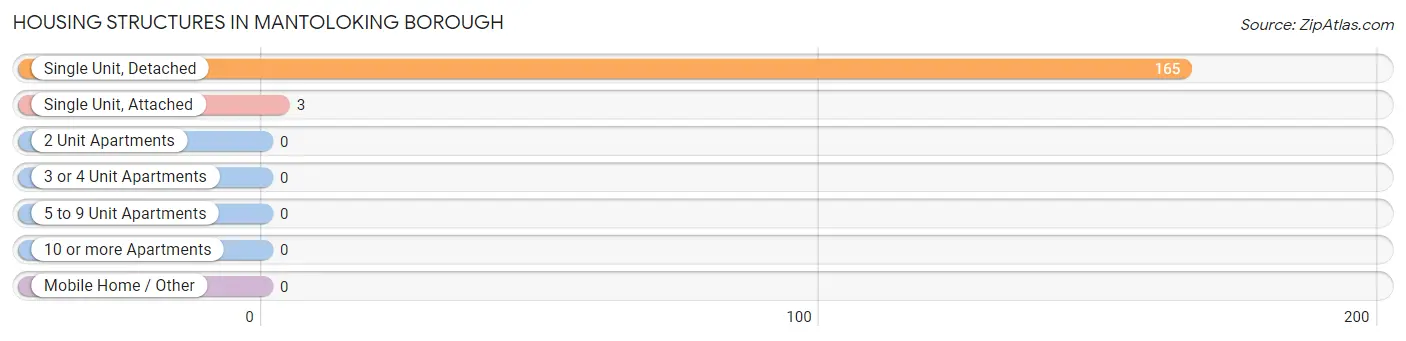
| Structure Type | # Housing Units | % Housing Units |
| Single Unit, Detached | 165 | 98.2% |
| Single Unit, Attached | 3 | 1.8% |
| 2 Unit Apartments | 0 | 0.0% |
| 3 or 4 Unit Apartments | 0 | 0.0% |
| 5 to 9 Unit Apartments | 0 | 0.0% |
| 10 or more Apartments | 0 | 0.0% |
| Mobile Home / Other | 0 | 0.0% |
| Total | 168 | 100.0% |
Housing Structures by Occupancy in Mantoloking borough
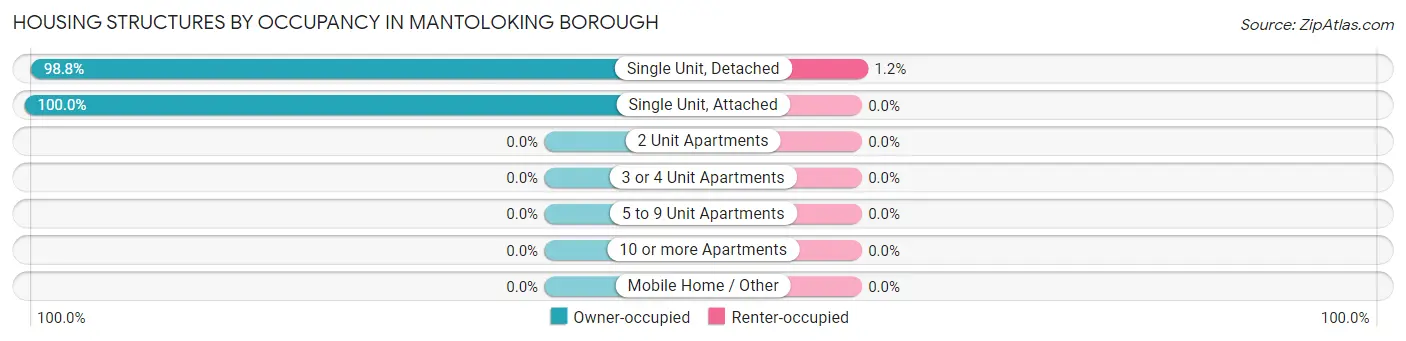
| Structure Type | Owner-occupied | Renter-occupied |
| Single Unit, Detached | 163 (98.8%) | 2 (1.2%) |
| Single Unit, Attached | 3 (100.0%) | 0 (0.0%) |
| 2 Unit Apartments | 0 (0.0%) | 0 (0.0%) |
| 3 or 4 Unit Apartments | 0 (0.0%) | 0 (0.0%) |
| 5 to 9 Unit Apartments | 0 (0.0%) | 0 (0.0%) |
| 10 or more Apartments | 0 (0.0%) | 0 (0.0%) |
| Mobile Home / Other | 0 (0.0%) | 0 (0.0%) |
| Total | 166 (98.8%) | 2 (1.2%) |
Housing Structures by Number of Rooms in Mantoloking borough
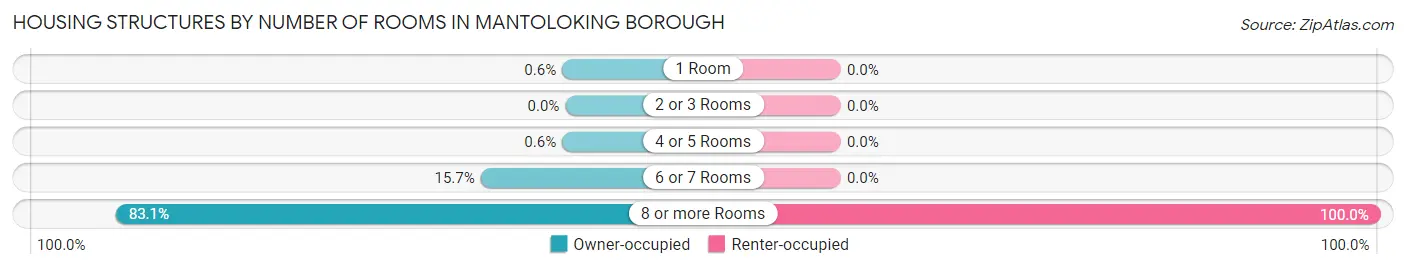
| Number of Rooms | Owner-occupied | Renter-occupied |
| 1 Room | 1 (0.6%) | 0 (0.0%) |
| 2 or 3 Rooms | 0 (0.0%) | 0 (0.0%) |
| 4 or 5 Rooms | 1 (0.6%) | 0 (0.0%) |
| 6 or 7 Rooms | 26 (15.7%) | 0 (0.0%) |
| 8 or more Rooms | 138 (83.1%) | 2 (100.0%) |
| Total | 166 (100.0%) | 2 (100.0%) |
Housing Structure by Heating Type in Mantoloking borough
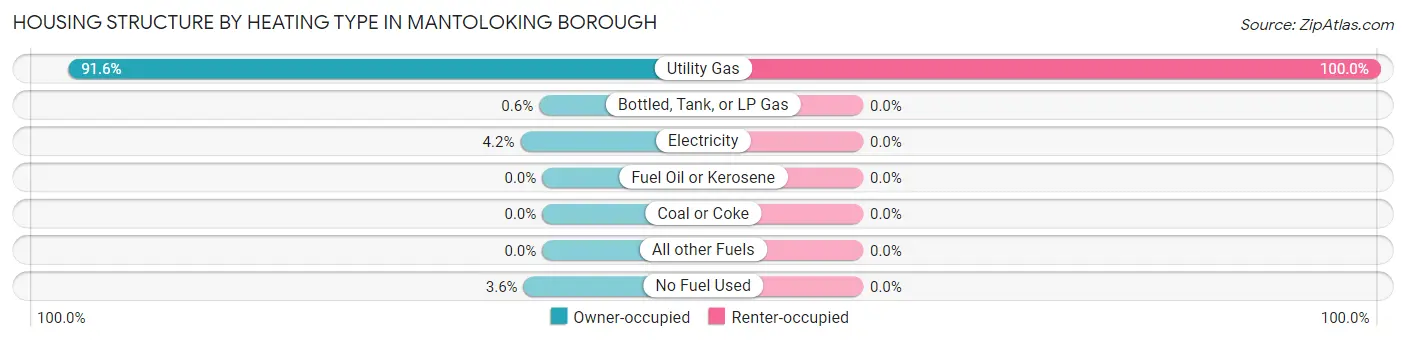
| Heating Type | Owner-occupied | Renter-occupied |
| Utility Gas | 152 (91.6%) | 2 (100.0%) |
| Bottled, Tank, or LP Gas | 1 (0.6%) | 0 (0.0%) |
| Electricity | 7 (4.2%) | 0 (0.0%) |
| Fuel Oil or Kerosene | 0 (0.0%) | 0 (0.0%) |
| Coal or Coke | 0 (0.0%) | 0 (0.0%) |
| All other Fuels | 0 (0.0%) | 0 (0.0%) |
| No Fuel Used | 6 (3.6%) | 0 (0.0%) |
| Total | 166 (100.0%) | 2 (100.0%) |
Household Vehicle Usage in Mantoloking borough
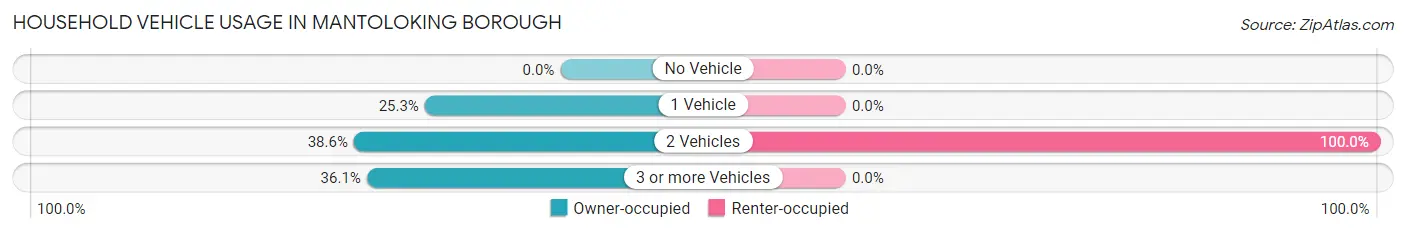
| Vehicles per Household | Owner-occupied | Renter-occupied |
| No Vehicle | 0 (0.0%) | 0 (0.0%) |
| 1 Vehicle | 42 (25.3%) | 0 (0.0%) |
| 2 Vehicles | 64 (38.6%) | 2 (100.0%) |
| 3 or more Vehicles | 60 (36.1%) | 0 (0.0%) |
| Total | 166 (100.0%) | 2 (100.0%) |
Real Estate & Mortgages in Mantoloking borough
Real Estate and Mortgage Overview in Mantoloking borough
| Characteristic | Without Mortgage | With Mortgage |
| Housing Units | 97 | 69 |
| Median Property Value | $2,000,001 | $2,000,001 |
| Median Household Income | $233,750 | $46 |
| Monthly Housing Costs | $1,501 | $55 |
| Real Estate Taxes | $10,001 | $0 |
Property Value by Mortgage Status in Mantoloking borough
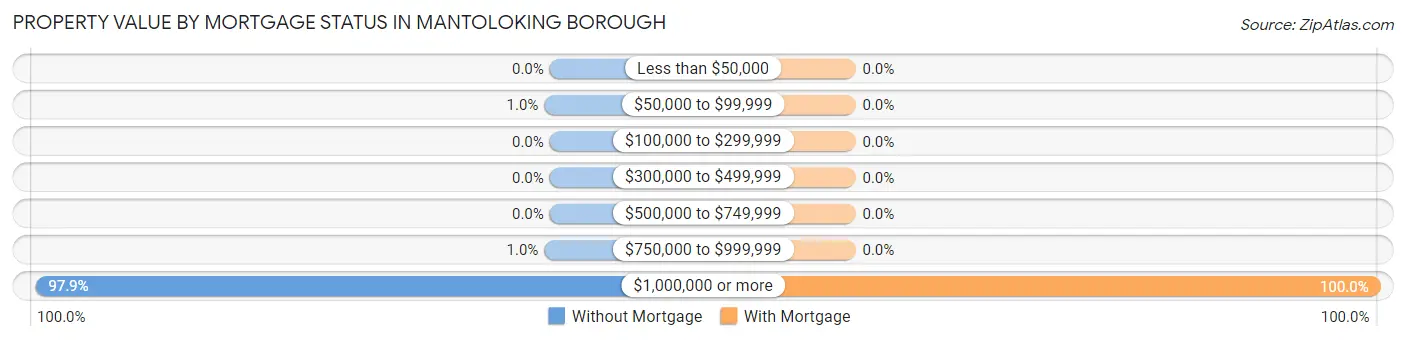
| Property Value | Without Mortgage | With Mortgage |
| Less than $50,000 | 0 (0.0%) | 0 (0.0%) |
| $50,000 to $99,999 | 1 (1.0%) | 0 (0.0%) |
| $100,000 to $299,999 | 0 (0.0%) | 0 (0.0%) |
| $300,000 to $499,999 | 0 (0.0%) | 0 (0.0%) |
| $500,000 to $749,999 | 0 (0.0%) | 0 (0.0%) |
| $750,000 to $999,999 | 1 (1.0%) | 0 (0.0%) |
| $1,000,000 or more | 95 (97.9%) | 69 (100.0%) |
| Total | 97 (100.0%) | 69 (100.0%) |
Household Income by Mortgage Status in Mantoloking borough
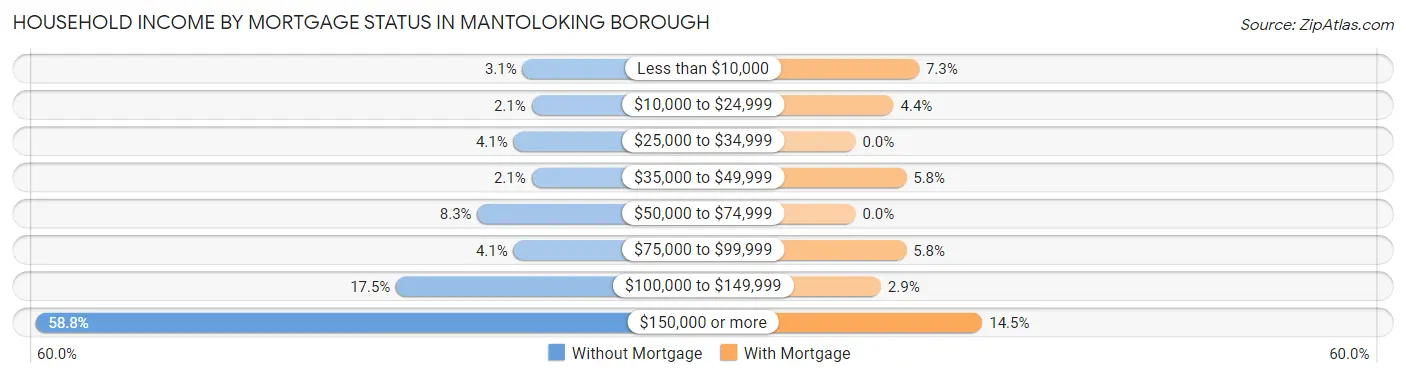
| Household Income | Without Mortgage | With Mortgage |
| Less than $10,000 | 3 (3.1%) | 5 (7.2%) |
| $10,000 to $24,999 | 2 (2.1%) | 3 (4.3%) |
| $25,000 to $34,999 | 4 (4.1%) | 0 (0.0%) |
| $35,000 to $49,999 | 2 (2.1%) | 4 (5.8%) |
| $50,000 to $74,999 | 8 (8.3%) | 0 (0.0%) |
| $75,000 to $99,999 | 4 (4.1%) | 4 (5.8%) |
| $100,000 to $149,999 | 17 (17.5%) | 2 (2.9%) |
| $150,000 or more | 57 (58.8%) | 10 (14.5%) |
| Total | 97 (100.0%) | 69 (100.0%) |
Property Value to Household Income Ratio in Mantoloking borough
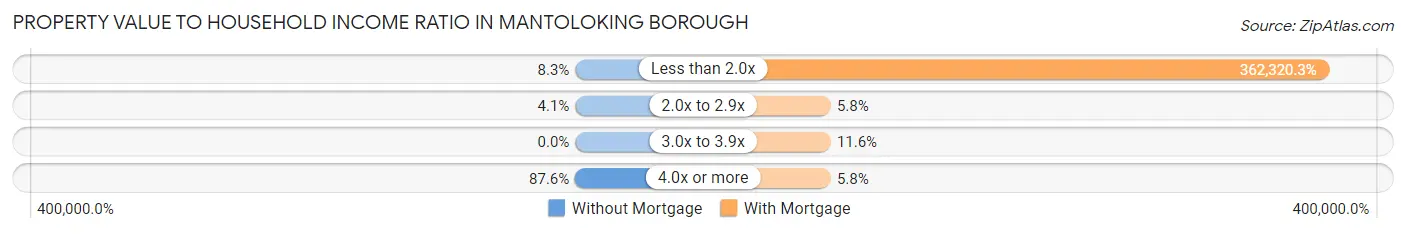
| Value-to-Income Ratio | Without Mortgage | With Mortgage |
| Less than 2.0x | 8 (8.3%) | 250,001 (362,320.3%) |
| 2.0x to 2.9x | 4 (4.1%) | 4 (5.8%) |
| 3.0x to 3.9x | 0 (0.0%) | 8 (11.6%) |
| 4.0x or more | 85 (87.6%) | 4 (5.8%) |
| Total | 97 (100.0%) | 69 (100.0%) |
Real Estate Taxes by Mortgage Status in Mantoloking borough
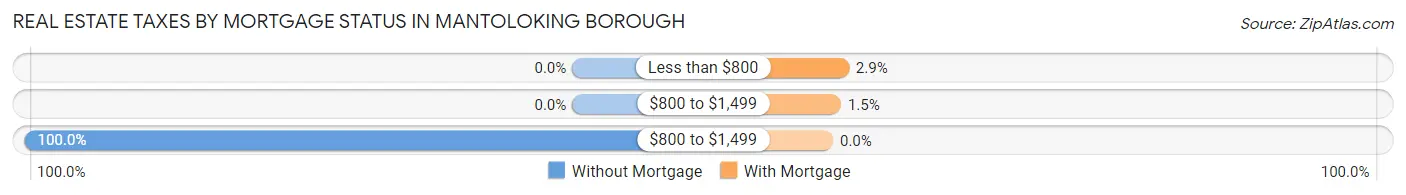
| Property Taxes | Without Mortgage | With Mortgage |
| Less than $800 | 0 (0.0%) | 2 (2.9%) |
| $800 to $1,499 | 0 (0.0%) | 1 (1.5%) |
| $800 to $1,499 | 97 (100.0%) | 0 (0.0%) |
| Total | 97 (100.0%) | 69 (100.0%) |
Health & Disability in Mantoloking borough
Health Insurance Coverage by Age in Mantoloking borough
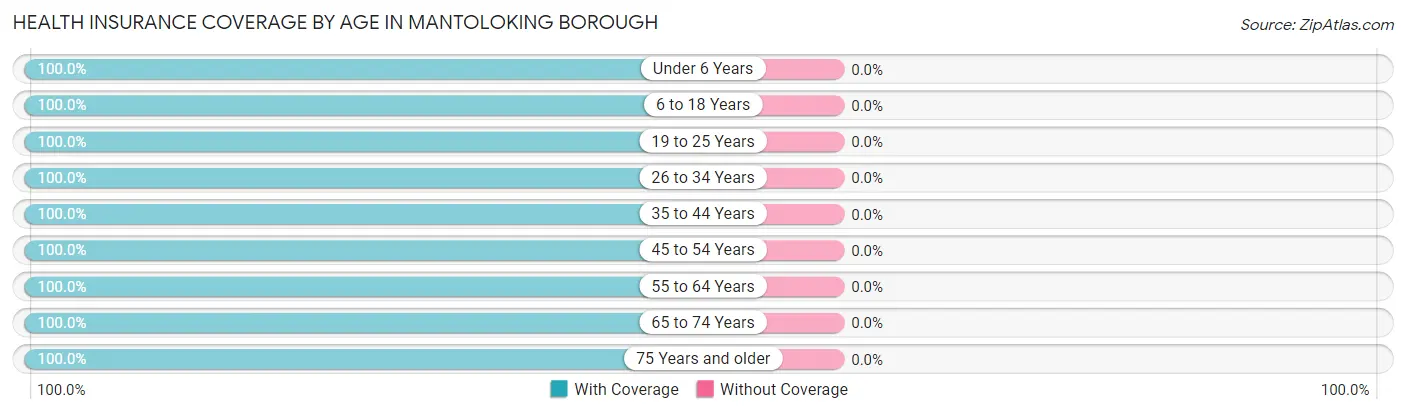
| Age Bracket | With Coverage | Without Coverage |
| Under 6 Years | 16 (100.0%) | 0 (0.0%) |
| 6 to 18 Years | 38 (100.0%) | 0 (0.0%) |
| 19 to 25 Years | 45 (100.0%) | 0 (0.0%) |
| 26 to 34 Years | 26 (100.0%) | 0 (0.0%) |
| 35 to 44 Years | 9 (100.0%) | 0 (0.0%) |
| 45 to 54 Years | 59 (100.0%) | 0 (0.0%) |
| 55 to 64 Years | 65 (100.0%) | 0 (0.0%) |
| 65 to 74 Years | 73 (100.0%) | 0 (0.0%) |
| 75 Years and older | 80 (100.0%) | 0 (0.0%) |
| Total | 411 (100.0%) | 0 (0.0%) |
Health Insurance Coverage by Citizenship Status in Mantoloking borough
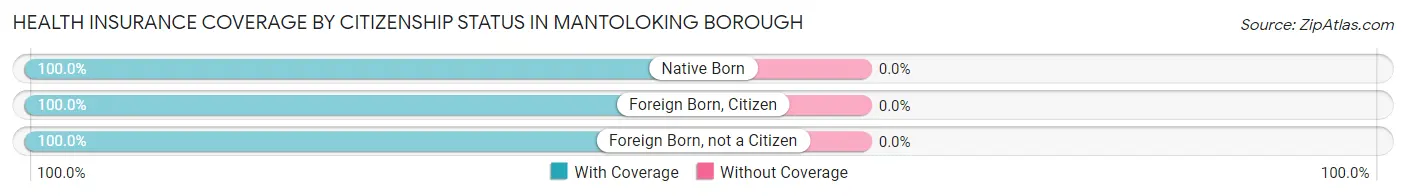
| Citizenship Status | With Coverage | Without Coverage |
| Native Born | 16 (100.0%) | 0 (0.0%) |
| Foreign Born, Citizen | 38 (100.0%) | 0 (0.0%) |
| Foreign Born, not a Citizen | 45 (100.0%) | 0 (0.0%) |
Health Insurance Coverage by Household Income in Mantoloking borough
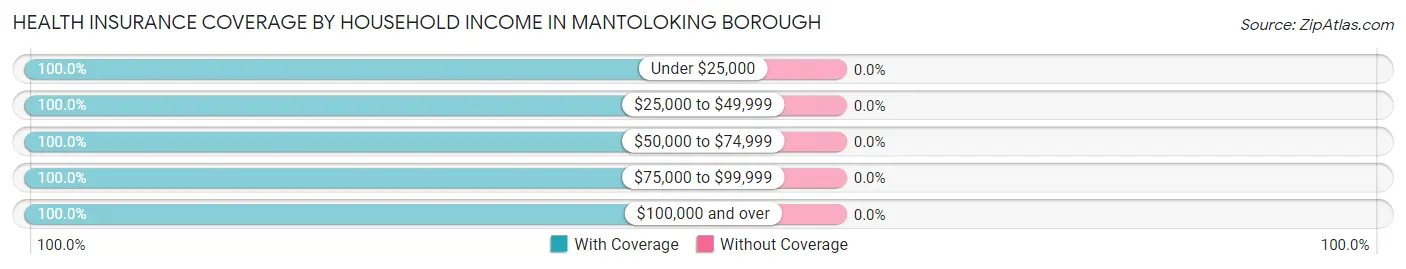
| Household Income | With Coverage | Without Coverage |
| Under $25,000 | 9 (100.0%) | 0 (0.0%) |
| $25,000 to $49,999 | 15 (100.0%) | 0 (0.0%) |
| $50,000 to $74,999 | 26 (100.0%) | 0 (0.0%) |
| $75,000 to $99,999 | 15 (100.0%) | 0 (0.0%) |
| $100,000 and over | 346 (100.0%) | 0 (0.0%) |
Public vs Private Health Insurance Coverage by Age in Mantoloking borough
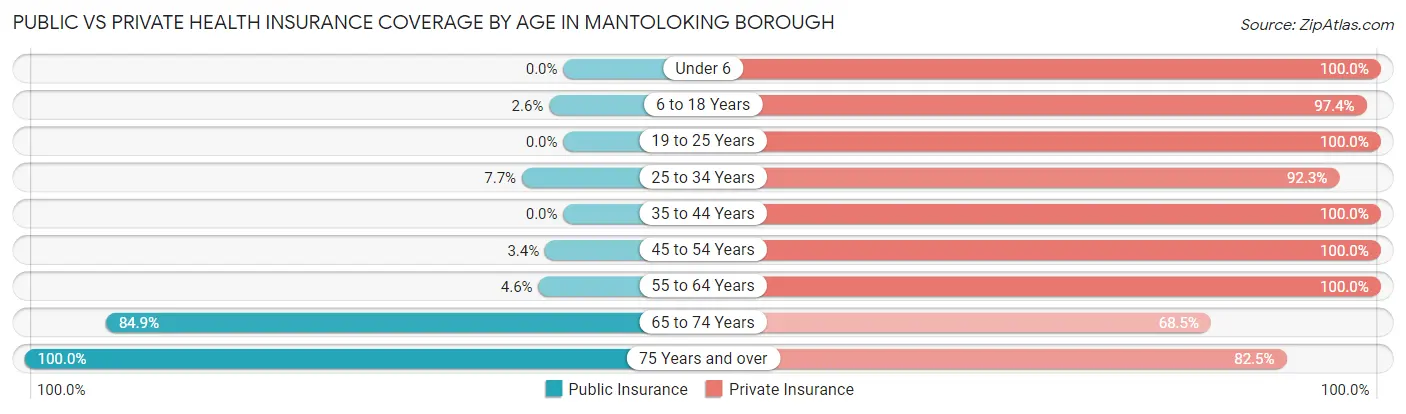
| Age Bracket | Public Insurance | Private Insurance |
| Under 6 | 0 (0.0%) | 16 (100.0%) |
| 6 to 18 Years | 1 (2.6%) | 37 (97.4%) |
| 19 to 25 Years | 0 (0.0%) | 45 (100.0%) |
| 25 to 34 Years | 2 (7.7%) | 24 (92.3%) |
| 35 to 44 Years | 0 (0.0%) | 9 (100.0%) |
| 45 to 54 Years | 2 (3.4%) | 59 (100.0%) |
| 55 to 64 Years | 3 (4.6%) | 65 (100.0%) |
| 65 to 74 Years | 62 (84.9%) | 50 (68.5%) |
| 75 Years and over | 80 (100.0%) | 66 (82.5%) |
| Total | 150 (36.5%) | 371 (90.3%) |
Disability Status by Sex by Age in Mantoloking borough
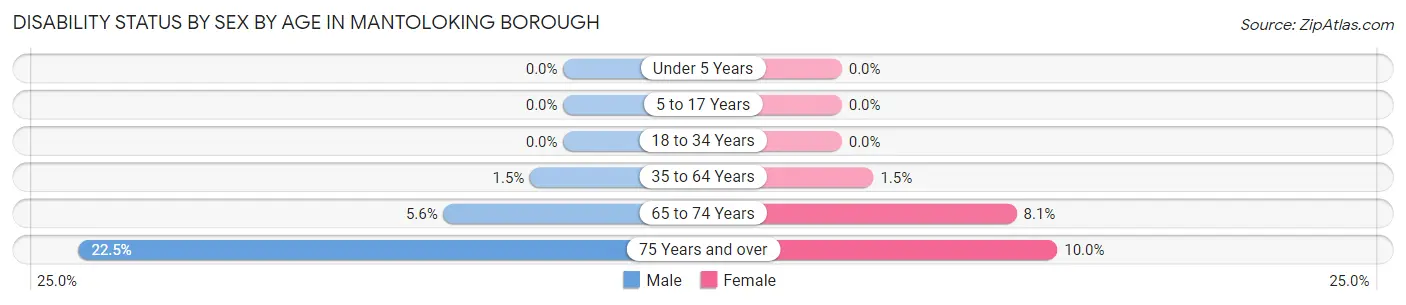
| Age Bracket | Male | Female |
| Under 5 Years | 0 (0.0%) | 0 (0.0%) |
| 5 to 17 Years | 0 (0.0%) | 0 (0.0%) |
| 18 to 34 Years | 0 (0.0%) | 0 (0.0%) |
| 35 to 64 Years | 1 (1.5%) | 1 (1.5%) |
| 65 to 74 Years | 2 (5.6%) | 3 (8.1%) |
| 75 Years and over | 9 (22.5%) | 4 (10.0%) |
Disability Class by Sex by Age in Mantoloking borough
Disability Class: Hearing Difficulty
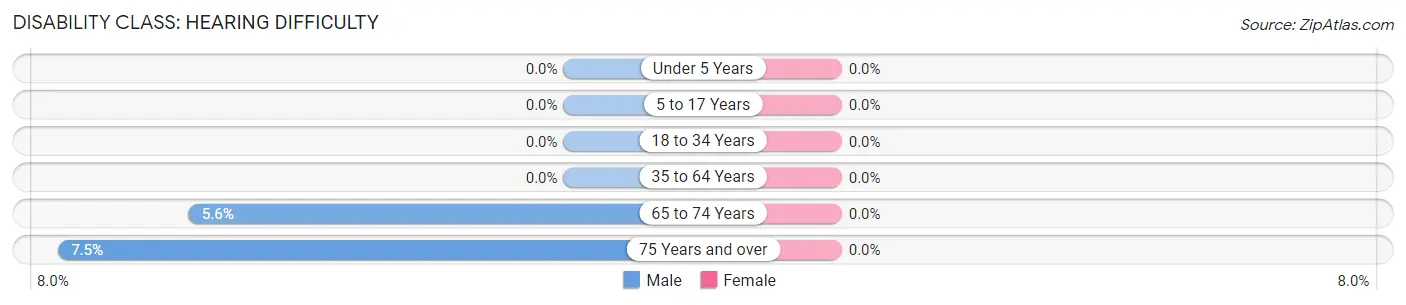
| Age Bracket | Male | Female |
| Under 5 Years | 0 (0.0%) | 0 (0.0%) |
| 5 to 17 Years | 0 (0.0%) | 0 (0.0%) |
| 18 to 34 Years | 0 (0.0%) | 0 (0.0%) |
| 35 to 64 Years | 0 (0.0%) | 0 (0.0%) |
| 65 to 74 Years | 2 (5.6%) | 0 (0.0%) |
| 75 Years and over | 3 (7.5%) | 0 (0.0%) |
Disability Class: Vision Difficulty
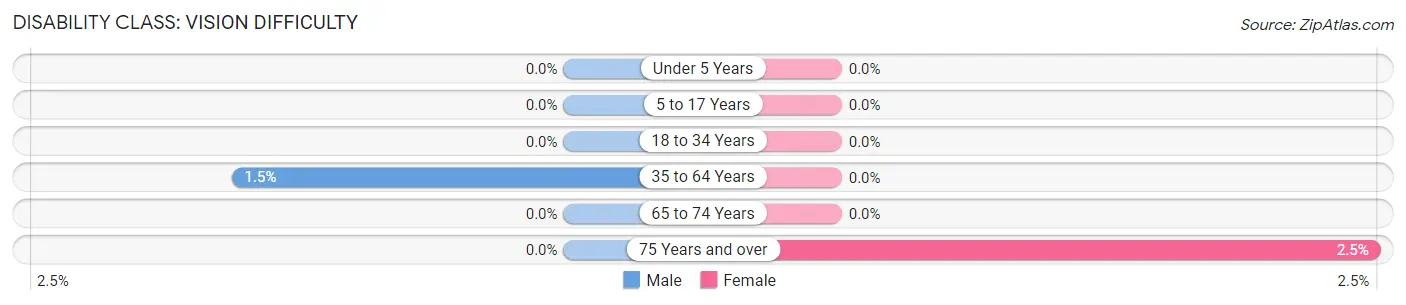
| Age Bracket | Male | Female |
| Under 5 Years | 0 (0.0%) | 0 (0.0%) |
| 5 to 17 Years | 0 (0.0%) | 0 (0.0%) |
| 18 to 34 Years | 0 (0.0%) | 0 (0.0%) |
| 35 to 64 Years | 1 (1.5%) | 0 (0.0%) |
| 65 to 74 Years | 0 (0.0%) | 0 (0.0%) |
| 75 Years and over | 0 (0.0%) | 1 (2.5%) |
Disability Class: Cognitive Difficulty
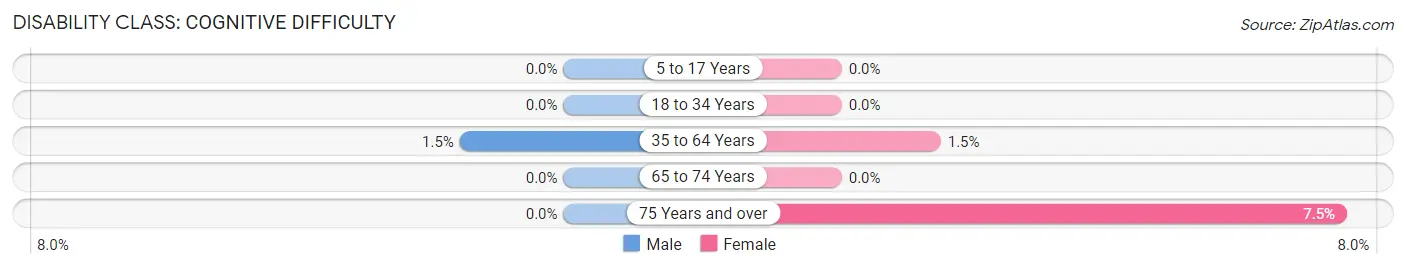
| Age Bracket | Male | Female |
| 5 to 17 Years | 0 (0.0%) | 0 (0.0%) |
| 18 to 34 Years | 0 (0.0%) | 0 (0.0%) |
| 35 to 64 Years | 1 (1.5%) | 1 (1.5%) |
| 65 to 74 Years | 0 (0.0%) | 0 (0.0%) |
| 75 Years and over | 0 (0.0%) | 3 (7.5%) |
Disability Class: Ambulatory Difficulty
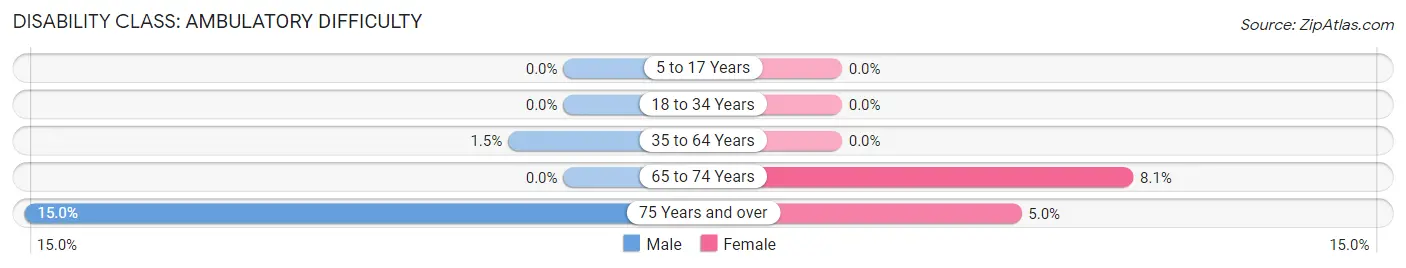
| Age Bracket | Male | Female |
| 5 to 17 Years | 0 (0.0%) | 0 (0.0%) |
| 18 to 34 Years | 0 (0.0%) | 0 (0.0%) |
| 35 to 64 Years | 1 (1.5%) | 0 (0.0%) |
| 65 to 74 Years | 0 (0.0%) | 3 (8.1%) |
| 75 Years and over | 6 (15.0%) | 2 (5.0%) |
Disability Class: Self-Care Difficulty
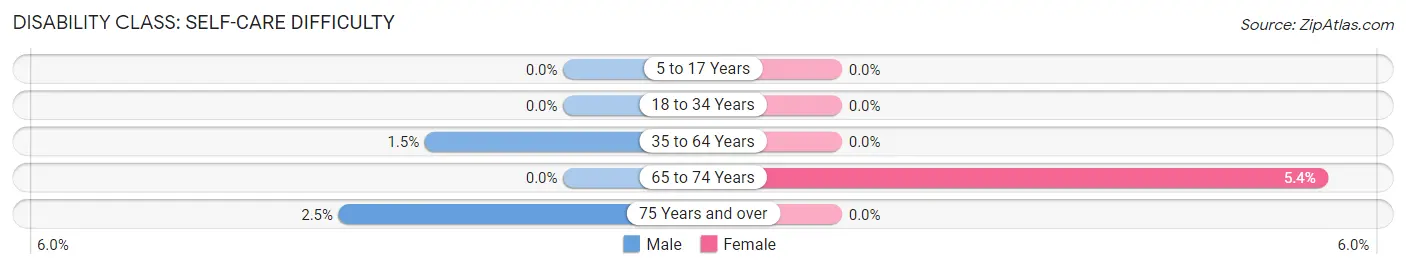
| Age Bracket | Male | Female |
| 5 to 17 Years | 0 (0.0%) | 0 (0.0%) |
| 18 to 34 Years | 0 (0.0%) | 0 (0.0%) |
| 35 to 64 Years | 1 (1.5%) | 0 (0.0%) |
| 65 to 74 Years | 0 (0.0%) | 2 (5.4%) |
| 75 Years and over | 1 (2.5%) | 0 (0.0%) |
Technology Access in Mantoloking borough
Computing Device Access in Mantoloking borough
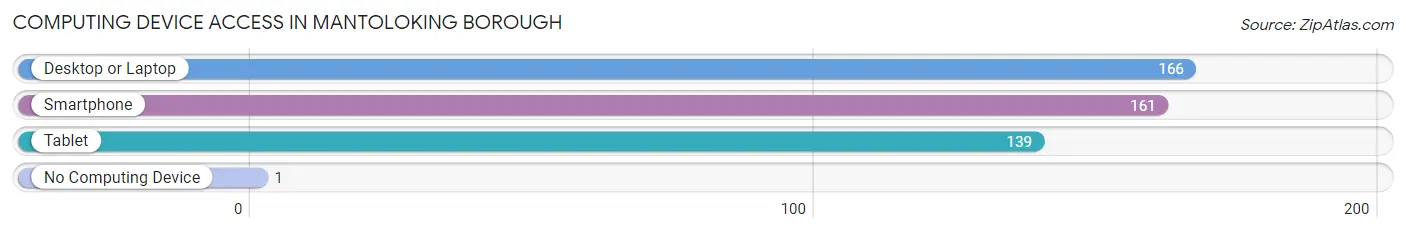
| Device Type | # Households | % Households |
| Desktop or Laptop | 166 | 98.8% |
| Smartphone | 161 | 95.8% |
| Tablet | 139 | 82.7% |
| No Computing Device | 1 | 0.6% |
| Total | 168 | 100.0% |
Internet Access in Mantoloking borough
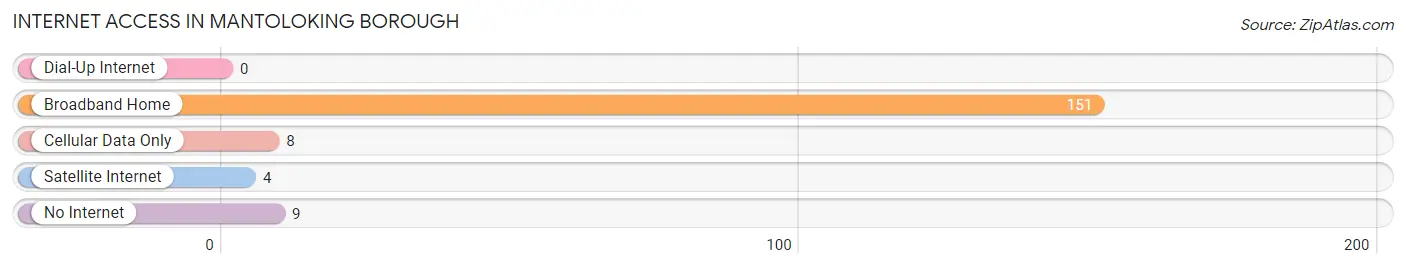
| Internet Type | # Households | % Households |
| Dial-Up Internet | 0 | 0.0% |
| Broadband Home | 151 | 89.9% |
| Cellular Data Only | 8 | 4.8% |
| Satellite Internet | 4 | 2.4% |
| No Internet | 9 | 5.4% |
| Total | 168 | 100.0% |
Mantoloking borough Summary
Mantoloking Borough is a small borough located in Ocean County, New Jersey. It is situated on the Barnegat Peninsula, which is a barrier island that separates Barnegat Bay from the Atlantic Ocean. The borough is bordered by Brick Township to the west, Point Pleasant Beach to the north, and the Atlantic Ocean to the east and south. Mantoloking is a popular summer destination for tourists and is known for its beautiful beaches and oceanfront homes.
History
Mantoloking was originally inhabited by the Lenape Native Americans. The first European settlers arrived in the area in the late 1600s and established a fishing village. The area was known as “Mantoloking”, which is derived from the Lenape word “Mantoloking”, meaning “place of the island”.
In the late 1800s, the area began to develop as a resort destination. The first hotel was built in 1887 and the first boardwalk was constructed in 1895. The borough was officially incorporated in 1911.
Geography
Mantoloking is located at 39°56′N 74°04′W (39.9333, -74.0667). According to the United States Census Bureau, the borough has a total area of 0.9 square miles (2.3 km2), all of which is land.
The borough is located on the Barnegat Peninsula, which is a barrier island that separates Barnegat Bay from the Atlantic Ocean. The borough is bordered by Brick Township to the west, Point Pleasant Beach to the north, and the Atlantic Ocean to the east and south.
Economy
Mantoloking’s economy is largely based on tourism. The borough is a popular summer destination for tourists and is known for its beautiful beaches and oceanfront homes. The borough also has a number of restaurants, shops, and other businesses that cater to tourists.
Demographics
As of the 2010 United States Census, there were 521 people, 246 households, and 166 families residing in the borough. The population density was 576.7 people per square mile (223.3/km2). There were 590 housing units at an average density of 651.1 per square mile (251.3/km2). The racial makeup of the borough was 97.7% White, 0.4% African American, 0.2% Native American, 0.4% Asian, 0.2% from other races, and 1.1% from two or more races. Hispanic or Latino of any race were 1.7% of the population.
There were 246 households, out of which 15.9% had children under the age of 18 living with them, 59.3% were married couples living together, 5.7% had a female householder with no husband present, and 32.5% were non-families. 28.9% of all households were made up of individuals, and 15.5% had someone living alone who was 65 years of age or older. The average household size was 2.11 and the average family size was 2.56.
In the borough, the population was spread out, with 14.2% under the age of 18, 3.3% from 18 to 24, 15.2% from 25 to 44, 37.2% from 45 to 64, and 30.1% who were 65 years of age or older. The median age was 56 years. For every 100 females, there were 97.2 males. For every 100 females age 18 and over, there were 97.2 males.
The median income for a household in the borough was $90,000, and the median income for a family was $103,125. Males had a median income of $75,000 versus $50,000 for females. The per capita income for the borough was $60,938. About 1.7% of families and 2.7% of the population were below the poverty line, including none of those under age 18 and 4.2% of those age 65 or over.
Common Questions
What is Per Capita Income in Mantoloking borough?
Per Capita income in Mantoloking borough is $159,649.
What is the Median Family Income in Mantoloking borough?
Median Family Income in Mantoloking borough is $250,001.
What is the Median Household income in Mantoloking borough?
Median Household Income in Mantoloking borough is $240,417.
What is Income or Wage Gap in Mantoloking borough?
Income or Wage Gap in Mantoloking borough is 60.7%.
Women in Mantoloking borough earn 39.3 cents for every dollar earned by a man.
What is Inequality or Gini Index in Mantoloking borough?
Inequality or Gini Index in Mantoloking borough is 0.53.
What is the Total Population of Mantoloking borough?
Total Population of Mantoloking borough is 417.
What is the Total Male Population of Mantoloking borough?
Total Male Population of Mantoloking borough is 195.
What is the Total Female Population of Mantoloking borough?
Total Female Population of Mantoloking borough is 222.
What is the Ratio of Males per 100 Females in Mantoloking borough?
There are 87.84 Males per 100 Females in Mantoloking borough.
What is the Ratio of Females per 100 Males in Mantoloking borough?
There are 113.85 Females per 100 Males in Mantoloking borough.
What is the Median Population Age in Mantoloking borough?
Median Population Age in Mantoloking borough is 56.7 Years.
What is the Average Family Size in Mantoloking borough
Average Family Size in Mantoloking borough is 2.8 People.
What is the Average Household Size in Mantoloking borough
Average Household Size in Mantoloking borough is 2.5 People.
How Large is the Labor Force in Mantoloking borough?
There are 204 People in the Labor Forcein in Mantoloking borough.
What is the Percentage of People in the Labor Force in Mantoloking borough?
54.7% of People are in the Labor Force in Mantoloking borough.
What is the Unemployment Rate in Mantoloking borough?
Unemployment Rate in Mantoloking borough is 3.4%.