National Park borough, NJ Map & Demographics
National Park borough Overview
$37,065
PER CAPITA INCOME
$88,929
AVG FAMILY INCOME
$83,125
AVG HOUSEHOLD INCOME
27.3%
WAGE / INCOME GAP [ % ]
72.7¢/ $1
WAGE / INCOME GAP [ $ ]
0.41
INEQUALITY / GINI INDEX
3,028
TOTAL POPULATION
1,556
MALE POPULATION
1,472
FEMALE POPULATION
105.71
MALES / 100 FEMALES
94.60
FEMALES / 100 MALES
40.8
MEDIAN AGE
3.2
AVG FAMILY SIZE
2.9
AVG HOUSEHOLD SIZE
1,678
LABOR FORCE [ PEOPLE ]
65.7%
PERCENT IN LABOR FORCE
7.2%
UNEMPLOYMENT RATE
Income in National Park borough
Income Overview in National Park borough
Per Capita Income in National Park borough is $37,065, while median incomes of families and households are $88,929 and $83,125 respectively.
| Characteristic | Number | Measure |
| Per Capita Income | 3,028 | $37,065 |
| Median Family Income | 798 | $88,929 |
| Mean Family Income | 798 | $110,614 |
| Median Household Income | 1,049 | $83,125 |
| Mean Household Income | 1,049 | $103,370 |
| Income Deficit | 798 | $0 |
| Wage / Income Gap (%) | 3,028 | 27.26% |
| Wage / Income Gap ($) | 3,028 | 72.74¢ per $1 |
| Gini / Inequality Index | 3,028 | 0.41 |
Earnings by Sex in National Park borough
Average Earnings in National Park borough are $38,684, $45,441 for men and $33,056 for women, a difference of 27.3%.
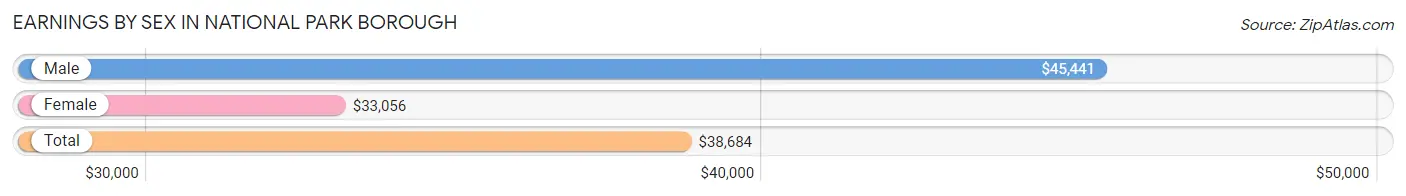
| Sex | Number | Average Earnings |
| Male | 938 (53.8%) | $45,441 |
| Female | 806 (46.2%) | $33,056 |
| Total | 1,744 (100.0%) | $38,684 |
Earnings by Sex by Income Bracket in National Park borough
The most common earnings brackets in National Park borough are $100,000+ for men (111 | 11.8%) and $75,000 to $99,999 for women (75 | 9.3%).
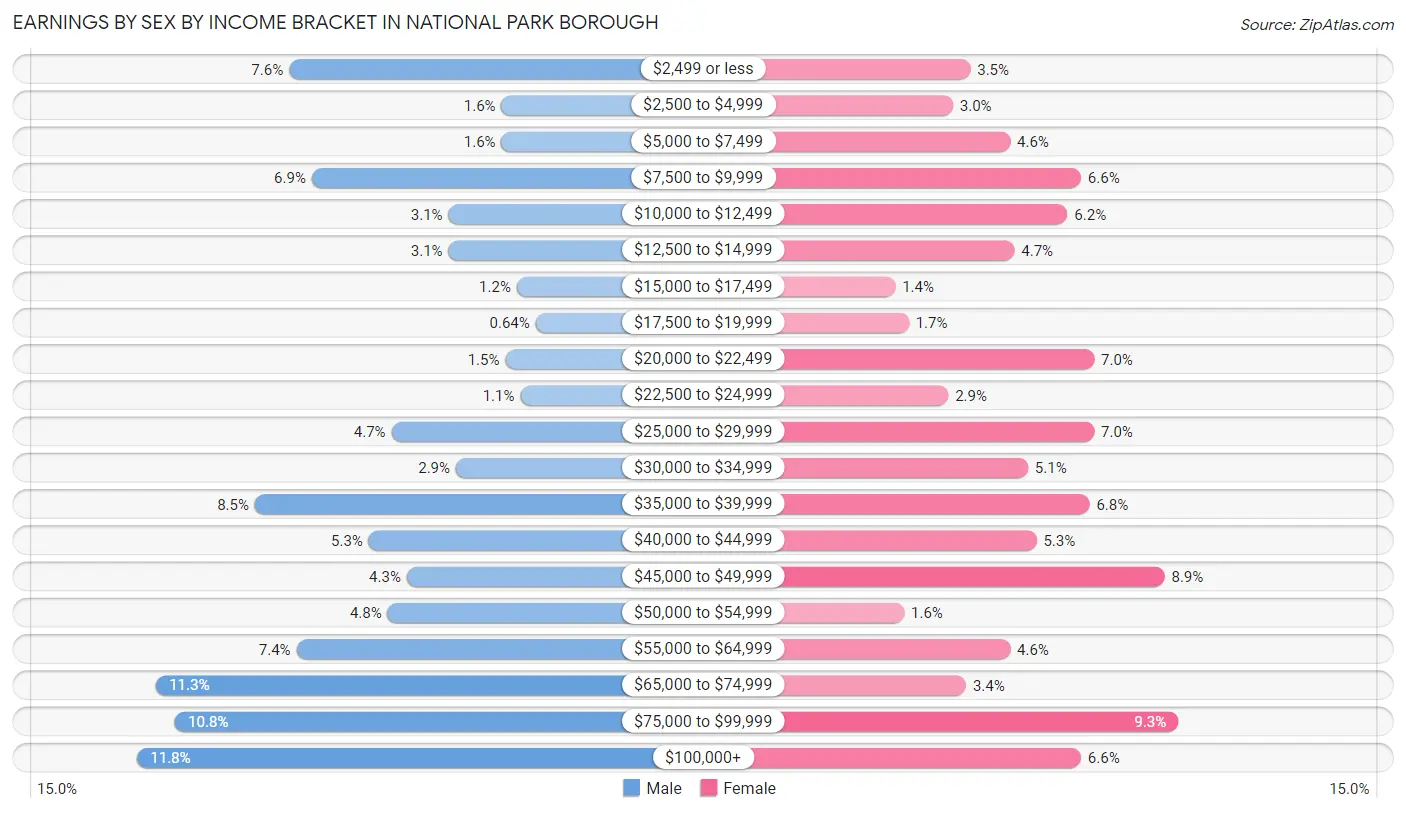
| Income | Male | Female |
| $2,499 or less | 71 (7.6%) | 28 (3.5%) |
| $2,500 to $4,999 | 15 (1.6%) | 24 (3.0%) |
| $5,000 to $7,499 | 15 (1.6%) | 37 (4.6%) |
| $7,500 to $9,999 | 65 (6.9%) | 53 (6.6%) |
| $10,000 to $12,499 | 29 (3.1%) | 50 (6.2%) |
| $12,500 to $14,999 | 29 (3.1%) | 38 (4.7%) |
| $15,000 to $17,499 | 11 (1.2%) | 11 (1.4%) |
| $17,500 to $19,999 | 6 (0.6%) | 14 (1.7%) |
| $20,000 to $22,499 | 14 (1.5%) | 56 (7.0%) |
| $22,500 to $24,999 | 10 (1.1%) | 23 (2.9%) |
| $25,000 to $29,999 | 44 (4.7%) | 56 (7.0%) |
| $30,000 to $34,999 | 27 (2.9%) | 41 (5.1%) |
| $35,000 to $39,999 | 80 (8.5%) | 55 (6.8%) |
| $40,000 to $44,999 | 50 (5.3%) | 43 (5.3%) |
| $45,000 to $49,999 | 40 (4.3%) | 72 (8.9%) |
| $50,000 to $54,999 | 45 (4.8%) | 13 (1.6%) |
| $55,000 to $64,999 | 69 (7.4%) | 37 (4.6%) |
| $65,000 to $74,999 | 106 (11.3%) | 27 (3.4%) |
| $75,000 to $99,999 | 101 (10.8%) | 75 (9.3%) |
| $100,000+ | 111 (11.8%) | 53 (6.6%) |
| Total | 938 (100.0%) | 806 (100.0%) |
Earnings by Sex by Educational Attainment in National Park borough
Average earnings in National Park borough are $51,528 for men and $36,094 for women, a difference of 29.9%. Men with an educational attainment of graduate degree enjoy the highest average annual earnings of $68,533, while those with high school diploma education earn the least with $44,712. Women with an educational attainment of bachelor's degree earn the most with the average annual earnings of $60,781, while those with less than high school education have the smallest earnings of $26,250.
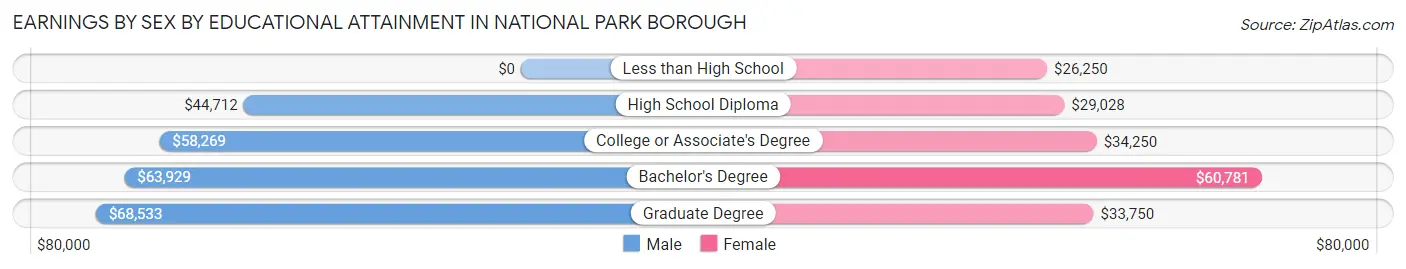
| Educational Attainment | Male Income | Female Income |
| Less than High School | - | - |
| High School Diploma | $44,712 | $29,028 |
| College or Associate's Degree | $58,269 | $34,250 |
| Bachelor's Degree | $63,929 | $60,781 |
| Graduate Degree | $68,533 | $33,750 |
| Total | $51,528 | $36,094 |
Family Income in National Park borough
Family Income Brackets in National Park borough
According to the National Park borough family income data, there are 170 families falling into the $100,000 to $149,999 income range, which is the most common income bracket and makes up 21.3% of all families.
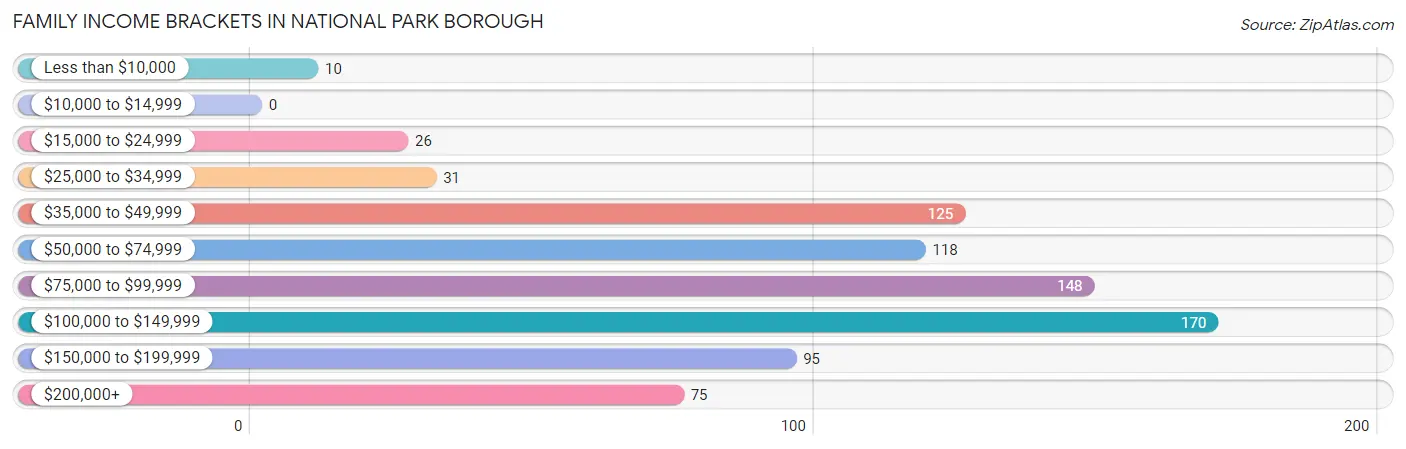
| Income Bracket | # Families | % Families |
| Less than $10,000 | 10 | 1.3% |
| $10,000 to $14,999 | 0 | 0.0% |
| $15,000 to $24,999 | 26 | 3.3% |
| $25,000 to $34,999 | 31 | 3.9% |
| $35,000 to $49,999 | 125 | 15.7% |
| $50,000 to $74,999 | 118 | 14.8% |
| $75,000 to $99,999 | 148 | 18.5% |
| $100,000 to $149,999 | 170 | 21.3% |
| $150,000 to $199,999 | 95 | 11.9% |
| $200,000+ | 75 | 9.4% |
Family Income by Famaliy Size in National Park borough
3-person families (233 | 29.2%) account for the highest median family income in National Park borough with $108,417 per family, while 2-person families (321 | 40.2%) have the highest median income of $41,016 per family member.
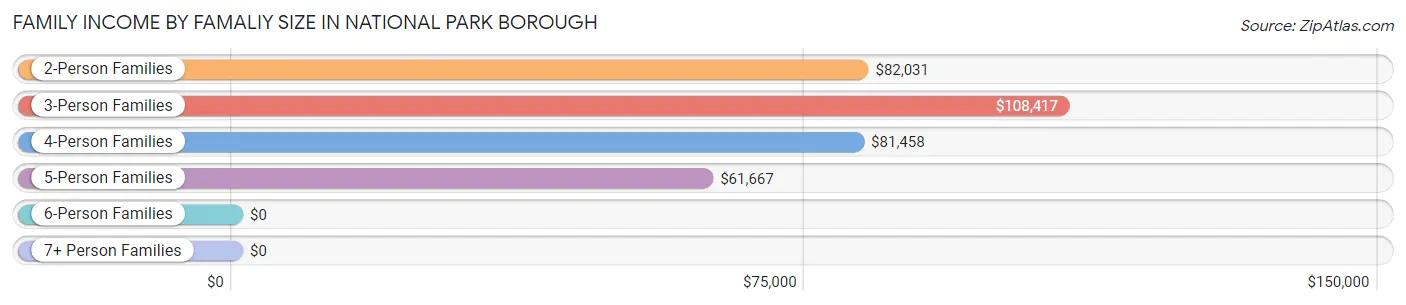
| Income Bracket | # Families | Median Income |
| 2-Person Families | 321 (40.2%) | $82,031 |
| 3-Person Families | 233 (29.2%) | $108,417 |
| 4-Person Families | 162 (20.3%) | $81,458 |
| 5-Person Families | 66 (8.3%) | $61,667 |
| 6-Person Families | 4 (0.5%) | $0 |
| 7+ Person Families | 12 (1.5%) | $0 |
| Total | 798 (100.0%) | $88,929 |
Family Income by Number of Earners in National Park borough
The median family income in National Park borough is $88,929, with families comprising 3+ earners (118) having the highest median family income of $138,594, while families with no earners (78) have the lowest median family income of $60,833, accounting for 14.8% and 9.8% of families, respectively.
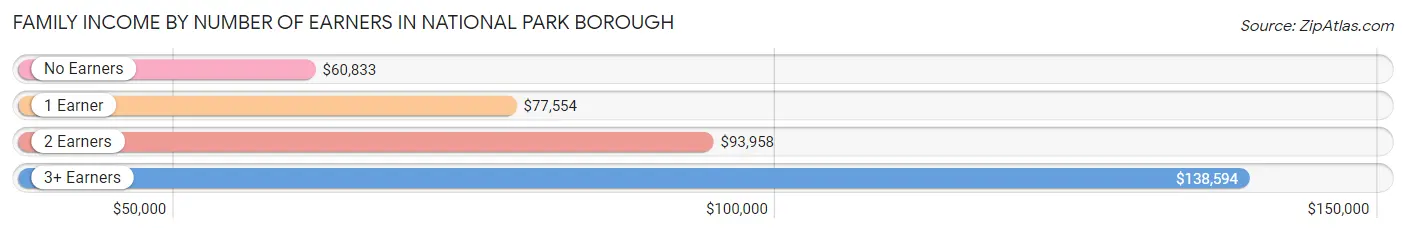
| Number of Earners | # Families | Median Income |
| No Earners | 78 (9.8%) | $60,833 |
| 1 Earner | 259 (32.5%) | $77,554 |
| 2 Earners | 343 (43.0%) | $93,958 |
| 3+ Earners | 118 (14.8%) | $138,594 |
| Total | 798 (100.0%) | $88,929 |
Household Income in National Park borough
Household Income Brackets in National Park borough
With 229 households falling in the category, the $100,000 to $149,999 income range is the most frequent in National Park borough, accounting for 21.8% of all households. In contrast, only 10 households (0.9%) fall into the less than $10,000 income bracket, making it the least populous group.
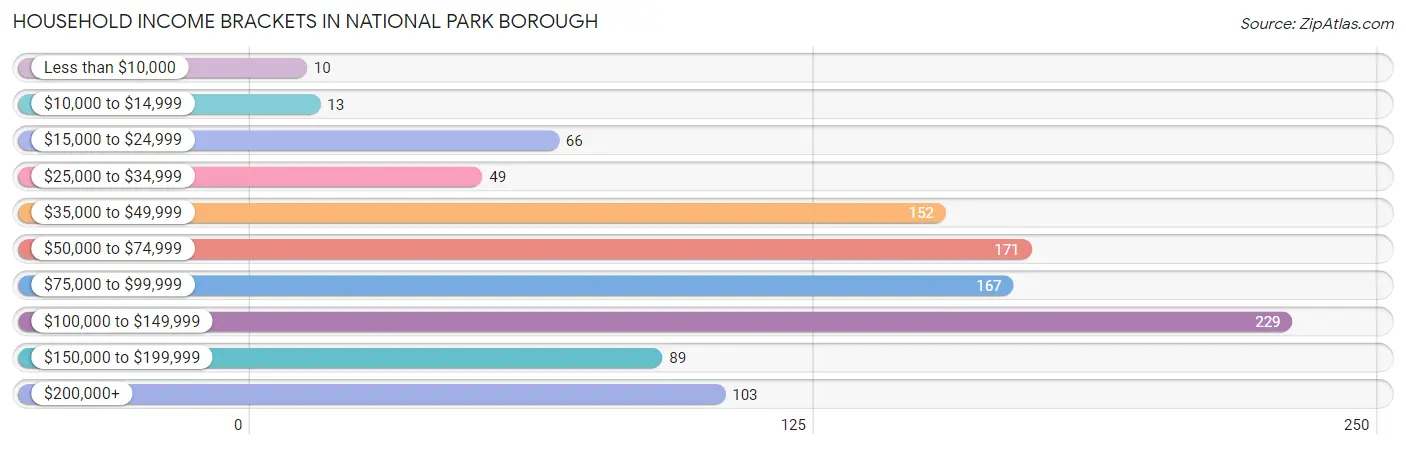
| Income Bracket | # Households | % Households |
| Less than $10,000 | 10 | 1.0% |
| $10,000 to $14,999 | 13 | 1.2% |
| $15,000 to $24,999 | 66 | 6.3% |
| $25,000 to $34,999 | 49 | 4.7% |
| $35,000 to $49,999 | 152 | 14.5% |
| $50,000 to $74,999 | 171 | 16.3% |
| $75,000 to $99,999 | 167 | 15.9% |
| $100,000 to $149,999 | 229 | 21.8% |
| $150,000 to $199,999 | 89 | 8.5% |
| $200,000+ | 103 | 9.8% |
Household Income by Householder Age in National Park borough
The median household income in National Park borough is $83,125, with the highest median household income of $94,904 found in the 25 to 44 years age bracket for the primary householder. A total of 355 households (33.8%) fall into this category. Meanwhile, the 15 to 24 years age bracket for the primary householder has the lowest median household income of $65,179, with 23 households (2.2%) in this group.
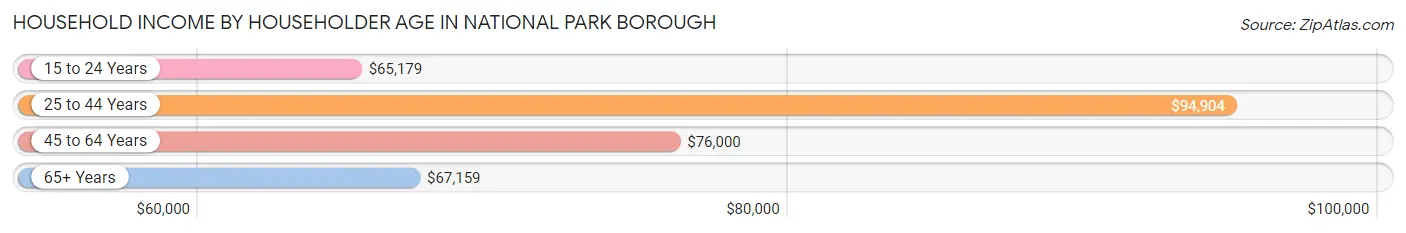
| Income Bracket | # Households | Median Income |
| 15 to 24 Years | 23 (2.2%) | $65,179 |
| 25 to 44 Years | 355 (33.8%) | $94,904 |
| 45 to 64 Years | 440 (41.9%) | $76,000 |
| 65+ Years | 231 (22.0%) | $67,159 |
| Total | 1,049 (100.0%) | $83,125 |
Poverty in National Park borough
Income Below Poverty by Sex and Age in National Park borough
With 8.4% poverty level for males and 5.9% for females among the residents of National Park borough, 12 to 14 year old males and 65 to 74 year old females are the most vulnerable to poverty, with 21 males (30.0%) and 32 females (19.8%) in their respective age groups living below the poverty level.
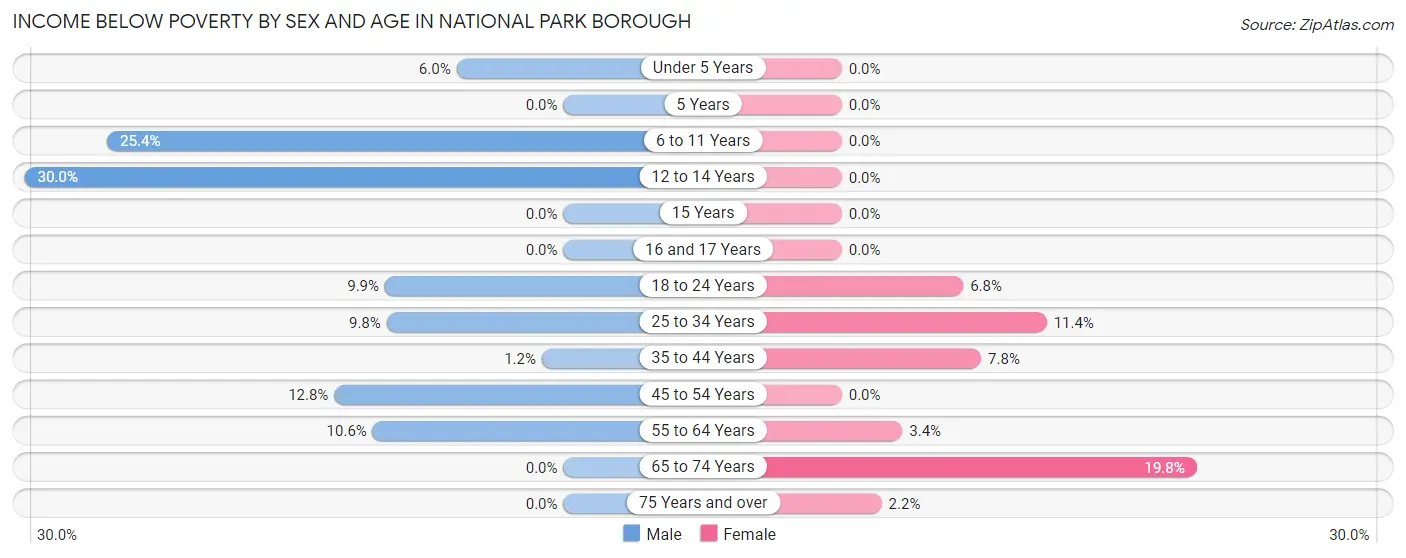
| Age Bracket | Male | Female |
| Under 5 Years | 5 (5.9%) | 0 (0.0%) |
| 5 Years | 0 (0.0%) | 0 (0.0%) |
| 6 to 11 Years | 16 (25.4%) | 0 (0.0%) |
| 12 to 14 Years | 21 (30.0%) | 0 (0.0%) |
| 15 Years | 0 (0.0%) | 0 (0.0%) |
| 16 and 17 Years | 0 (0.0%) | 0 (0.0%) |
| 18 to 24 Years | 17 (9.9%) | 10 (6.8%) |
| 25 to 34 Years | 19 (9.8%) | 17 (11.4%) |
| 35 to 44 Years | 3 (1.2%) | 19 (7.8%) |
| 45 to 54 Years | 25 (12.8%) | 0 (0.0%) |
| 55 to 64 Years | 24 (10.6%) | 7 (3.4%) |
| 65 to 74 Years | 0 (0.0%) | 32 (19.8%) |
| 75 Years and over | 0 (0.0%) | 2 (2.2%) |
| Total | 130 (8.4%) | 87 (5.9%) |
Income Above Poverty by Sex and Age in National Park borough
According to the poverty statistics in National Park borough, males aged 5 years and females aged under 5 years are the age groups that are most secure financially, with 100.0% of males and 100.0% of females in these age groups living above the poverty line.
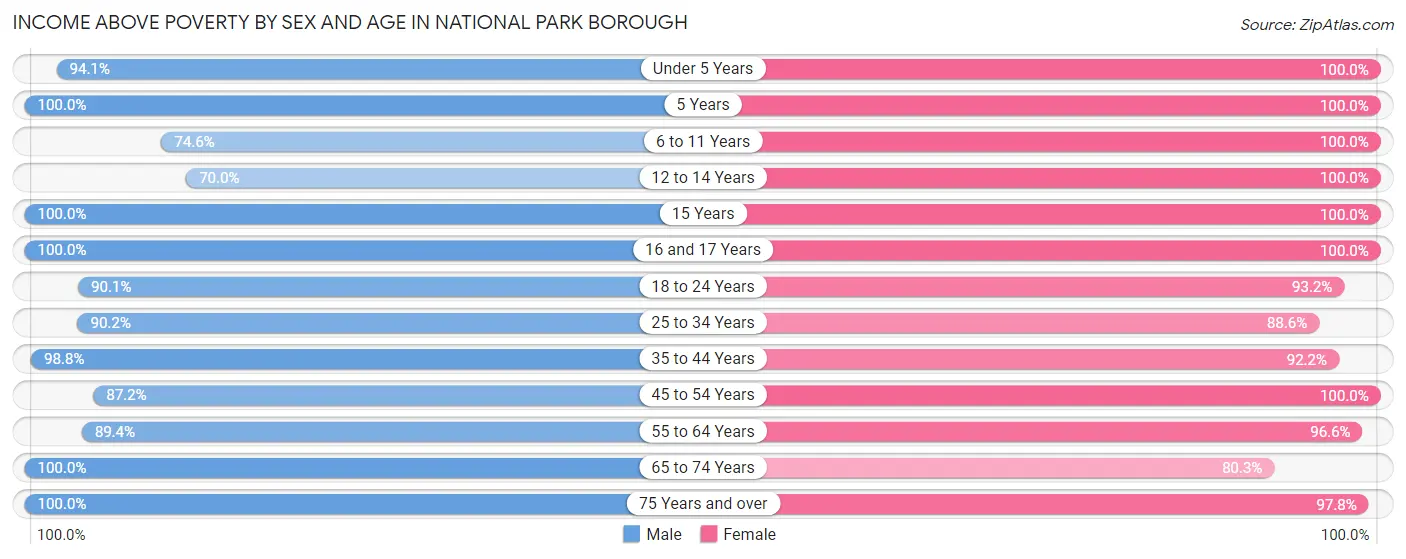
| Age Bracket | Male | Female |
| Under 5 Years | 79 (94.1%) | 43 (100.0%) |
| 5 Years | 29 (100.0%) | 15 (100.0%) |
| 6 to 11 Years | 47 (74.6%) | 51 (100.0%) |
| 12 to 14 Years | 49 (70.0%) | 69 (100.0%) |
| 15 Years | 27 (100.0%) | 14 (100.0%) |
| 16 and 17 Years | 55 (100.0%) | 65 (100.0%) |
| 18 to 24 Years | 154 (90.1%) | 138 (93.2%) |
| 25 to 34 Years | 174 (90.2%) | 132 (88.6%) |
| 35 to 44 Years | 247 (98.8%) | 226 (92.2%) |
| 45 to 54 Years | 171 (87.2%) | 204 (100.0%) |
| 55 to 64 Years | 202 (89.4%) | 201 (96.6%) |
| 65 to 74 Years | 121 (100.0%) | 130 (80.2%) |
| 75 Years and over | 71 (100.0%) | 88 (97.8%) |
| Total | 1,426 (91.6%) | 1,376 (94.1%) |
Income Below Poverty Among Married-Couple Families in National Park borough
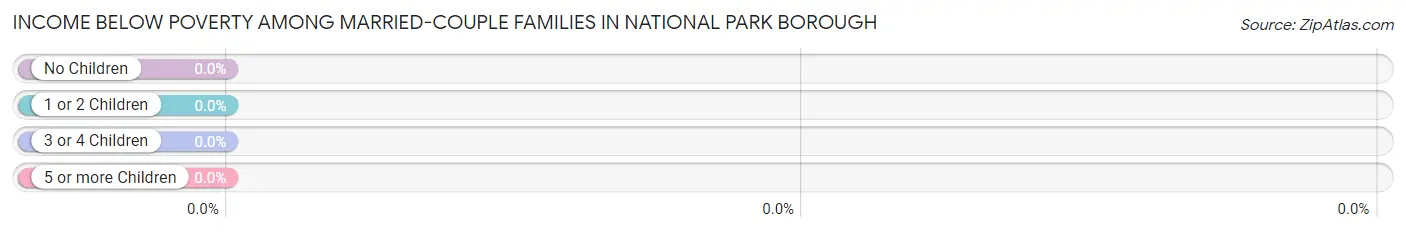
| Children | Above Poverty | Below Poverty |
| No Children | 336 (100.0%) | 0 (0.0%) |
| 1 or 2 Children | 169 (100.0%) | 0 (0.0%) |
| 3 or 4 Children | 47 (100.0%) | 0 (0.0%) |
| 5 or more Children | 0 (0.0%) | 0 (0.0%) |
| Total | 552 (100.0%) | 0 (0.0%) |
Income Below Poverty Among Single-Parent Households in National Park borough
According to the poverty data in National Park borough, 10.0% or 6 single-father households and 14.0% or 26 single-mother households are living below the poverty line. Among single-father households, those with no children have the highest poverty rate, with 6 households (17.6%) experiencing poverty. Likewise, among single-mother households, those with 3 or 4 children have the highest poverty rate, with 9 households (100.0%) falling below the poverty line.
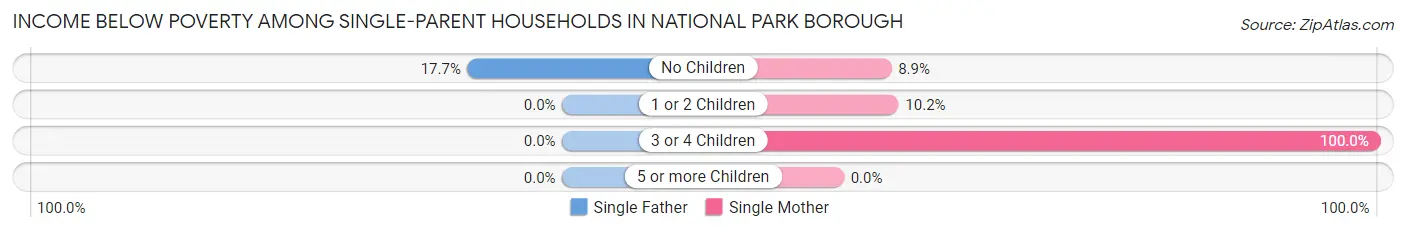
| Children | Single Father | Single Mother |
| No Children | 6 (17.6%) | 7 (8.9%) |
| 1 or 2 Children | 0 (0.0%) | 10 (10.2%) |
| 3 or 4 Children | 0 (0.0%) | 9 (100.0%) |
| 5 or more Children | 0 (0.0%) | 0 (0.0%) |
| Total | 6 (10.0%) | 26 (14.0%) |
Income Below Poverty Among Married-Couple vs Single-Parent Households in National Park borough
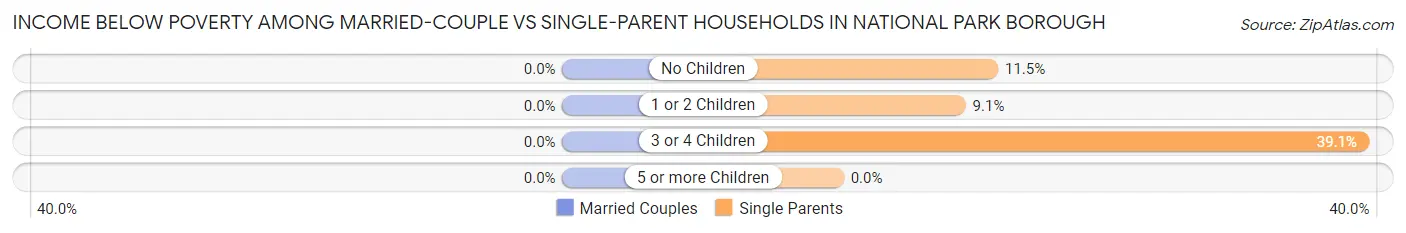
| Children | Married-Couple Families | Single-Parent Households |
| No Children | 0 (0.0%) | 13 (11.5%) |
| 1 or 2 Children | 0 (0.0%) | 10 (9.1%) |
| 3 or 4 Children | 0 (0.0%) | 9 (39.1%) |
| 5 or more Children | 0 (0.0%) | 0 (0.0%) |
| Total | 0 (0.0%) | 32 (13.0%) |
Race in National Park borough
The most populous races in National Park borough are White / Caucasian (2,738 | 90.4%), Hispanic or Latino (175 | 5.8%), and Two or more Races (144 | 4.8%).
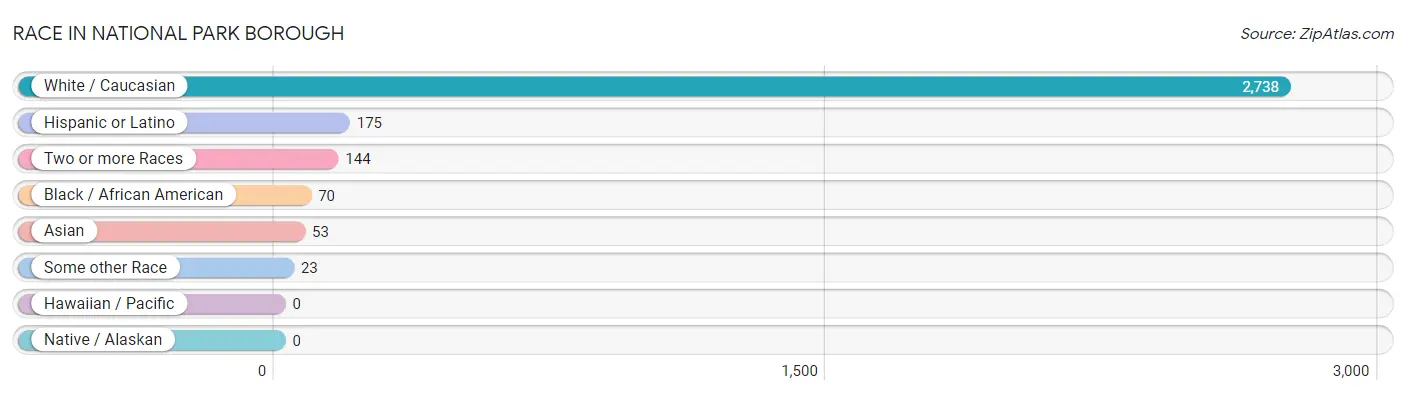
| Race | # Population | % Population |
| Asian | 53 | 1.8% |
| Black / African American | 70 | 2.3% |
| Hawaiian / Pacific | 0 | 0.0% |
| Hispanic or Latino | 175 | 5.8% |
| Native / Alaskan | 0 | 0.0% |
| White / Caucasian | 2,738 | 90.4% |
| Two or more Races | 144 | 4.8% |
| Some other Race | 23 | 0.8% |
| Total | 3,028 | 100.0% |
Ancestry in National Park borough
The most populous ancestries reported in National Park borough are Irish (1,124 | 37.1%), Italian (541 | 17.9%), German (465 | 15.4%), English (437 | 14.4%), and Polish (156 | 5.1%), together accounting for 89.9% of all National Park borough residents.
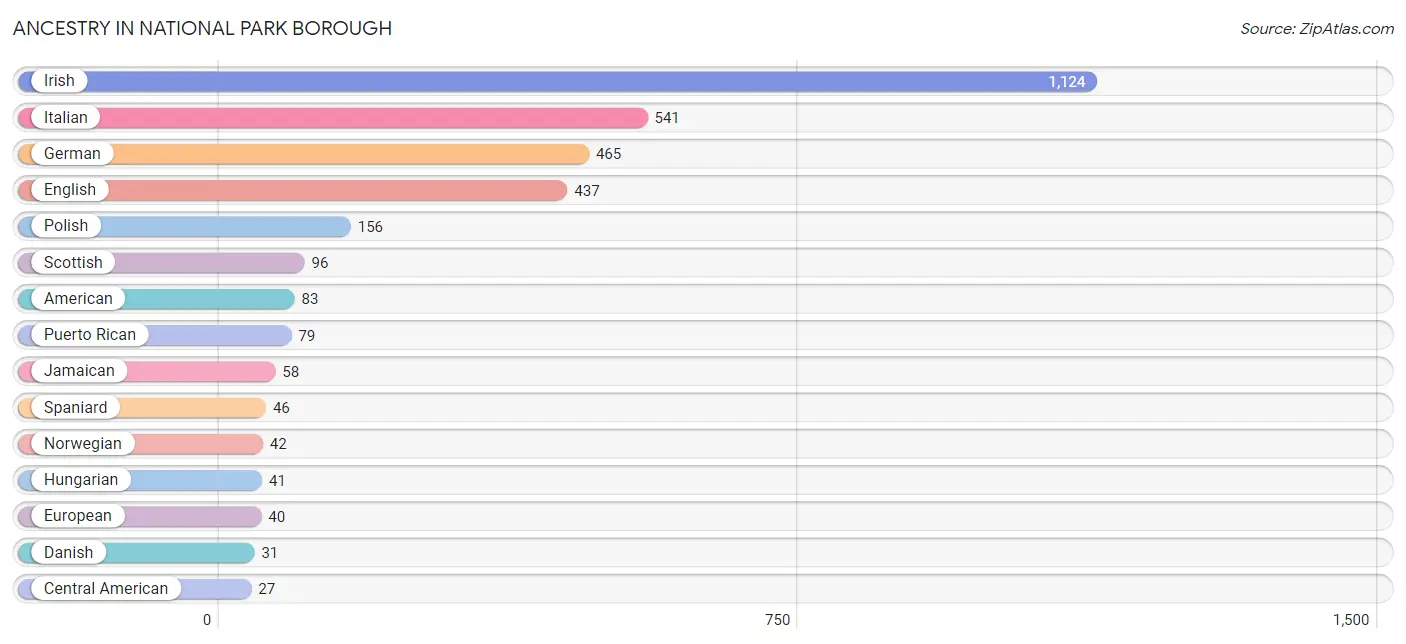
| Ancestry | # Population | % Population |
| American | 83 | 2.7% |
| Bhutanese | 16 | 0.5% |
| British | 10 | 0.3% |
| Burmese | 12 | 0.4% |
| Central American | 27 | 0.9% |
| Cuban | 15 | 0.5% |
| Danish | 31 | 1.0% |
| Dutch | 12 | 0.4% |
| Eastern European | 4 | 0.1% |
| English | 437 | 14.4% |
| European | 40 | 1.3% |
| French | 11 | 0.4% |
| French Canadian | 23 | 0.8% |
| German | 465 | 15.4% |
| Guatemalan | 14 | 0.5% |
| Hungarian | 41 | 1.3% |
| Irish | 1,124 | 37.1% |
| Italian | 541 | 17.9% |
| Jamaican | 58 | 1.9% |
| Lithuanian | 8 | 0.3% |
| Mexican | 8 | 0.3% |
| Navajo | 5 | 0.2% |
| Norwegian | 42 | 1.4% |
| Polish | 156 | 5.1% |
| Portuguese | 8 | 0.3% |
| Puerto Rican | 79 | 2.6% |
| Russian | 23 | 0.8% |
| Salvadoran | 13 | 0.4% |
| Scotch-Irish | 8 | 0.3% |
| Scottish | 96 | 3.2% |
| Slavic | 5 | 0.2% |
| Spaniard | 46 | 1.5% |
| Sri Lankan | 21 | 0.7% |
| Swiss | 22 | 0.7% |
| Thai | 9 | 0.3% |
| Ukrainian | 6 | 0.2% |
| Welsh | 2 | 0.1% | View All 37 Rows |
Immigrants in National Park borough
The most numerous immigrant groups reported in National Park borough came from Europe (36 | 1.2%), Asia (30 | 1.0%), Latin America (21 | 0.7%), Eastern Europe (16 | 0.5%), and Hungary (16 | 0.5%), together accounting for 3.9% of all National Park borough residents.
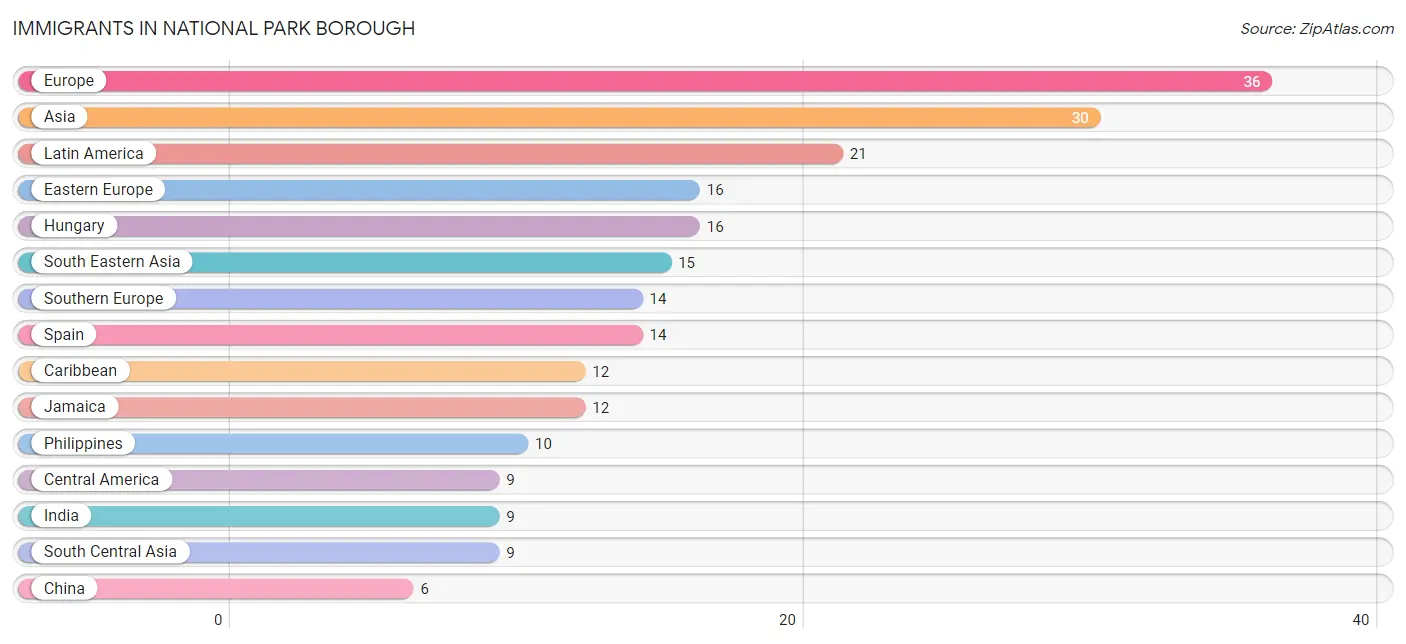
| Immigration Origin | # Population | % Population |
| Asia | 30 | 1.0% |
| Caribbean | 12 | 0.4% |
| Central America | 9 | 0.3% |
| China | 6 | 0.2% |
| Eastern Asia | 6 | 0.2% |
| Eastern Europe | 16 | 0.5% |
| Europe | 36 | 1.2% |
| Guatemala | 4 | 0.1% |
| Hong Kong | 6 | 0.2% |
| Hungary | 16 | 0.5% |
| India | 9 | 0.3% |
| Jamaica | 12 | 0.4% |
| Latin America | 21 | 0.7% |
| Mexico | 5 | 0.2% |
| Northern Europe | 6 | 0.2% |
| Philippines | 10 | 0.3% |
| South Central Asia | 9 | 0.3% |
| South Eastern Asia | 15 | 0.5% |
| Southern Europe | 14 | 0.5% |
| Spain | 14 | 0.5% |
| Vietnam | 5 | 0.2% | View All 21 Rows |
Sex and Age in National Park borough
Sex and Age in National Park borough
The most populous age groups in National Park borough are 15 to 19 Years (145 | 9.3%) for men and 40 to 44 Years (151 | 10.3%) for women.
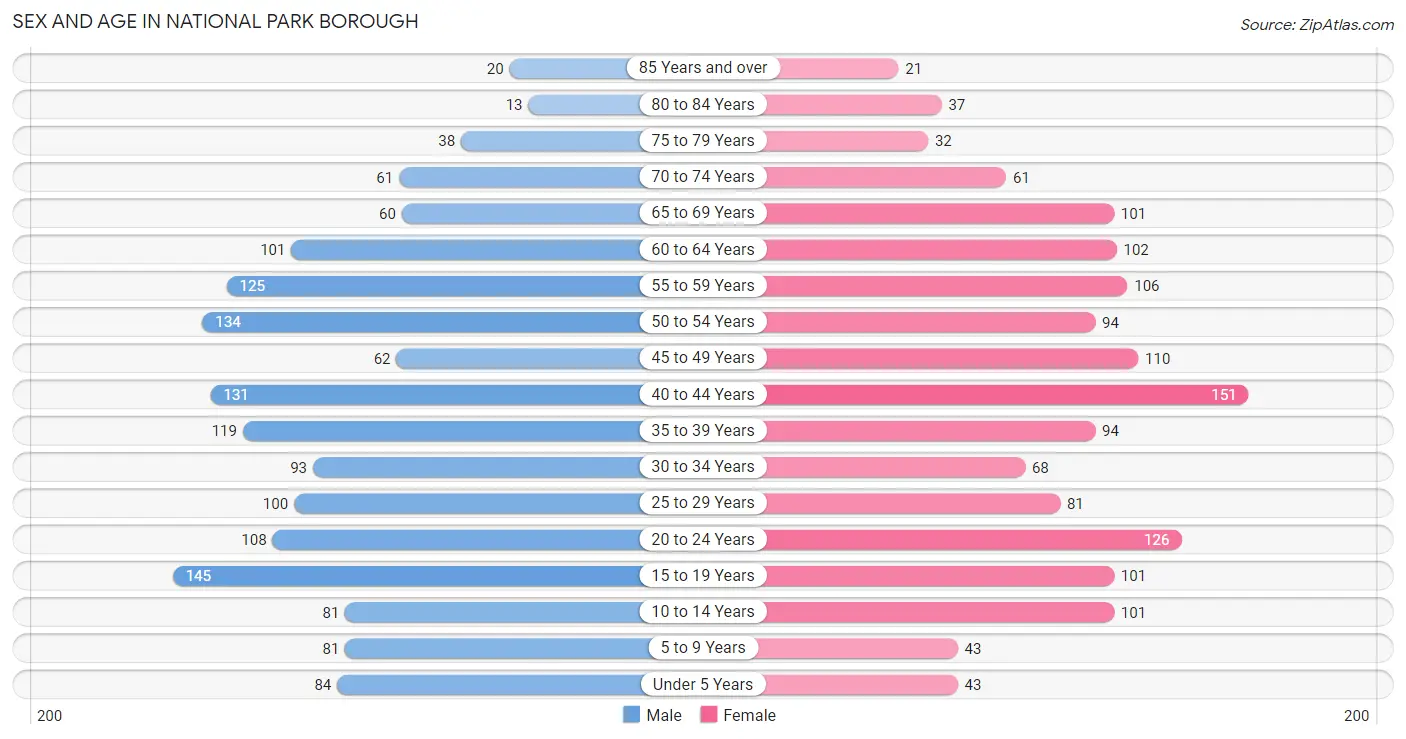
| Age Bracket | Male | Female |
| Under 5 Years | 84 (5.4%) | 43 (2.9%) |
| 5 to 9 Years | 81 (5.2%) | 43 (2.9%) |
| 10 to 14 Years | 81 (5.2%) | 101 (6.9%) |
| 15 to 19 Years | 145 (9.3%) | 101 (6.9%) |
| 20 to 24 Years | 108 (6.9%) | 126 (8.6%) |
| 25 to 29 Years | 100 (6.4%) | 81 (5.5%) |
| 30 to 34 Years | 93 (6.0%) | 68 (4.6%) |
| 35 to 39 Years | 119 (7.6%) | 94 (6.4%) |
| 40 to 44 Years | 131 (8.4%) | 151 (10.3%) |
| 45 to 49 Years | 62 (4.0%) | 110 (7.5%) |
| 50 to 54 Years | 134 (8.6%) | 94 (6.4%) |
| 55 to 59 Years | 125 (8.0%) | 106 (7.2%) |
| 60 to 64 Years | 101 (6.5%) | 102 (6.9%) |
| 65 to 69 Years | 60 (3.9%) | 101 (6.9%) |
| 70 to 74 Years | 61 (3.9%) | 61 (4.1%) |
| 75 to 79 Years | 38 (2.4%) | 32 (2.2%) |
| 80 to 84 Years | 13 (0.8%) | 37 (2.5%) |
| 85 Years and over | 20 (1.3%) | 21 (1.4%) |
| Total | 1,556 (100.0%) | 1,472 (100.0%) |
Families and Households in National Park borough
Median Family Size in National Park borough
The median family size in National Park borough is 3.17 persons per family, with married-couple families (552 | 69.2%) accounting for the largest median family size of 3.3 persons per family. On the other hand, single male/father families (60 | 7.5%) represent the smallest median family size with 2.28 persons per family.
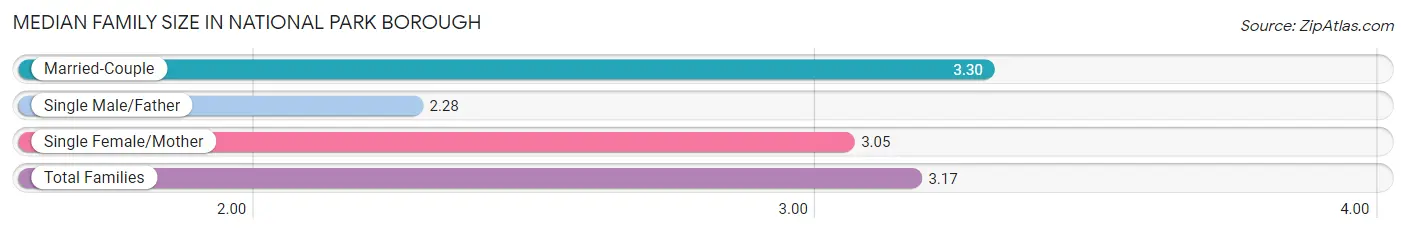
| Family Type | # Families | Family Size |
| Married-Couple | 552 (69.2%) | 3.30 |
| Single Male/Father | 60 (7.5%) | 2.28 |
| Single Female/Mother | 186 (23.3%) | 3.05 |
| Total Families | 798 (100.0%) | 3.17 |
Median Household Size in National Park borough
The median household size in National Park borough is 2.87 persons per household, with single female/mother households (186 | 17.7%) accounting for the largest median household size of 3.46 persons per household. non-family households (251 | 23.9%) represent the smallest median household size with 1.37 persons per household.
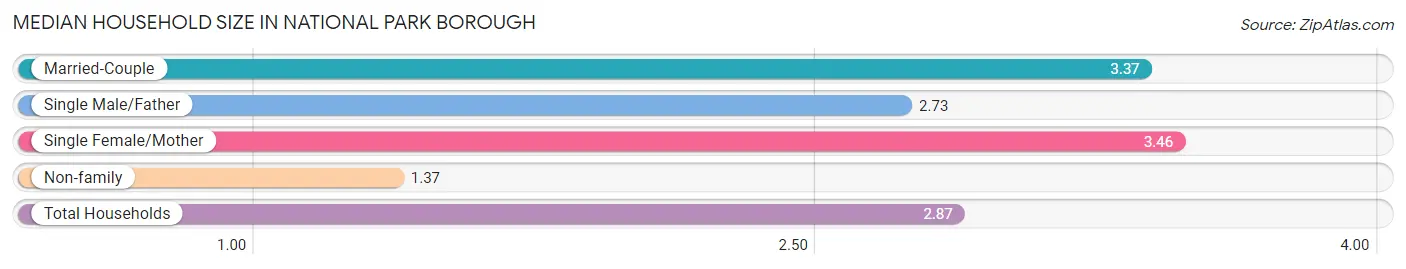
| Household Type | # Households | Household Size |
| Married-Couple | 552 (52.6%) | 3.37 |
| Single Male/Father | 60 (5.7%) | 2.73 |
| Single Female/Mother | 186 (17.7%) | 3.46 |
| Non-family | 251 (23.9%) | 1.37 |
| Total Households | 1,049 (100.0%) | 2.87 |
Household Size by Marriage Status in National Park borough
Out of a total of 1,049 households in National Park borough, 798 (76.1%) are family households, while 251 (23.9%) are nonfamily households. The most numerous type of family households are 2-person households, comprising 284, and the most common type of nonfamily households are 1-person households, comprising 189.
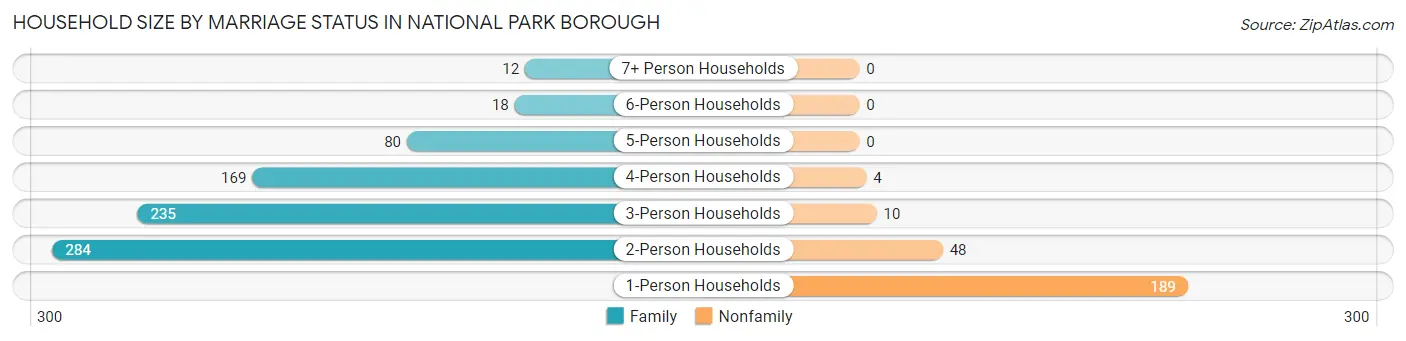
| Household Size | Family Households | Nonfamily Households |
| 1-Person Households | - | 189 (18.0%) |
| 2-Person Households | 284 (27.1%) | 48 (4.6%) |
| 3-Person Households | 235 (22.4%) | 10 (0.9%) |
| 4-Person Households | 169 (16.1%) | 4 (0.4%) |
| 5-Person Households | 80 (7.6%) | 0 (0.0%) |
| 6-Person Households | 18 (1.7%) | 0 (0.0%) |
| 7+ Person Households | 12 (1.1%) | 0 (0.0%) |
| Total | 798 (76.1%) | 251 (23.9%) |
Female Fertility in National Park borough
Fertility by Age in National Park borough
Average fertility rate in National Park borough is 28.0 births per 1,000 women. Women in the age bracket of 20 to 34 years have the highest fertility rate with 76.0 births per 1,000 women. Women in the age bracket of 20 to 34 years acount for 100.0% of all women with births.
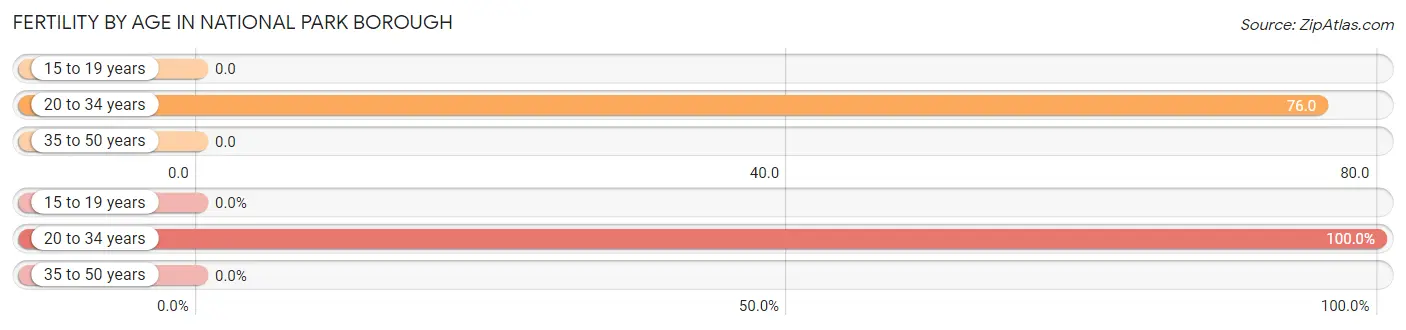
| Age Bracket | Women with Births | Births / 1,000 Women |
| 15 to 19 years | 0 (0.0%) | 0.0 |
| 20 to 34 years | 21 (100.0%) | 76.0 |
| 35 to 50 years | 0 (0.0%) | 0.0 |
| Total | 21 (100.0%) | 28.0 |
Fertility by Age by Marriage Status in National Park borough
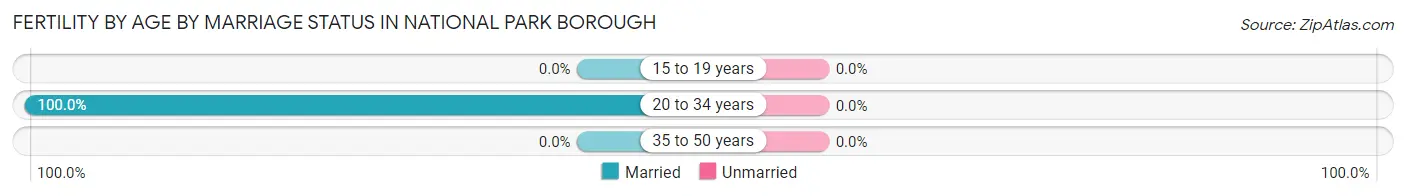
| Age Bracket | Married | Unmarried |
| 15 to 19 years | 0 (0.0%) | 0 (0.0%) |
| 20 to 34 years | 21 (100.0%) | 0 (0.0%) |
| 35 to 50 years | 0 (0.0%) | 0 (0.0%) |
| Total | 21 (100.0%) | 0 (0.0%) |
Fertility by Education in National Park borough
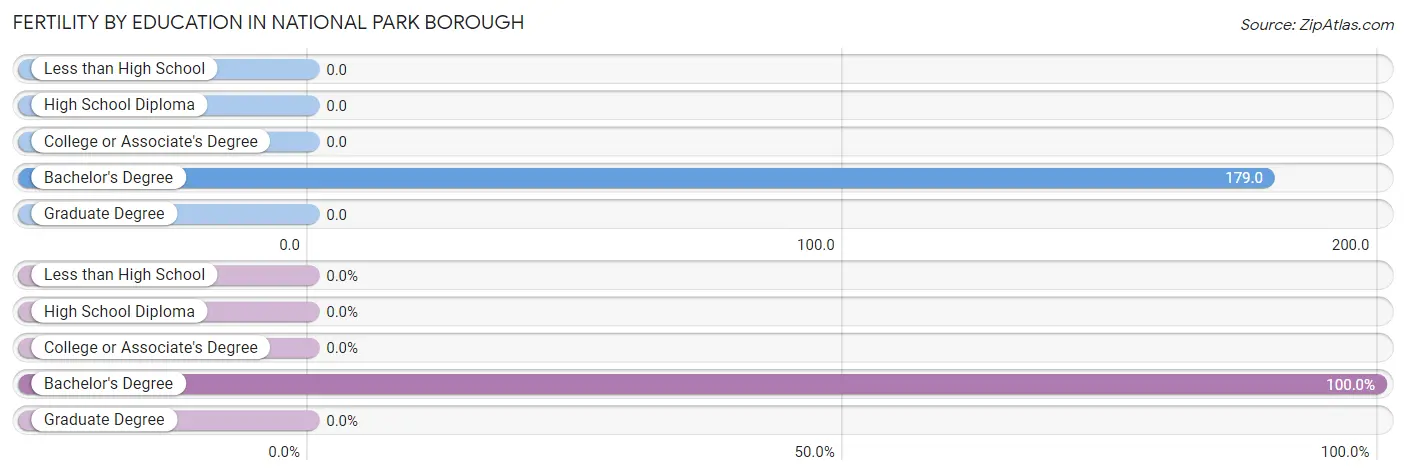
| Educational Attainment | Women with Births | Births / 1,000 Women |
| Less than High School | 0 (0.0%) | 0.0 |
| High School Diploma | 0 (0.0%) | 0.0 |
| College or Associate's Degree | 0 (0.0%) | 0.0 |
| Bachelor's Degree | 21 (100.0%) | 179.0 |
| Graduate Degree | 0 (0.0%) | 0.0 |
| Total | 21 (100.0%) | 28.0 |
Fertility by Education by Marriage Status in National Park borough
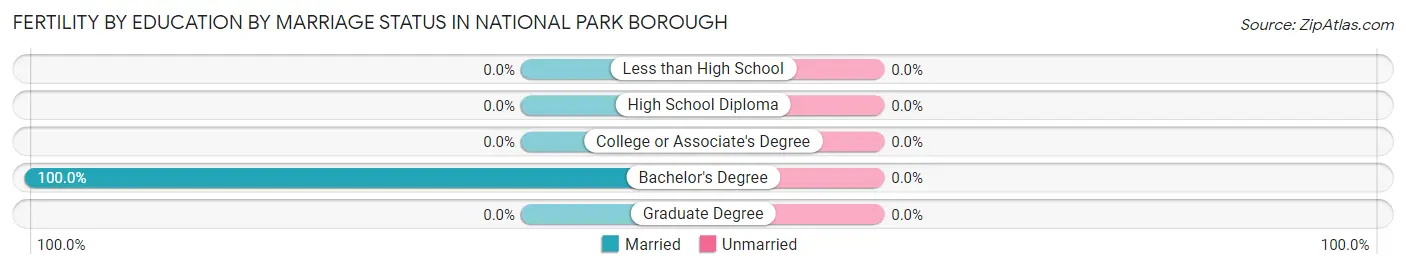
| Educational Attainment | Married | Unmarried |
| Less than High School | 0 (0.0%) | 0 (0.0%) |
| High School Diploma | 0 (0.0%) | 0 (0.0%) |
| College or Associate's Degree | 0 (0.0%) | 0 (0.0%) |
| Bachelor's Degree | 21 (100.0%) | 0 (0.0%) |
| Graduate Degree | 0 (0.0%) | 0 (0.0%) |
| Total | 21 (100.0%) | 0 (0.0%) |
Employment Characteristics in National Park borough
Employment by Class of Employer in National Park borough
Among the 1,523 employed individuals in National Park borough, private company employees (1,063 | 69.8%), local government employees (178 | 11.7%), and not-for-profit organizations (101 | 6.6%) make up the most common classes of employment.
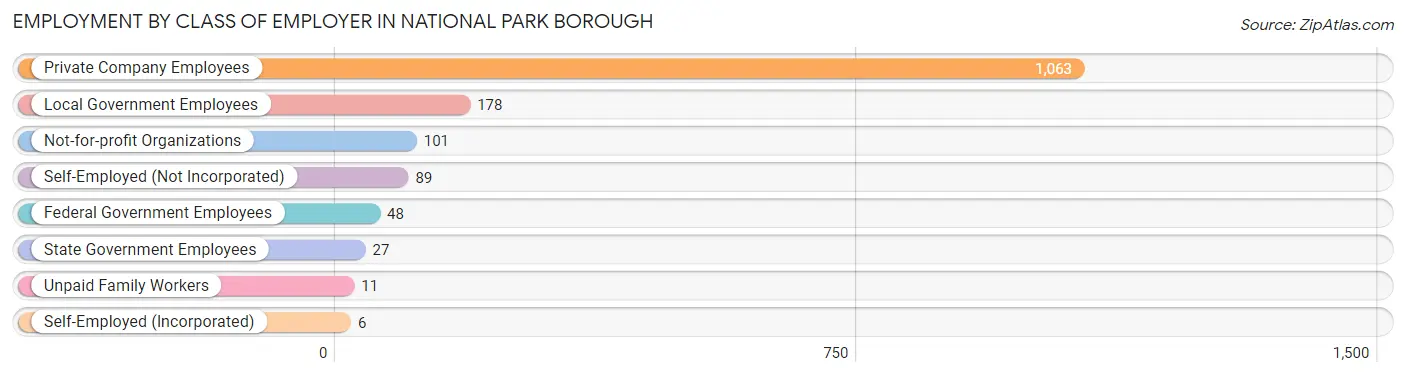
| Employer Class | # Employees | % Employees |
| Private Company Employees | 1,063 | 69.8% |
| Self-Employed (Incorporated) | 6 | 0.4% |
| Self-Employed (Not Incorporated) | 89 | 5.8% |
| Not-for-profit Organizations | 101 | 6.6% |
| Local Government Employees | 178 | 11.7% |
| State Government Employees | 27 | 1.8% |
| Federal Government Employees | 48 | 3.2% |
| Unpaid Family Workers | 11 | 0.7% |
| Total | 1,523 | 100.0% |
Employment Status by Age in National Park borough
According to the labor force statistics for National Park borough, out of the total population over 16 years of age (2,554), 65.7% or 1,678 individuals are in the labor force, with 7.2% or 121 of them unemployed. The age group with the highest labor force participation rate is 45 to 54 years, with 90.5% or 362 individuals in the labor force. Within the labor force, the 20 to 24 years age range has the highest percentage of unemployed individuals, with 20.3% or 25 of them being unemployed.
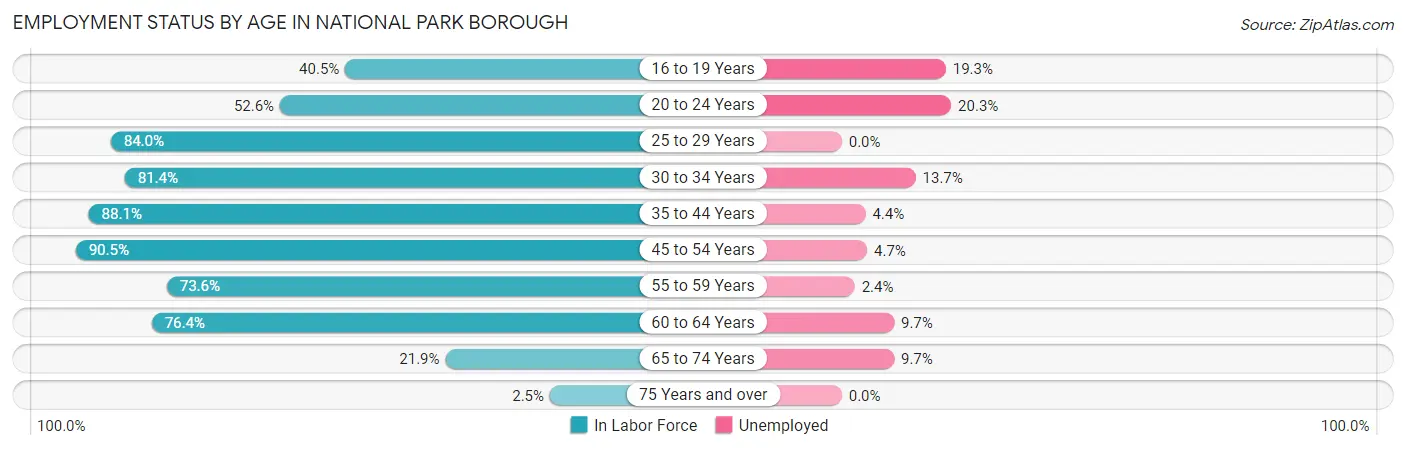
| Age Bracket | In Labor Force | Unemployed |
| 16 to 19 Years | 83 (40.5%) | 16 (19.3%) |
| 20 to 24 Years | 123 (52.6%) | 25 (20.3%) |
| 25 to 29 Years | 152 (84.0%) | 0 (0.0%) |
| 30 to 34 Years | 131 (81.4%) | 18 (13.7%) |
| 35 to 44 Years | 436 (88.1%) | 19 (4.4%) |
| 45 to 54 Years | 362 (90.5%) | 17 (4.7%) |
| 55 to 59 Years | 170 (73.6%) | 4 (2.4%) |
| 60 to 64 Years | 155 (76.4%) | 15 (9.7%) |
| 65 to 74 Years | 62 (21.9%) | 6 (9.7%) |
| 75 Years and over | 4 (2.5%) | 0 (0.0%) |
| Total | 1,678 (65.7%) | 121 (7.2%) |
Employment Status by Educational Attainment in National Park borough
According to labor force statistics for National Park borough, 84.1% of individuals (1,405) out of the total population between 25 and 64 years of age (1,671) are in the labor force, with 5.2% or 73 of them being unemployed. The group with the highest labor force participation rate are those with the educational attainment of high school diploma, with 89.2% or 581 individuals in the labor force. Within the labor force, individuals with high school diploma education have the highest percentage of unemployment, with 7.1% or 41 of them being unemployed.
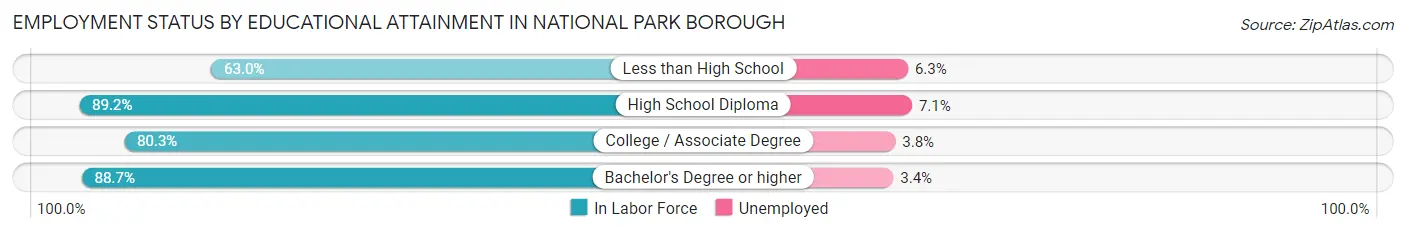
| Educational Attainment | In Labor Force | Unemployed |
| Less than High School | 80 (63.0%) | 8 (6.3%) |
| High School Diploma | 581 (89.2%) | 46 (7.1%) |
| College / Associate Degree | 447 (80.3%) | 21 (3.8%) |
| Bachelor's Degree or higher | 298 (88.7%) | 11 (3.4%) |
| Total | 1,405 (84.1%) | 87 (5.2%) |
Employment Occupations by Sex in National Park borough
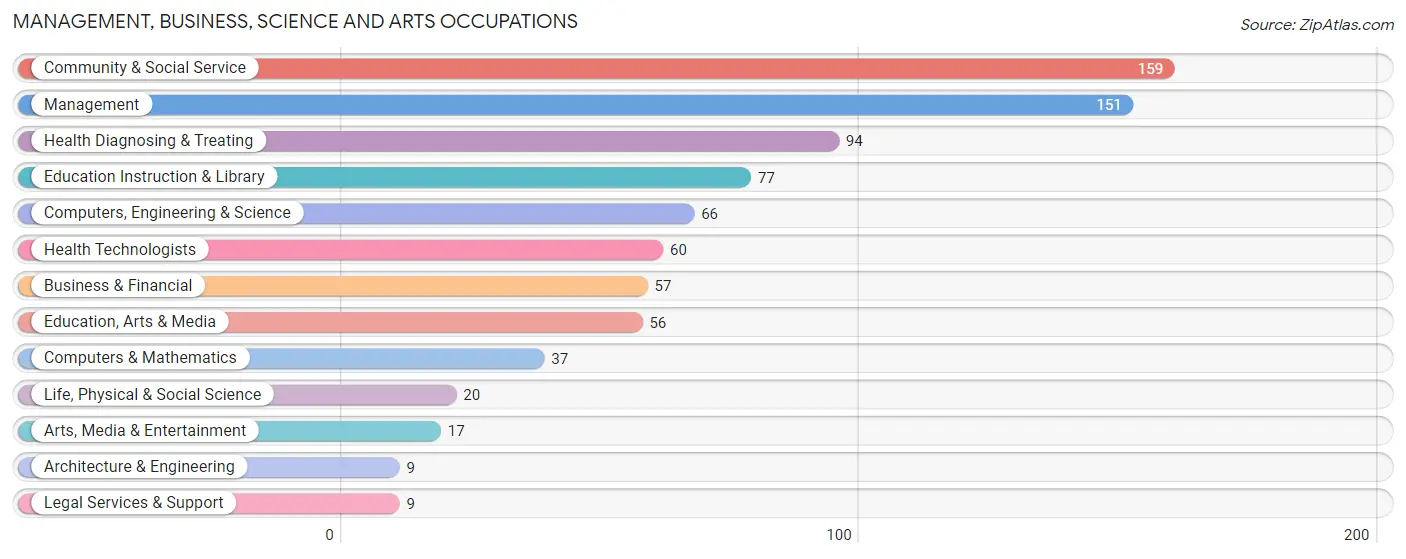
Management, Business, Science and Arts Occupations
The most common Management, Business, Science and Arts occupations in National Park borough are Community & Social Service (159 | 10.2%), Management (151 | 9.7%), Health Diagnosing & Treating (94 | 6.0%), Education Instruction & Library (77 | 5.0%), and Computers, Engineering & Science (66 | 4.3%).
Management, Business, Science and Arts Occupations by Sex
Within the Management, Business, Science and Arts occupations in National Park borough, the most male-oriented occupations are Architecture & Engineering (100.0%), Management (66.2%), and Life, Physical & Social Science (55.0%), while the most female-oriented occupations are Legal Services & Support (100.0%), Arts, Media & Entertainment (100.0%), and Education Instruction & Library (88.3%).
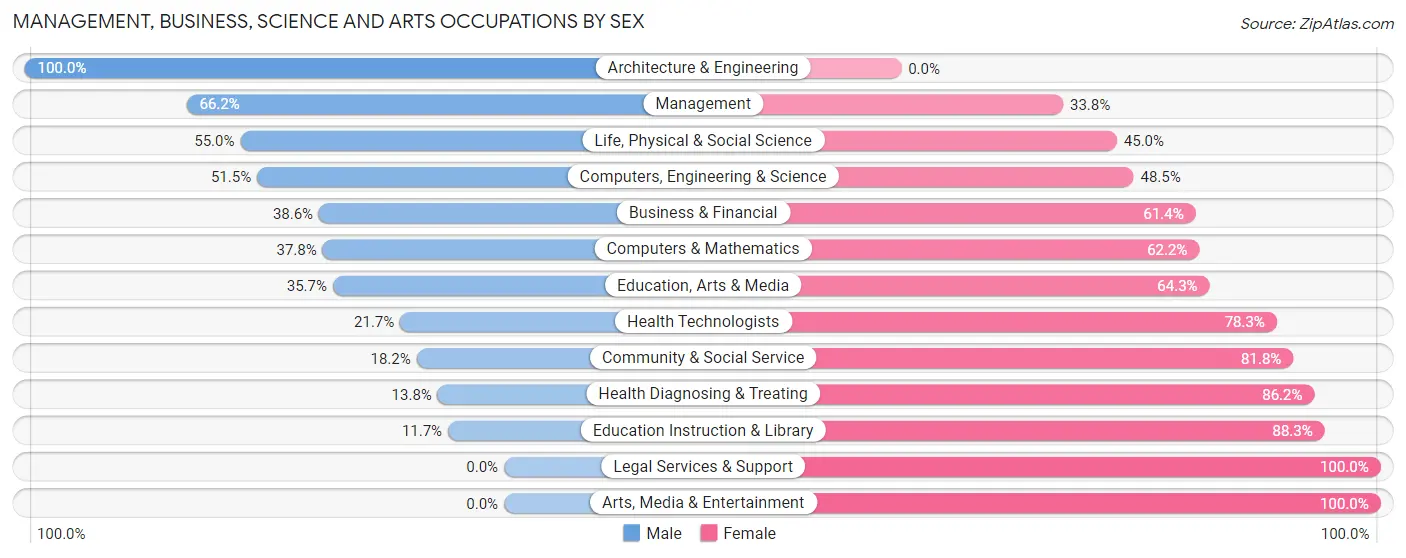
| Occupation | Male | Female |
| Management | 100 (66.2%) | 51 (33.8%) |
| Business & Financial | 22 (38.6%) | 35 (61.4%) |
| Computers, Engineering & Science | 34 (51.5%) | 32 (48.5%) |
| Computers & Mathematics | 14 (37.8%) | 23 (62.2%) |
| Architecture & Engineering | 9 (100.0%) | 0 (0.0%) |
| Life, Physical & Social Science | 11 (55.0%) | 9 (45.0%) |
| Community & Social Service | 29 (18.2%) | 130 (81.8%) |
| Education, Arts & Media | 20 (35.7%) | 36 (64.3%) |
| Legal Services & Support | 0 (0.0%) | 9 (100.0%) |
| Education Instruction & Library | 9 (11.7%) | 68 (88.3%) |
| Arts, Media & Entertainment | 0 (0.0%) | 17 (100.0%) |
| Health Diagnosing & Treating | 13 (13.8%) | 81 (86.2%) |
| Health Technologists | 13 (21.7%) | 47 (78.3%) |
| Total (Category) | 198 (37.6%) | 329 (62.4%) |
| Total (Overall) | 804 (51.7%) | 750 (48.3%) |
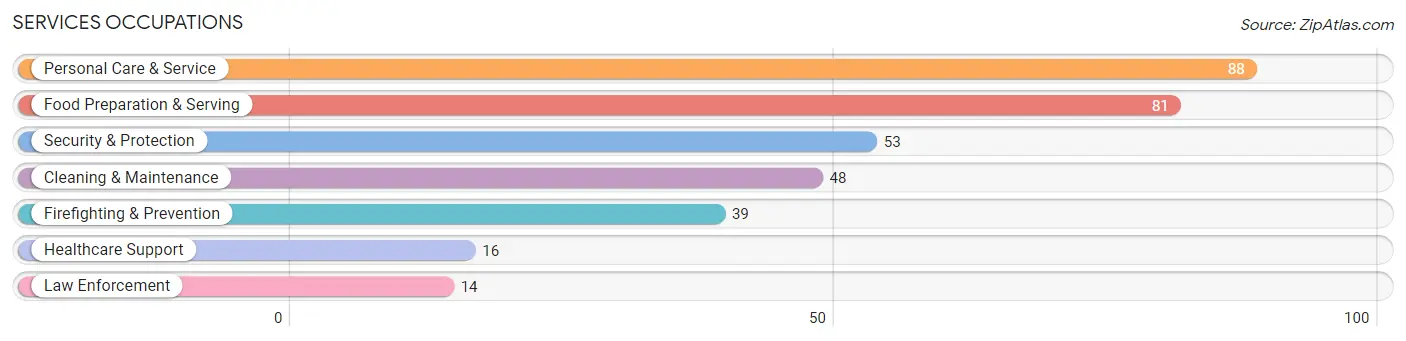
Services Occupations
The most common Services occupations in National Park borough are Personal Care & Service (88 | 5.7%), Food Preparation & Serving (81 | 5.2%), Security & Protection (53 | 3.4%), Cleaning & Maintenance (48 | 3.1%), and Firefighting & Prevention (39 | 2.5%).
Services Occupations by Sex
Within the Services occupations in National Park borough, the most male-oriented occupations are Security & Protection (100.0%), Firefighting & Prevention (100.0%), and Law Enforcement (100.0%), while the most female-oriented occupations are Personal Care & Service (81.8%), Food Preparation & Serving (79.0%), and Healthcare Support (56.2%).
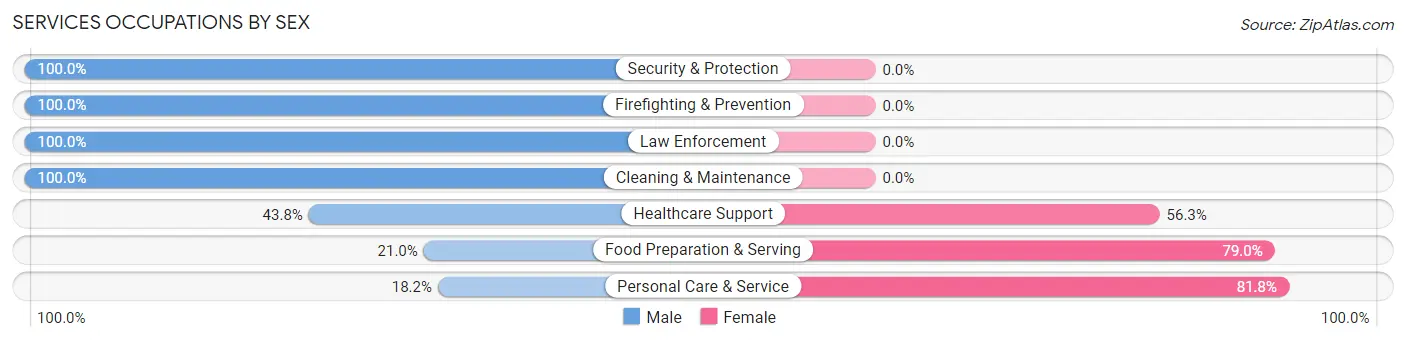
| Occupation | Male | Female |
| Healthcare Support | 7 (43.8%) | 9 (56.2%) |
| Security & Protection | 53 (100.0%) | 0 (0.0%) |
| Firefighting & Prevention | 39 (100.0%) | 0 (0.0%) |
| Law Enforcement | 14 (100.0%) | 0 (0.0%) |
| Food Preparation & Serving | 17 (21.0%) | 64 (79.0%) |
| Cleaning & Maintenance | 48 (100.0%) | 0 (0.0%) |
| Personal Care & Service | 16 (18.2%) | 72 (81.8%) |
| Total (Category) | 141 (49.3%) | 145 (50.7%) |
| Total (Overall) | 804 (51.7%) | 750 (48.3%) |
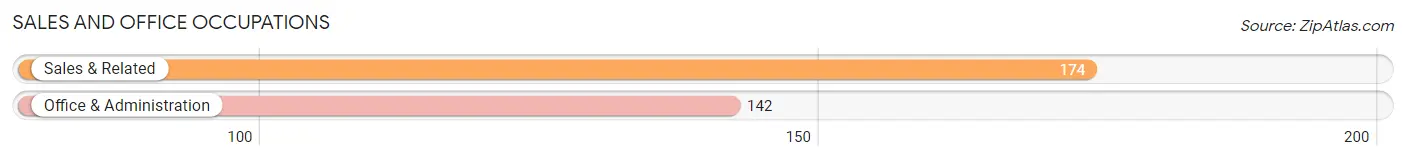
Sales and Office Occupations
The most common Sales and Office occupations in National Park borough are Sales & Related (174 | 11.2%), and Office & Administration (142 | 9.1%).
Sales and Office Occupations by Sex
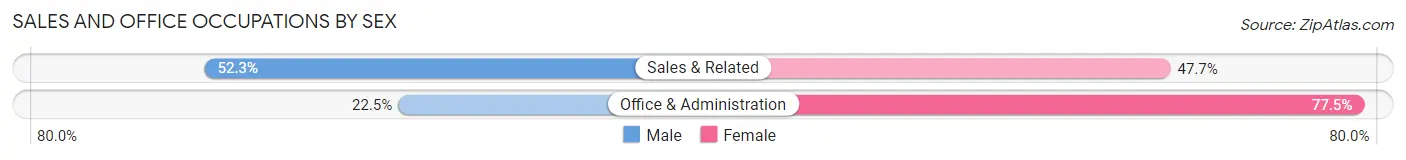
| Occupation | Male | Female |
| Sales & Related | 91 (52.3%) | 83 (47.7%) |
| Office & Administration | 32 (22.5%) | 110 (77.5%) |
| Total (Category) | 123 (38.9%) | 193 (61.1%) |
| Total (Overall) | 804 (51.7%) | 750 (48.3%) |
Natural Resources, Construction and Maintenance Occupations
The most common Natural Resources, Construction and Maintenance occupations in National Park borough are Construction & Extraction (103 | 6.6%), Installation, Maintenance & Repair (29 | 1.9%), and Farming, Fishing & Forestry (1 | 0.1%).
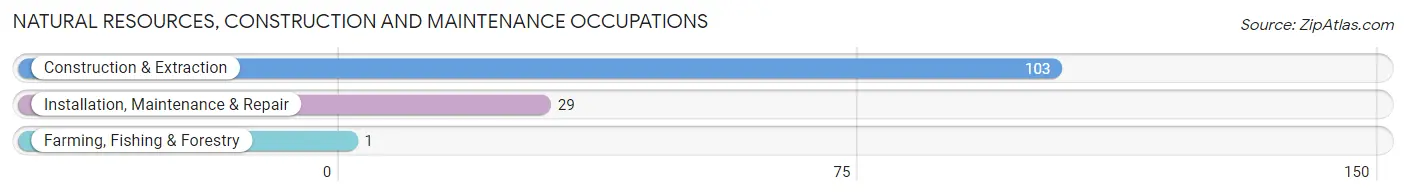
Natural Resources, Construction and Maintenance Occupations by Sex
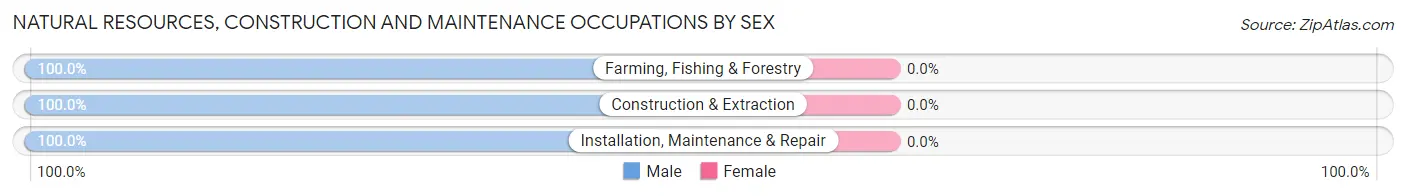
| Occupation | Male | Female |
| Farming, Fishing & Forestry | 1 (100.0%) | 0 (0.0%) |
| Construction & Extraction | 103 (100.0%) | 0 (0.0%) |
| Installation, Maintenance & Repair | 29 (100.0%) | 0 (0.0%) |
| Total (Category) | 133 (100.0%) | 0 (0.0%) |
| Total (Overall) | 804 (51.7%) | 750 (48.3%) |
Production, Transportation and Moving Occupations
The most common Production, Transportation and Moving occupations in National Park borough are Material Moving (134 | 8.6%), Transportation (82 | 5.3%), and Production (76 | 4.9%).
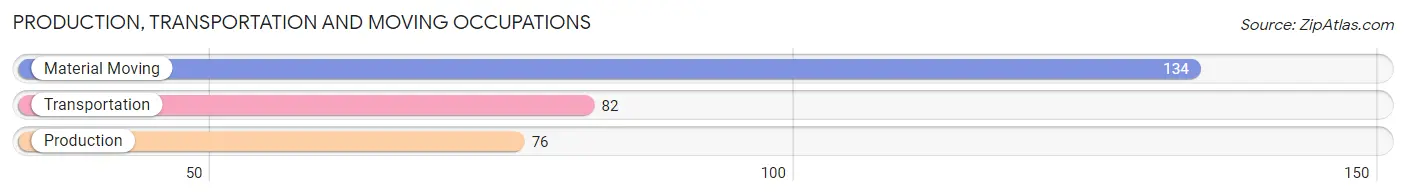
Production, Transportation and Moving Occupations by Sex
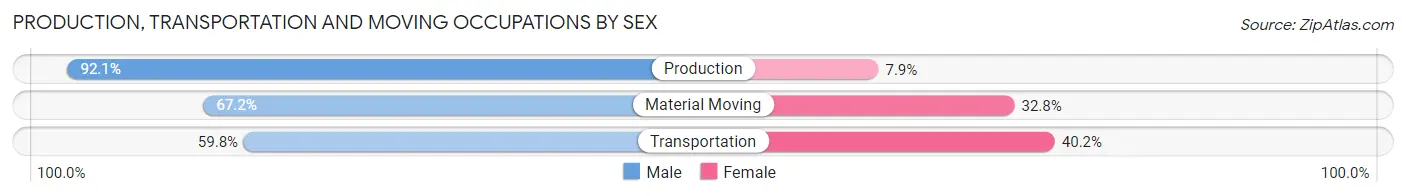
| Occupation | Male | Female |
| Production | 70 (92.1%) | 6 (7.9%) |
| Transportation | 49 (59.8%) | 33 (40.2%) |
| Material Moving | 90 (67.2%) | 44 (32.8%) |
| Total (Category) | 209 (71.6%) | 83 (28.4%) |
| Total (Overall) | 804 (51.7%) | 750 (48.3%) |
Employment Industries by Sex in National Park borough
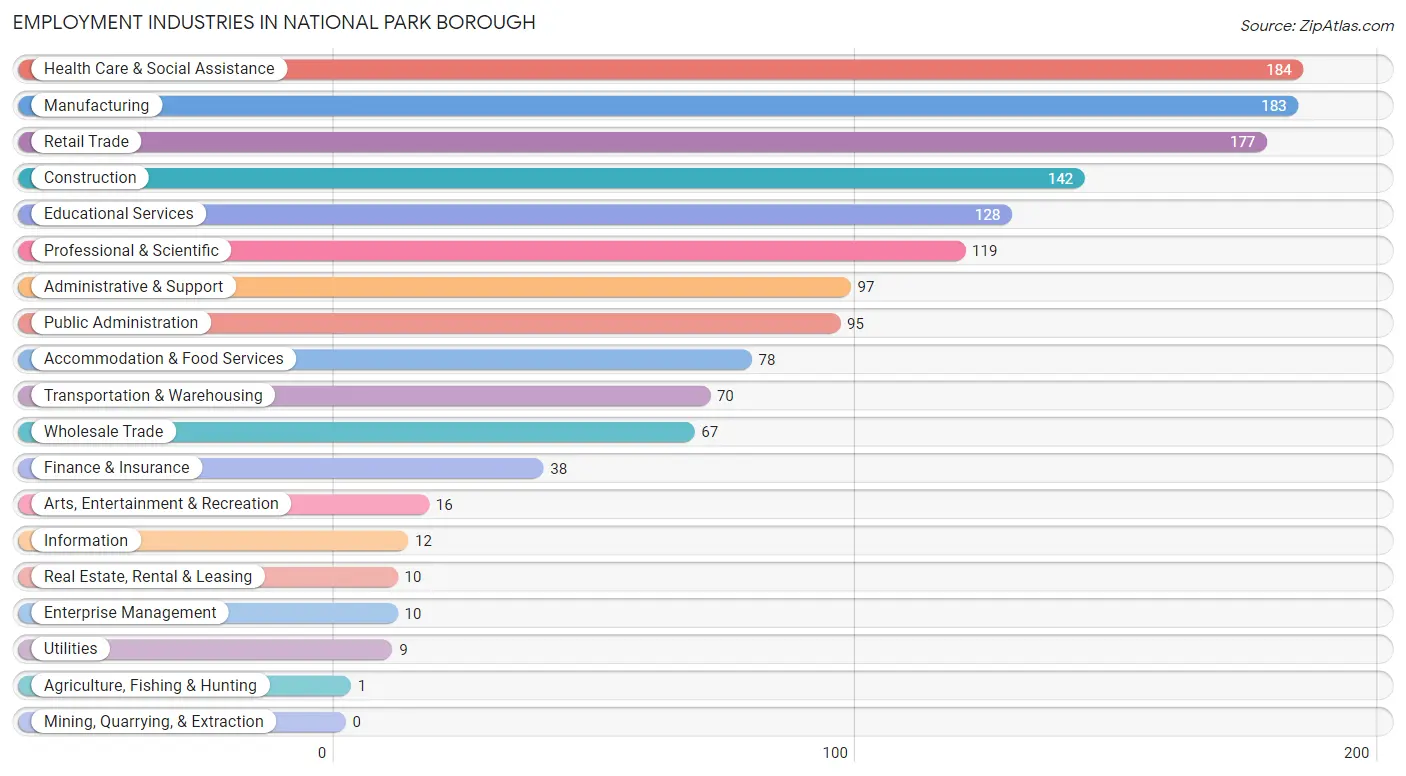
Employment Industries in National Park borough
The major employment industries in National Park borough include Health Care & Social Assistance (184 | 11.8%), Manufacturing (183 | 11.8%), Retail Trade (177 | 11.4%), Construction (142 | 9.1%), and Educational Services (128 | 8.2%).
Employment Industries by Sex in National Park borough
The National Park borough industries that see more men than women are Agriculture, Fishing & Hunting (100.0%), Utilities (100.0%), and Construction (95.1%), whereas the industries that tend to have a higher number of women are Information (100.0%), Educational Services (72.7%), and Health Care & Social Assistance (69.6%).
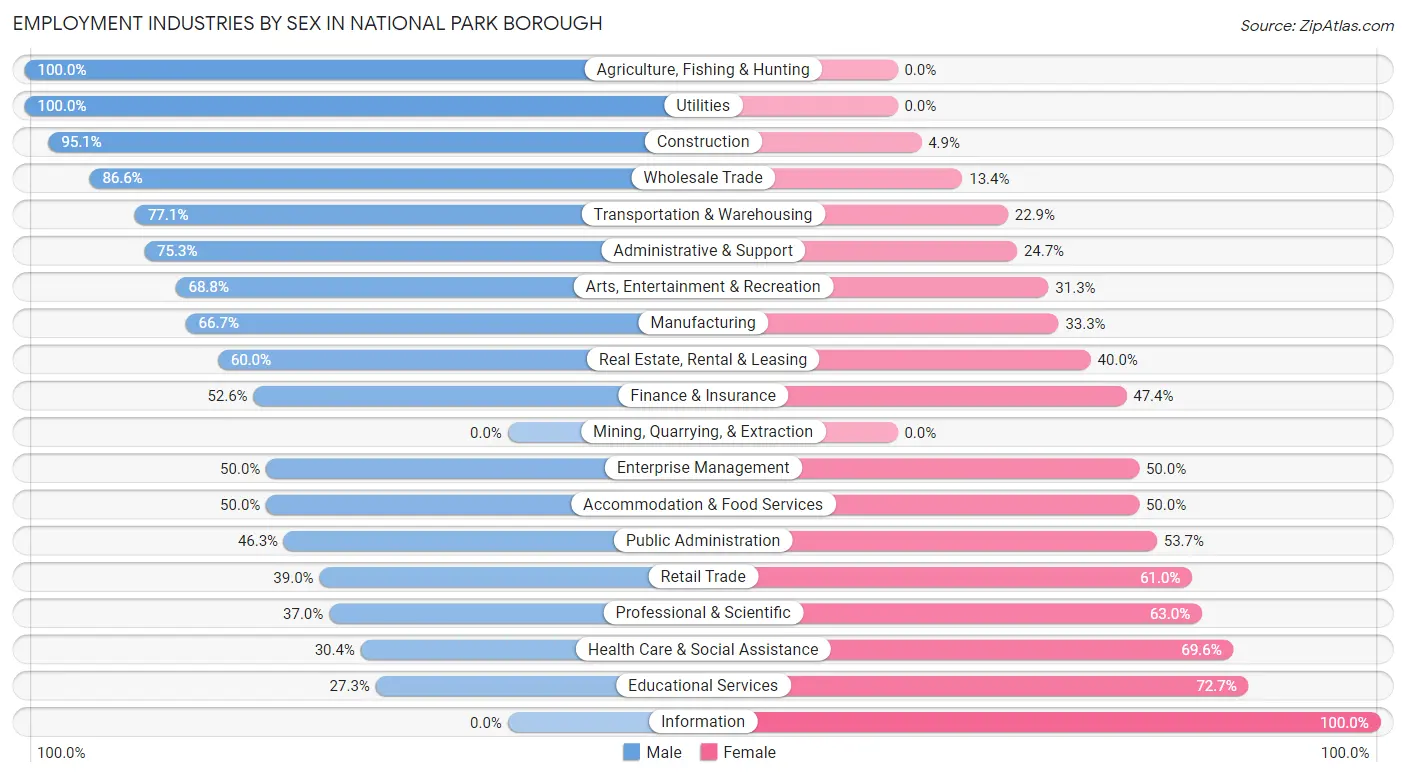
| Industry | Male | Female |
| Agriculture, Fishing & Hunting | 1 (100.0%) | 0 (0.0%) |
| Mining, Quarrying, & Extraction | 0 (0.0%) | 0 (0.0%) |
| Construction | 135 (95.1%) | 7 (4.9%) |
| Manufacturing | 122 (66.7%) | 61 (33.3%) |
| Wholesale Trade | 58 (86.6%) | 9 (13.4%) |
| Retail Trade | 69 (39.0%) | 108 (61.0%) |
| Transportation & Warehousing | 54 (77.1%) | 16 (22.9%) |
| Utilities | 9 (100.0%) | 0 (0.0%) |
| Information | 0 (0.0%) | 12 (100.0%) |
| Finance & Insurance | 20 (52.6%) | 18 (47.4%) |
| Real Estate, Rental & Leasing | 6 (60.0%) | 4 (40.0%) |
| Professional & Scientific | 44 (37.0%) | 75 (63.0%) |
| Enterprise Management | 5 (50.0%) | 5 (50.0%) |
| Administrative & Support | 73 (75.3%) | 24 (24.7%) |
| Educational Services | 35 (27.3%) | 93 (72.7%) |
| Health Care & Social Assistance | 56 (30.4%) | 128 (69.6%) |
| Arts, Entertainment & Recreation | 11 (68.8%) | 5 (31.2%) |
| Accommodation & Food Services | 39 (50.0%) | 39 (50.0%) |
| Public Administration | 44 (46.3%) | 51 (53.7%) |
| Total | 804 (51.7%) | 750 (48.3%) |
Education in National Park borough
School Enrollment in National Park borough
The most common levels of schooling among the 627 students in National Park borough are high school (208 | 33.2%), middle school (162 | 25.8%), and elementary school (101 | 16.1%).
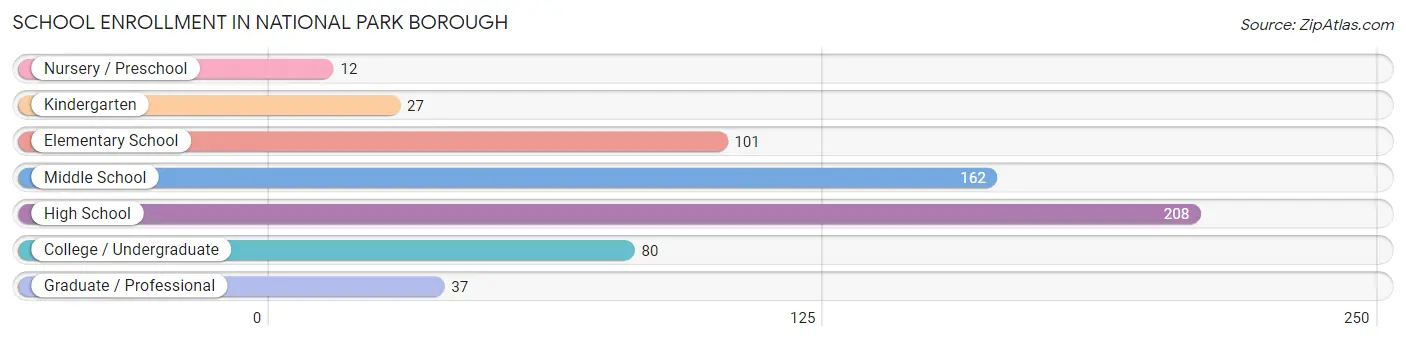
| School Level | # Students | % Students |
| Nursery / Preschool | 12 | 1.9% |
| Kindergarten | 27 | 4.3% |
| Elementary School | 101 | 16.1% |
| Middle School | 162 | 25.8% |
| High School | 208 | 33.2% |
| College / Undergraduate | 80 | 12.8% |
| Graduate / Professional | 37 | 5.9% |
| Total | 627 | 100.0% |
School Enrollment by Age by Funding Source in National Park borough
Out of a total of 627 students who are enrolled in schools in National Park borough, 37 (5.9%) attend a private institution, while the remaining 590 (94.1%) are enrolled in public schools. The age group of 25 to 34 year olds has the highest likelihood of being enrolled in private schools, with 14 (50.0% in the age bracket) enrolled. Conversely, the age group of 3 to 4 year olds has the lowest likelihood of being enrolled in a private school, with 7 (100.0% in the age bracket) attending a public institution.
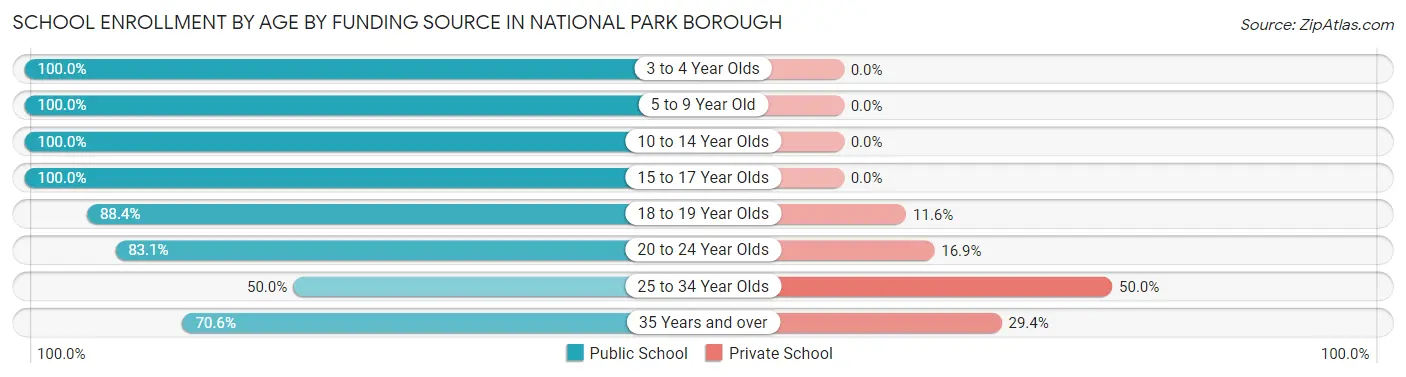
| Age Bracket | Public School | Private School |
| 3 to 4 Year Olds | 7 (100.0%) | 0 (0.0%) |
| 5 to 9 Year Old | 112 (100.0%) | 0 (0.0%) |
| 10 to 14 Year Olds | 182 (100.0%) | 0 (0.0%) |
| 15 to 17 Year Olds | 161 (100.0%) | 0 (0.0%) |
| 18 to 19 Year Olds | 38 (88.4%) | 5 (11.6%) |
| 20 to 24 Year Olds | 64 (83.1%) | 13 (16.9%) |
| 25 to 34 Year Olds | 14 (50.0%) | 14 (50.0%) |
| 35 Years and over | 12 (70.6%) | 5 (29.4%) |
| Total | 590 (94.1%) | 37 (5.9%) |
Educational Attainment by Field of Study in National Park borough
Education (53 | 13.2%), communications (51 | 12.7%), science & technology (48 | 11.9%), arts & humanities (47 | 11.7%), and bio, nature & agricultural (43 | 10.7%) are the most common fields of study among 403 individuals in National Park borough who have obtained a bachelor's degree or higher.
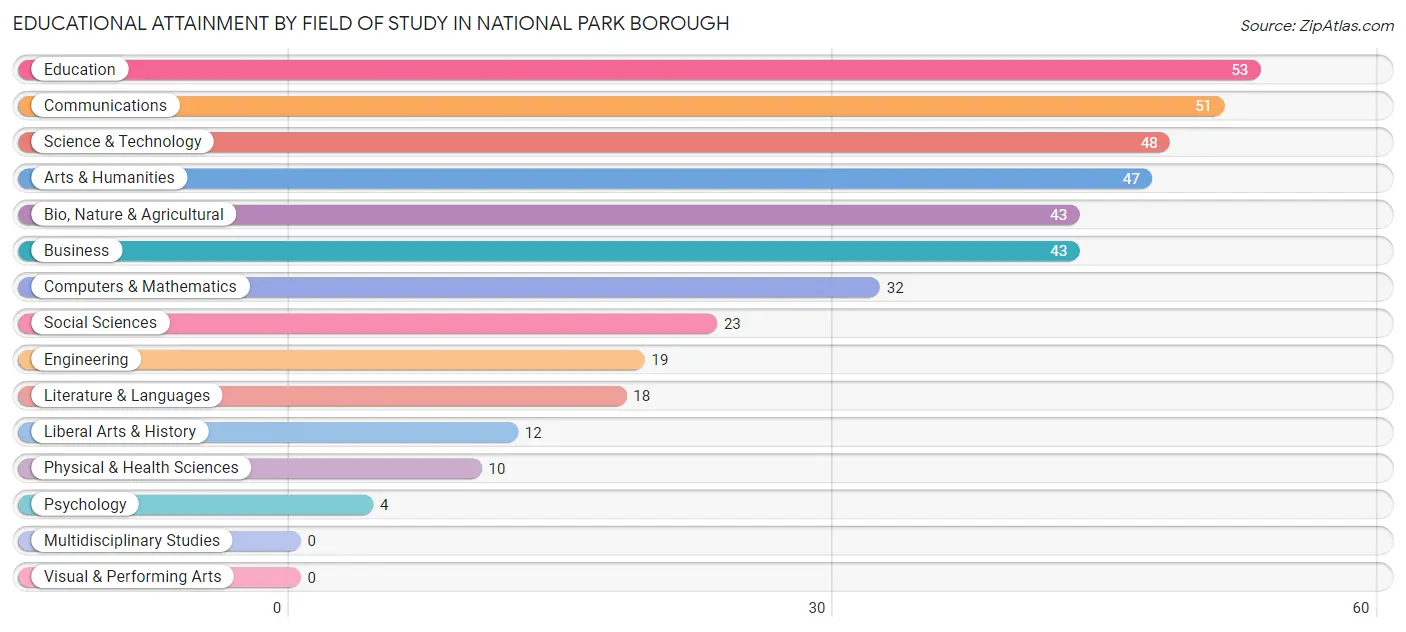
| Field of Study | # Graduates | % Graduates |
| Computers & Mathematics | 32 | 7.9% |
| Bio, Nature & Agricultural | 43 | 10.7% |
| Physical & Health Sciences | 10 | 2.5% |
| Psychology | 4 | 1.0% |
| Social Sciences | 23 | 5.7% |
| Engineering | 19 | 4.7% |
| Multidisciplinary Studies | 0 | 0.0% |
| Science & Technology | 48 | 11.9% |
| Business | 43 | 10.7% |
| Education | 53 | 13.2% |
| Literature & Languages | 18 | 4.5% |
| Liberal Arts & History | 12 | 3.0% |
| Visual & Performing Arts | 0 | 0.0% |
| Communications | 51 | 12.7% |
| Arts & Humanities | 47 | 11.7% |
| Total | 403 | 100.0% |
Transportation & Commute in National Park borough
Vehicle Availability by Sex in National Park borough
The most prevalent vehicle ownership categories in National Park borough are males with 2 vehicles (389, accounting for 48.7%) and females with 2 vehicles (252, making up 53.9%).
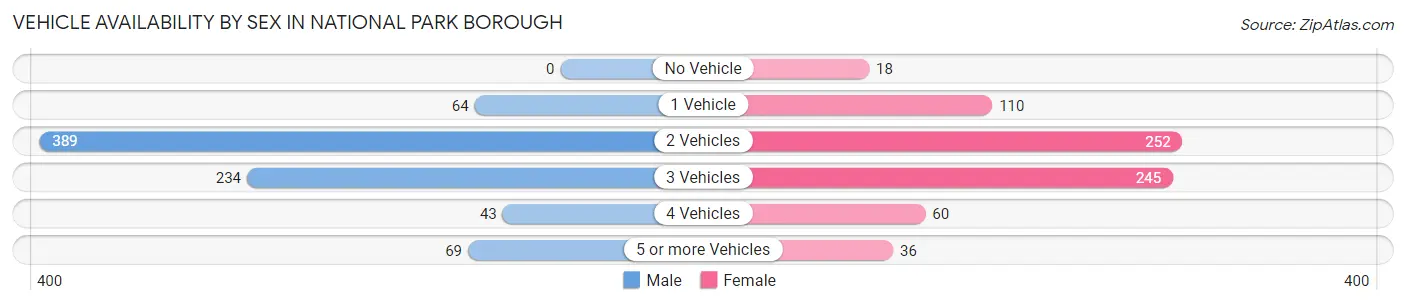
| Vehicles Available | Male | Female |
| No Vehicle | 0 (0.0%) | 18 (2.5%) |
| 1 Vehicle | 64 (8.0%) | 110 (15.3%) |
| 2 Vehicles | 389 (48.7%) | 252 (34.9%) |
| 3 Vehicles | 234 (29.3%) | 245 (34.0%) |
| 4 Vehicles | 43 (5.4%) | 60 (8.3%) |
| 5 or more Vehicles | 69 (8.6%) | 36 (5.0%) |
| Total | 799 (100.0%) | 721 (100.0%) |
Commute Time in National Park borough
The most frequently occuring commute durations in National Park borough are 20 to 24 minutes (301 commuters, 21.1%), 15 to 19 minutes (148 commuters, 10.4%), and 45 to 59 minutes (143 commuters, 10.0%).
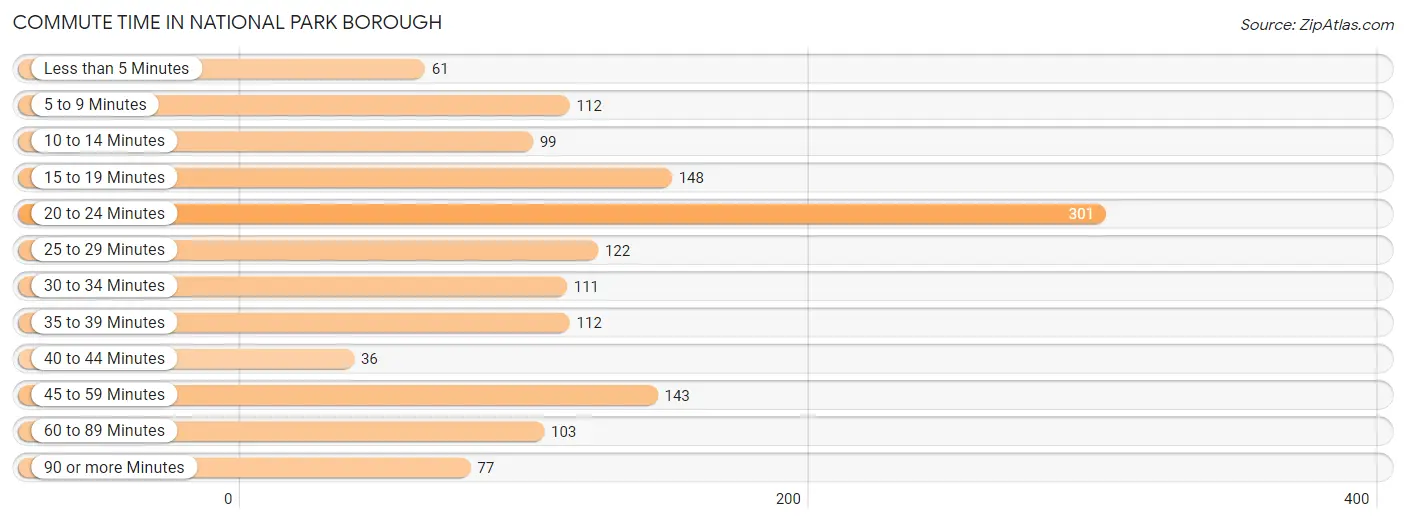
| Commute Time | # Commuters | % Commuters |
| Less than 5 Minutes | 61 | 4.3% |
| 5 to 9 Minutes | 112 | 7.9% |
| 10 to 14 Minutes | 99 | 7.0% |
| 15 to 19 Minutes | 148 | 10.4% |
| 20 to 24 Minutes | 301 | 21.1% |
| 25 to 29 Minutes | 122 | 8.6% |
| 30 to 34 Minutes | 111 | 7.8% |
| 35 to 39 Minutes | 112 | 7.9% |
| 40 to 44 Minutes | 36 | 2.5% |
| 45 to 59 Minutes | 143 | 10.0% |
| 60 to 89 Minutes | 103 | 7.2% |
| 90 or more Minutes | 77 | 5.4% |
Commute Time by Sex in National Park borough
The most common commute times in National Park borough are 20 to 24 minutes (188 commuters, 24.1%) for males and 20 to 24 minutes (113 commuters, 17.5%) for females.
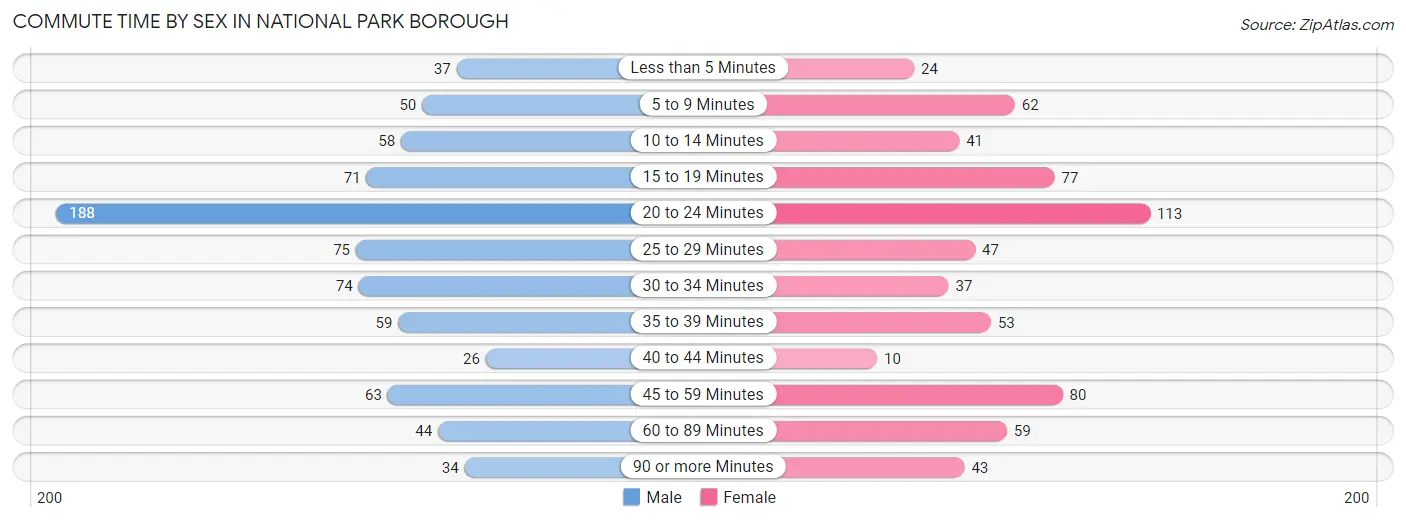
| Commute Time | Male | Female |
| Less than 5 Minutes | 37 (4.8%) | 24 (3.7%) |
| 5 to 9 Minutes | 50 (6.4%) | 62 (9.6%) |
| 10 to 14 Minutes | 58 (7.4%) | 41 (6.4%) |
| 15 to 19 Minutes | 71 (9.1%) | 77 (11.9%) |
| 20 to 24 Minutes | 188 (24.1%) | 113 (17.5%) |
| 25 to 29 Minutes | 75 (9.6%) | 47 (7.3%) |
| 30 to 34 Minutes | 74 (9.5%) | 37 (5.7%) |
| 35 to 39 Minutes | 59 (7.6%) | 53 (8.2%) |
| 40 to 44 Minutes | 26 (3.3%) | 10 (1.5%) |
| 45 to 59 Minutes | 63 (8.1%) | 80 (12.4%) |
| 60 to 89 Minutes | 44 (5.7%) | 59 (9.1%) |
| 90 or more Minutes | 34 (4.4%) | 43 (6.7%) |
Time of Departure to Work by Sex in National Park borough
The most frequent times of departure to work in National Park borough are 7:00 AM to 7:29 AM (181, 23.2%) for males and 7:00 AM to 7:29 AM (122, 18.9%) for females.
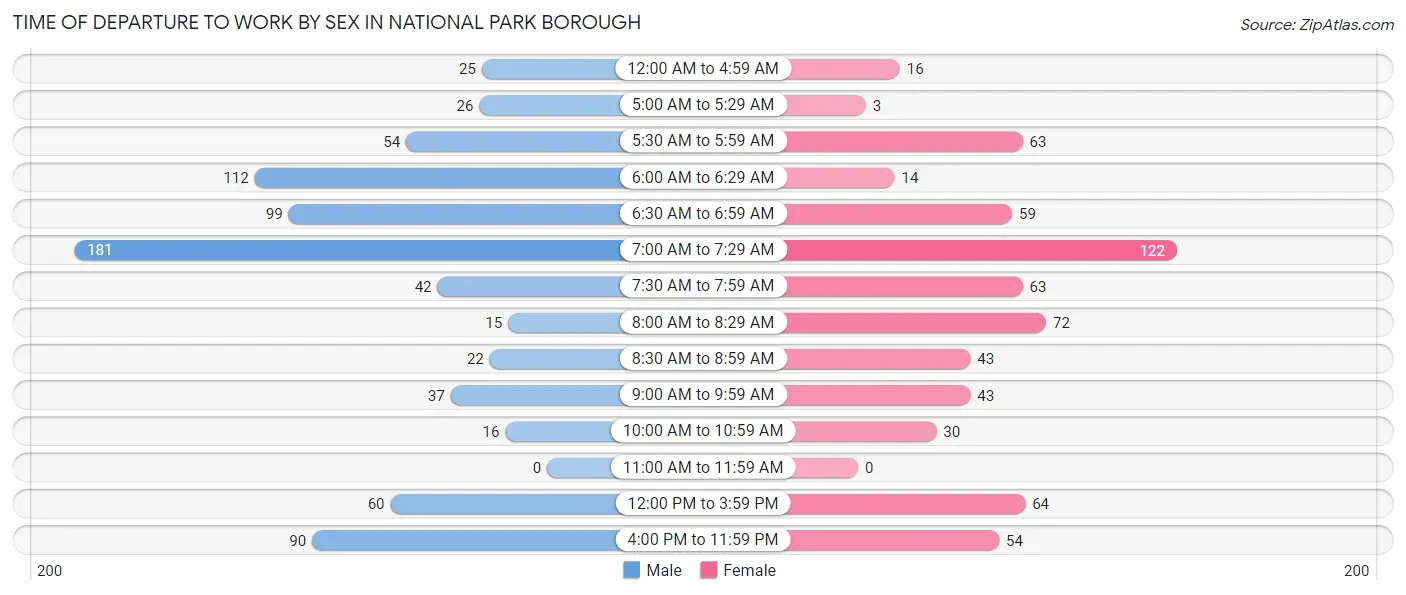
| Time of Departure | Male | Female |
| 12:00 AM to 4:59 AM | 25 (3.2%) | 16 (2.5%) |
| 5:00 AM to 5:29 AM | 26 (3.3%) | 3 (0.5%) |
| 5:30 AM to 5:59 AM | 54 (6.9%) | 63 (9.8%) |
| 6:00 AM to 6:29 AM | 112 (14.4%) | 14 (2.2%) |
| 6:30 AM to 6:59 AM | 99 (12.7%) | 59 (9.1%) |
| 7:00 AM to 7:29 AM | 181 (23.2%) | 122 (18.9%) |
| 7:30 AM to 7:59 AM | 42 (5.4%) | 63 (9.8%) |
| 8:00 AM to 8:29 AM | 15 (1.9%) | 72 (11.2%) |
| 8:30 AM to 8:59 AM | 22 (2.8%) | 43 (6.7%) |
| 9:00 AM to 9:59 AM | 37 (4.8%) | 43 (6.7%) |
| 10:00 AM to 10:59 AM | 16 (2.1%) | 30 (4.6%) |
| 11:00 AM to 11:59 AM | 0 (0.0%) | 0 (0.0%) |
| 12:00 PM to 3:59 PM | 60 (7.7%) | 64 (9.9%) |
| 4:00 PM to 11:59 PM | 90 (11.6%) | 54 (8.4%) |
| Total | 779 (100.0%) | 646 (100.0%) |
Housing Occupancy in National Park borough
Occupancy by Ownership in National Park borough
Of the total 1,049 dwellings in National Park borough, owner-occupied units account for 918 (87.5%), while renter-occupied units make up 131 (12.5%).
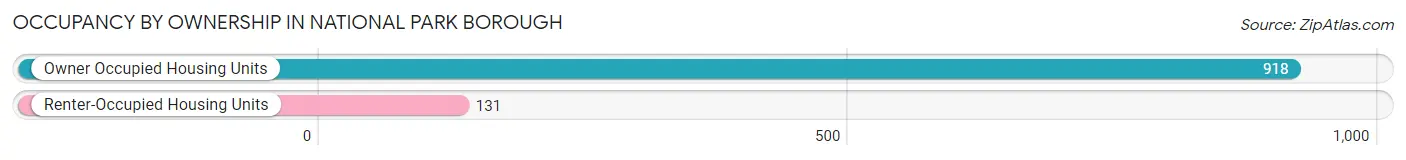
| Occupancy | # Housing Units | % Housing Units |
| Owner Occupied Housing Units | 918 | 87.5% |
| Renter-Occupied Housing Units | 131 | 12.5% |
| Total Occupied Housing Units | 1,049 | 100.0% |
Occupancy by Household Size in National Park borough
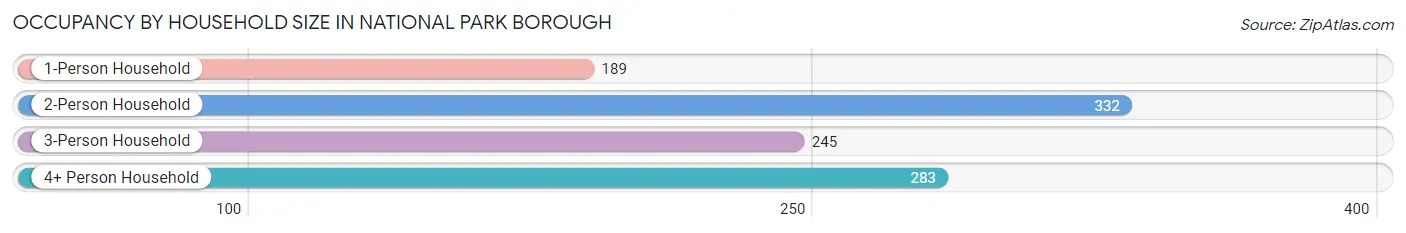
| Household Size | # Housing Units | % Housing Units |
| 1-Person Household | 189 | 18.0% |
| 2-Person Household | 332 | 31.7% |
| 3-Person Household | 245 | 23.4% |
| 4+ Person Household | 283 | 27.0% |
| Total Housing Units | 1,049 | 100.0% |
Occupancy by Ownership by Household Size in National Park borough
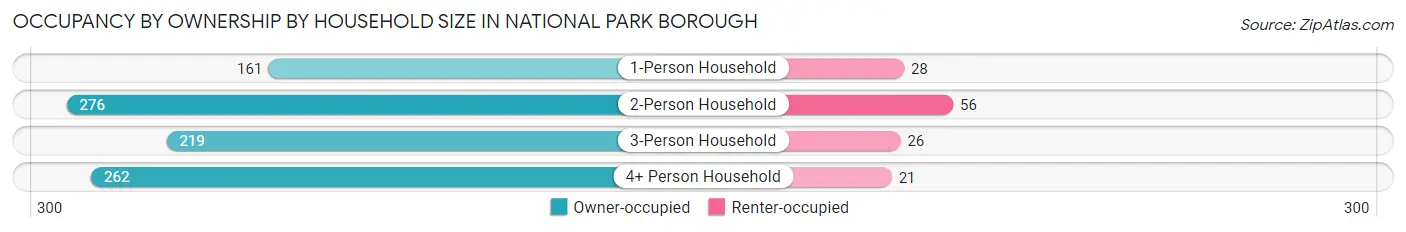
| Household Size | Owner-occupied | Renter-occupied |
| 1-Person Household | 161 (85.2%) | 28 (14.8%) |
| 2-Person Household | 276 (83.1%) | 56 (16.9%) |
| 3-Person Household | 219 (89.4%) | 26 (10.6%) |
| 4+ Person Household | 262 (92.6%) | 21 (7.4%) |
| Total Housing Units | 918 (87.5%) | 131 (12.5%) |
Occupancy by Educational Attainment in National Park borough
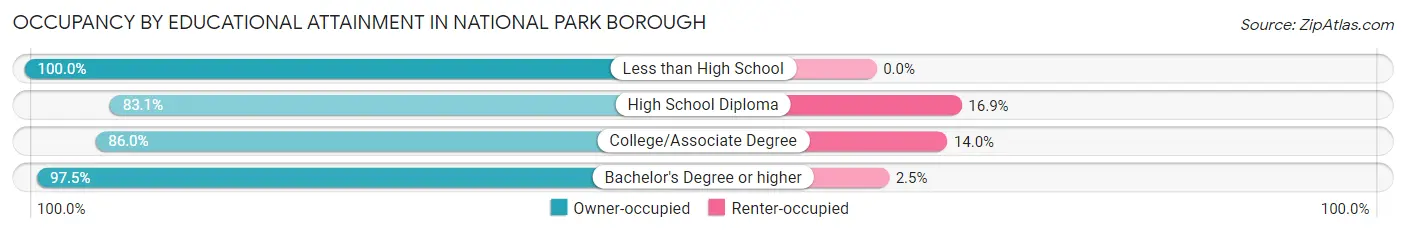
| Household Size | Owner-occupied | Renter-occupied |
| Less than High School | 37 (100.0%) | 0 (0.0%) |
| High School Diploma | 354 (83.1%) | 72 (16.9%) |
| College/Associate Degree | 331 (86.0%) | 54 (14.0%) |
| Bachelor's Degree or higher | 196 (97.5%) | 5 (2.5%) |
Occupancy by Age of Householder in National Park borough
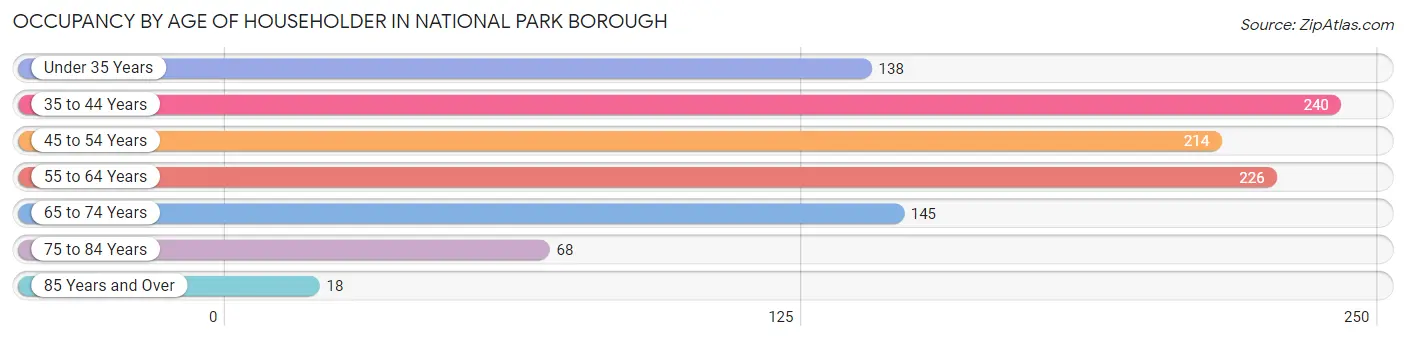
| Age Bracket | # Households | % Households |
| Under 35 Years | 138 | 13.2% |
| 35 to 44 Years | 240 | 22.9% |
| 45 to 54 Years | 214 | 20.4% |
| 55 to 64 Years | 226 | 21.5% |
| 65 to 74 Years | 145 | 13.8% |
| 75 to 84 Years | 68 | 6.5% |
| 85 Years and Over | 18 | 1.7% |
| Total | 1,049 | 100.0% |
Housing Finances in National Park borough
Median Income by Occupancy in National Park borough
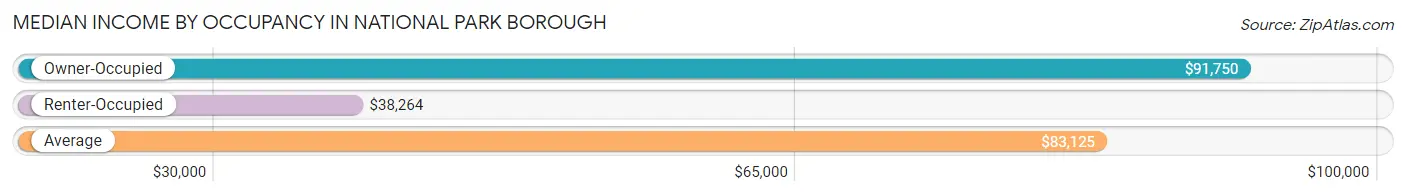
| Occupancy Type | # Households | Median Income |
| Owner-Occupied | 918 (87.5%) | $91,750 |
| Renter-Occupied | 131 (12.5%) | $38,264 |
| Average | 1,049 (100.0%) | $83,125 |
Occupancy by Householder Income Bracket in National Park borough
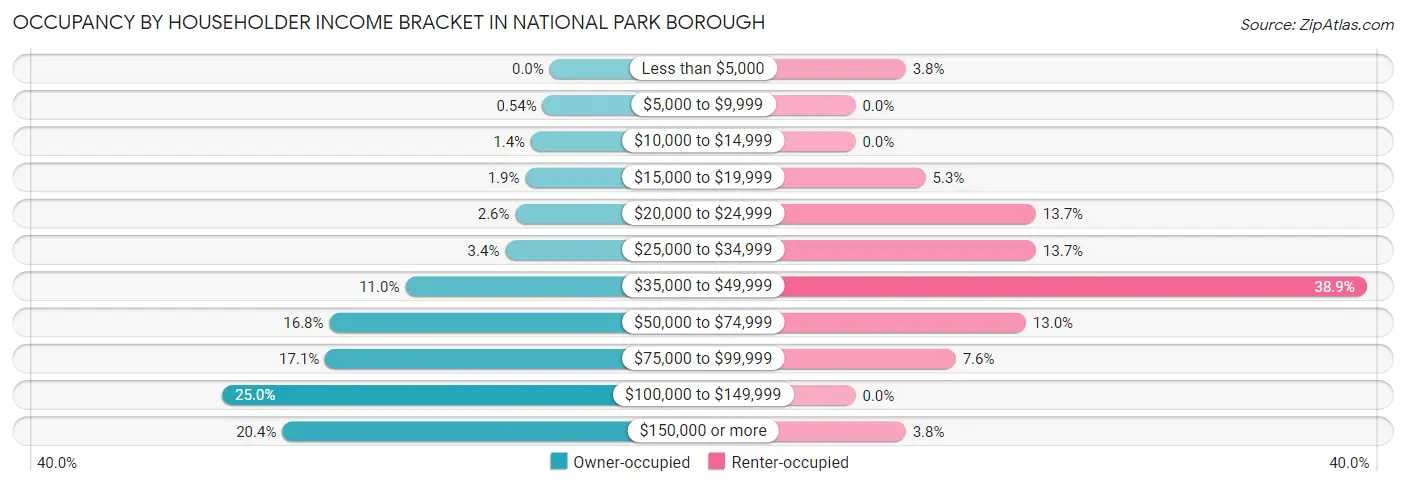
| Income Bracket | Owner-occupied | Renter-occupied |
| Less than $5,000 | 0 (0.0%) | 5 (3.8%) |
| $5,000 to $9,999 | 5 (0.5%) | 0 (0.0%) |
| $10,000 to $14,999 | 13 (1.4%) | 0 (0.0%) |
| $15,000 to $19,999 | 17 (1.8%) | 7 (5.3%) |
| $20,000 to $24,999 | 24 (2.6%) | 18 (13.7%) |
| $25,000 to $34,999 | 31 (3.4%) | 18 (13.7%) |
| $35,000 to $49,999 | 101 (11.0%) | 51 (38.9%) |
| $50,000 to $74,999 | 154 (16.8%) | 17 (13.0%) |
| $75,000 to $99,999 | 157 (17.1%) | 10 (7.6%) |
| $100,000 to $149,999 | 229 (24.9%) | 0 (0.0%) |
| $150,000 or more | 187 (20.4%) | 5 (3.8%) |
| Total | 918 (100.0%) | 131 (100.0%) |
Monthly Housing Cost Tiers in National Park borough
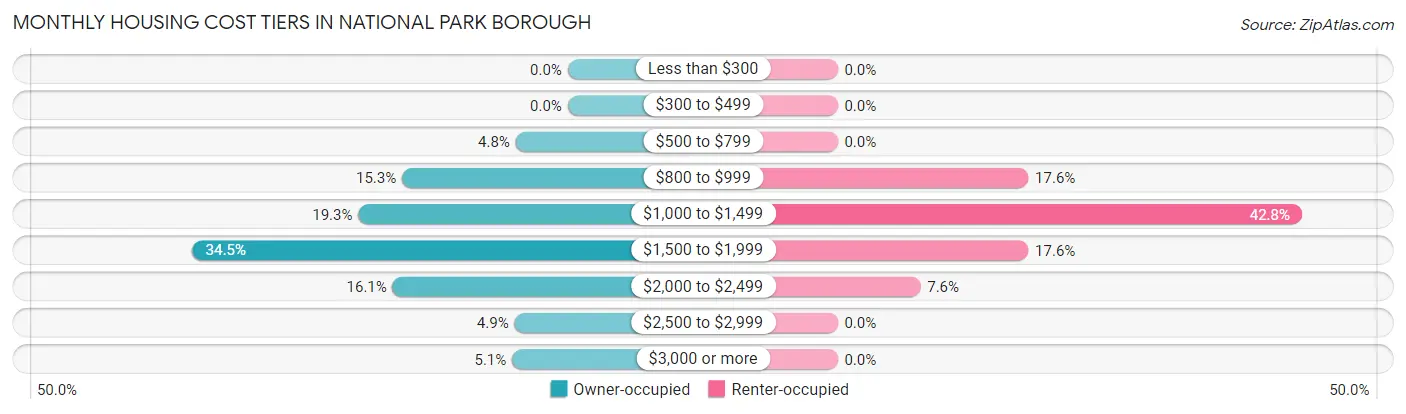
| Monthly Cost | Owner-occupied | Renter-occupied |
| Less than $300 | 0 (0.0%) | 0 (0.0%) |
| $300 to $499 | 0 (0.0%) | 0 (0.0%) |
| $500 to $799 | 44 (4.8%) | 0 (0.0%) |
| $800 to $999 | 140 (15.2%) | 23 (17.6%) |
| $1,000 to $1,499 | 177 (19.3%) | 56 (42.7%) |
| $1,500 to $1,999 | 317 (34.5%) | 23 (17.6%) |
| $2,000 to $2,499 | 148 (16.1%) | 10 (7.6%) |
| $2,500 to $2,999 | 45 (4.9%) | 0 (0.0%) |
| $3,000 or more | 47 (5.1%) | 0 (0.0%) |
| Total | 918 (100.0%) | 131 (100.0%) |
Physical Housing Characteristics in National Park borough
Housing Structures in National Park borough
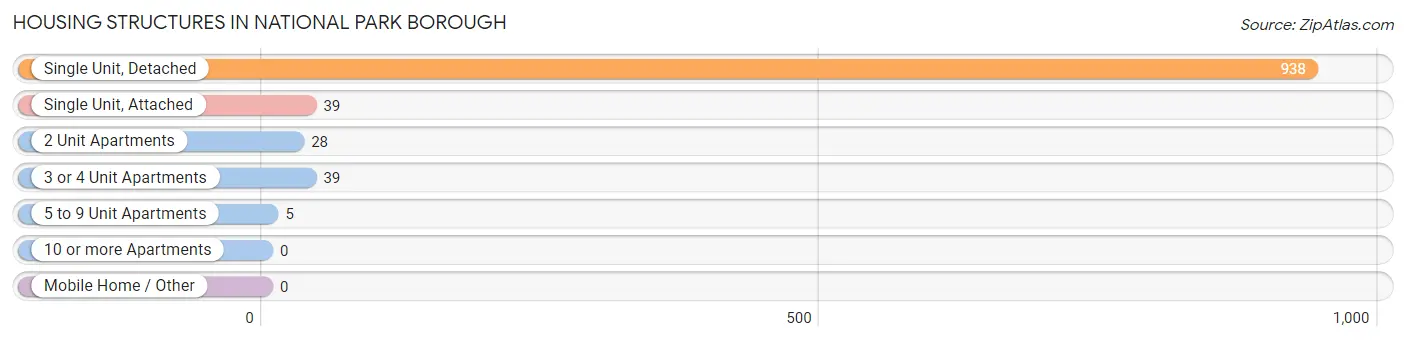
| Structure Type | # Housing Units | % Housing Units |
| Single Unit, Detached | 938 | 89.4% |
| Single Unit, Attached | 39 | 3.7% |
| 2 Unit Apartments | 28 | 2.7% |
| 3 or 4 Unit Apartments | 39 | 3.7% |
| 5 to 9 Unit Apartments | 5 | 0.5% |
| 10 or more Apartments | 0 | 0.0% |
| Mobile Home / Other | 0 | 0.0% |
| Total | 1,049 | 100.0% |
Housing Structures by Occupancy in National Park borough
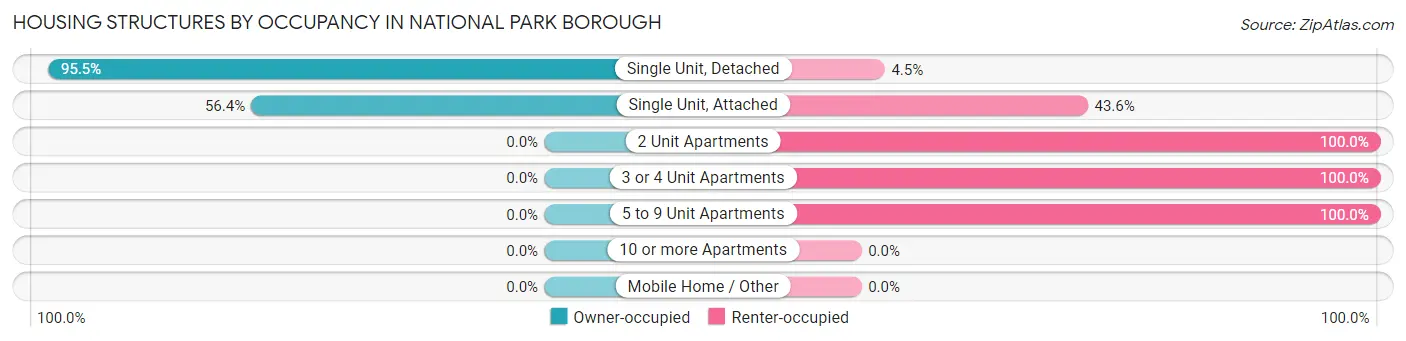
| Structure Type | Owner-occupied | Renter-occupied |
| Single Unit, Detached | 896 (95.5%) | 42 (4.5%) |
| Single Unit, Attached | 22 (56.4%) | 17 (43.6%) |
| 2 Unit Apartments | 0 (0.0%) | 28 (100.0%) |
| 3 or 4 Unit Apartments | 0 (0.0%) | 39 (100.0%) |
| 5 to 9 Unit Apartments | 0 (0.0%) | 5 (100.0%) |
| 10 or more Apartments | 0 (0.0%) | 0 (0.0%) |
| Mobile Home / Other | 0 (0.0%) | 0 (0.0%) |
| Total | 918 (87.5%) | 131 (12.5%) |
Housing Structures by Number of Rooms in National Park borough
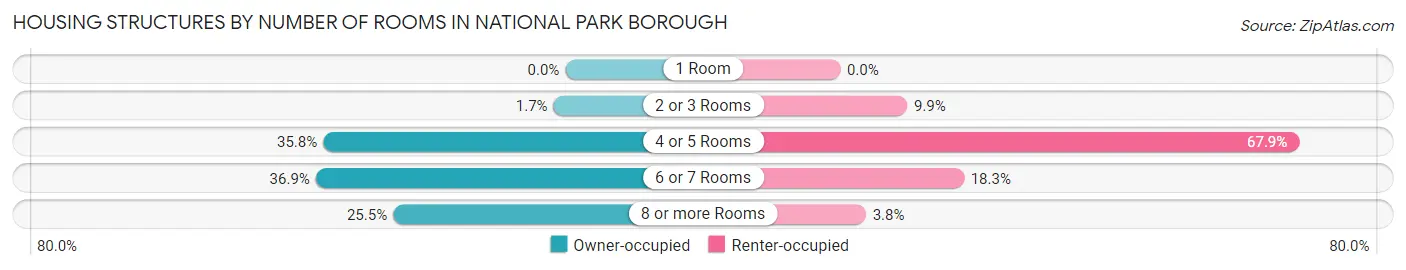
| Number of Rooms | Owner-occupied | Renter-occupied |
| 1 Room | 0 (0.0%) | 0 (0.0%) |
| 2 or 3 Rooms | 16 (1.7%) | 13 (9.9%) |
| 4 or 5 Rooms | 329 (35.8%) | 89 (67.9%) |
| 6 or 7 Rooms | 339 (36.9%) | 24 (18.3%) |
| 8 or more Rooms | 234 (25.5%) | 5 (3.8%) |
| Total | 918 (100.0%) | 131 (100.0%) |
Housing Structure by Heating Type in National Park borough
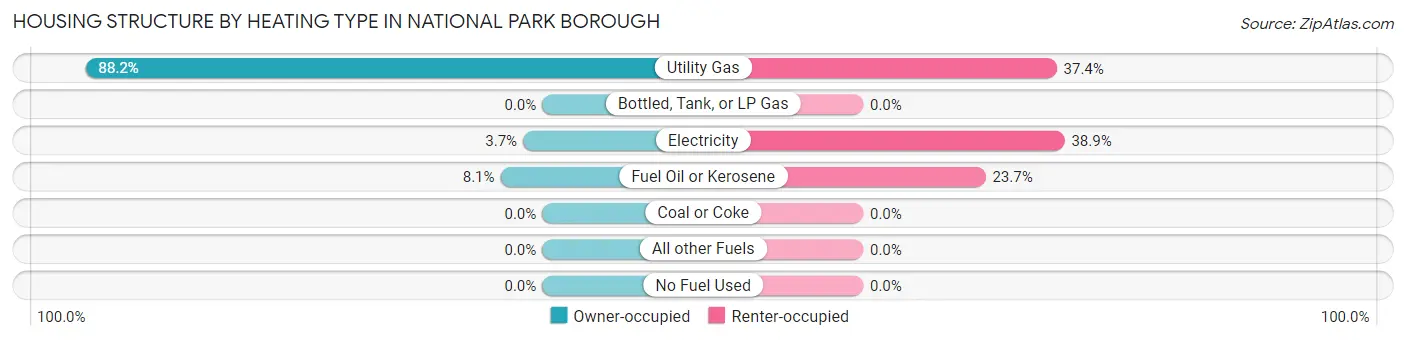
| Heating Type | Owner-occupied | Renter-occupied |
| Utility Gas | 810 (88.2%) | 49 (37.4%) |
| Bottled, Tank, or LP Gas | 0 (0.0%) | 0 (0.0%) |
| Electricity | 34 (3.7%) | 51 (38.9%) |
| Fuel Oil or Kerosene | 74 (8.1%) | 31 (23.7%) |
| Coal or Coke | 0 (0.0%) | 0 (0.0%) |
| All other Fuels | 0 (0.0%) | 0 (0.0%) |
| No Fuel Used | 0 (0.0%) | 0 (0.0%) |
| Total | 918 (100.0%) | 131 (100.0%) |
Household Vehicle Usage in National Park borough
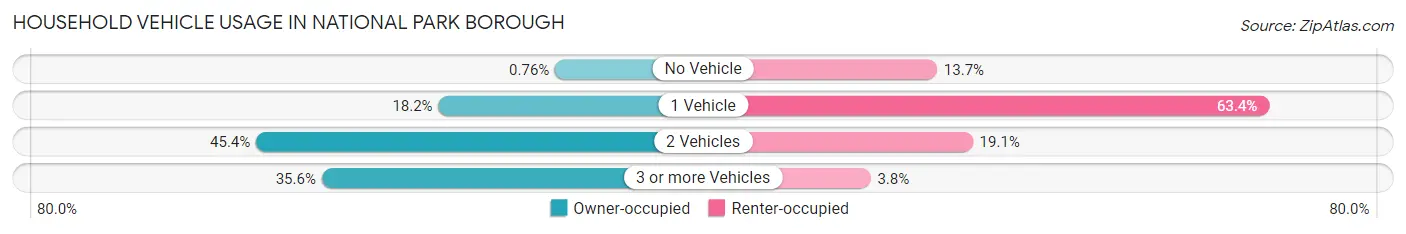
| Vehicles per Household | Owner-occupied | Renter-occupied |
| No Vehicle | 7 (0.8%) | 18 (13.7%) |
| 1 Vehicle | 167 (18.2%) | 83 (63.4%) |
| 2 Vehicles | 417 (45.4%) | 25 (19.1%) |
| 3 or more Vehicles | 327 (35.6%) | 5 (3.8%) |
| Total | 918 (100.0%) | 131 (100.0%) |
Real Estate & Mortgages in National Park borough
Real Estate and Mortgage Overview in National Park borough
| Characteristic | Without Mortgage | With Mortgage |
| Housing Units | 278 | 640 |
| Median Property Value | $184,000 | $179,100 |
| Median Household Income | $80,000 | $131 |
| Monthly Housing Costs | $951 | $47 |
| Real Estate Taxes | $6,759 | $15 |
Property Value by Mortgage Status in National Park borough
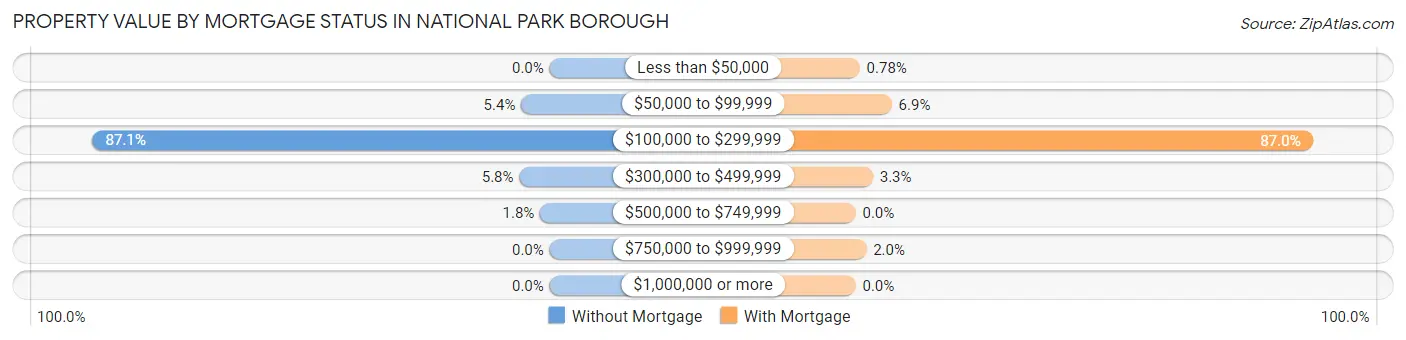
| Property Value | Without Mortgage | With Mortgage |
| Less than $50,000 | 0 (0.0%) | 5 (0.8%) |
| $50,000 to $99,999 | 15 (5.4%) | 44 (6.9%) |
| $100,000 to $299,999 | 242 (87.1%) | 557 (87.0%) |
| $300,000 to $499,999 | 16 (5.8%) | 21 (3.3%) |
| $500,000 to $749,999 | 5 (1.8%) | 0 (0.0%) |
| $750,000 to $999,999 | 0 (0.0%) | 13 (2.0%) |
| $1,000,000 or more | 0 (0.0%) | 0 (0.0%) |
| Total | 278 (100.0%) | 640 (100.0%) |
Household Income by Mortgage Status in National Park borough
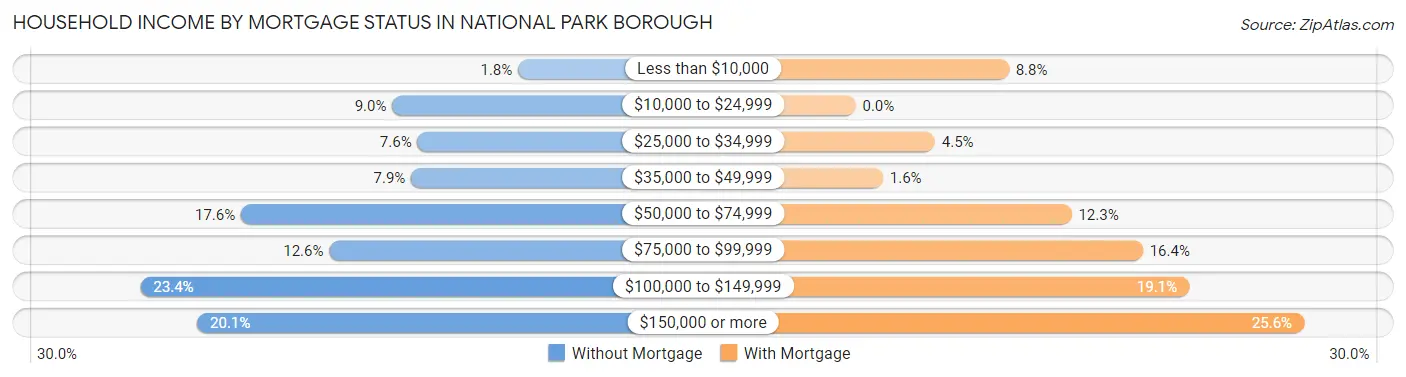
| Household Income | Without Mortgage | With Mortgage |
| Less than $10,000 | 5 (1.8%) | 56 (8.7%) |
| $10,000 to $24,999 | 25 (9.0%) | 0 (0.0%) |
| $25,000 to $34,999 | 21 (7.5%) | 29 (4.5%) |
| $35,000 to $49,999 | 22 (7.9%) | 10 (1.6%) |
| $50,000 to $74,999 | 49 (17.6%) | 79 (12.3%) |
| $75,000 to $99,999 | 35 (12.6%) | 105 (16.4%) |
| $100,000 to $149,999 | 65 (23.4%) | 122 (19.1%) |
| $150,000 or more | 56 (20.1%) | 164 (25.6%) |
| Total | 278 (100.0%) | 640 (100.0%) |
Property Value to Household Income Ratio in National Park borough
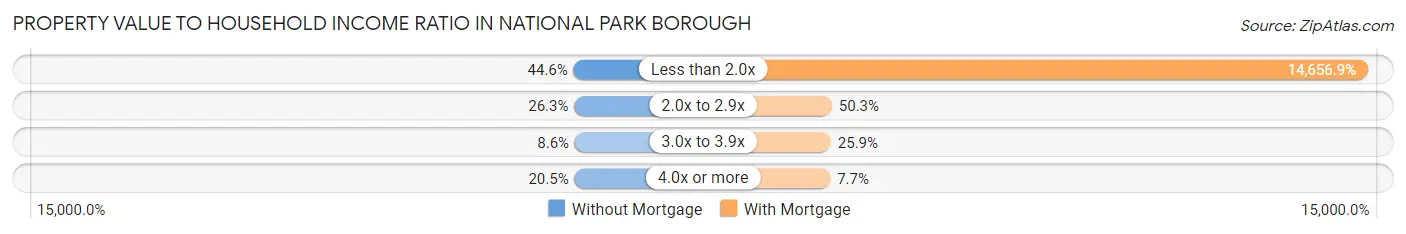
| Value-to-Income Ratio | Without Mortgage | With Mortgage |
| Less than 2.0x | 124 (44.6%) | 93,804 (14,656.9%) |
| 2.0x to 2.9x | 73 (26.3%) | 322 (50.3%) |
| 3.0x to 3.9x | 24 (8.6%) | 166 (25.9%) |
| 4.0x or more | 57 (20.5%) | 49 (7.7%) |
| Total | 278 (100.0%) | 640 (100.0%) |
Real Estate Taxes by Mortgage Status in National Park borough
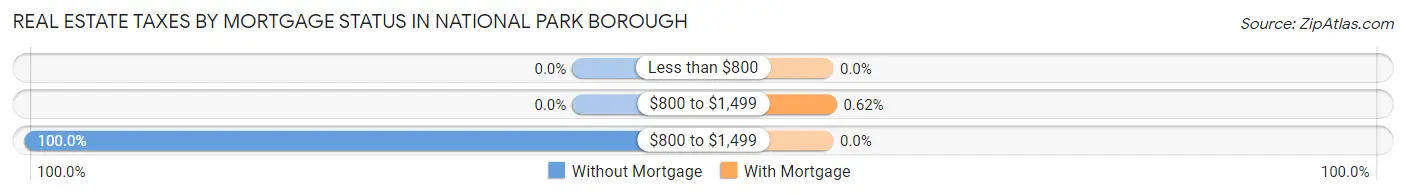
| Property Taxes | Without Mortgage | With Mortgage |
| Less than $800 | 0 (0.0%) | 0 (0.0%) |
| $800 to $1,499 | 0 (0.0%) | 4 (0.6%) |
| $800 to $1,499 | 278 (100.0%) | 0 (0.0%) |
| Total | 278 (100.0%) | 640 (100.0%) |
Health & Disability in National Park borough
Health Insurance Coverage by Age in National Park borough
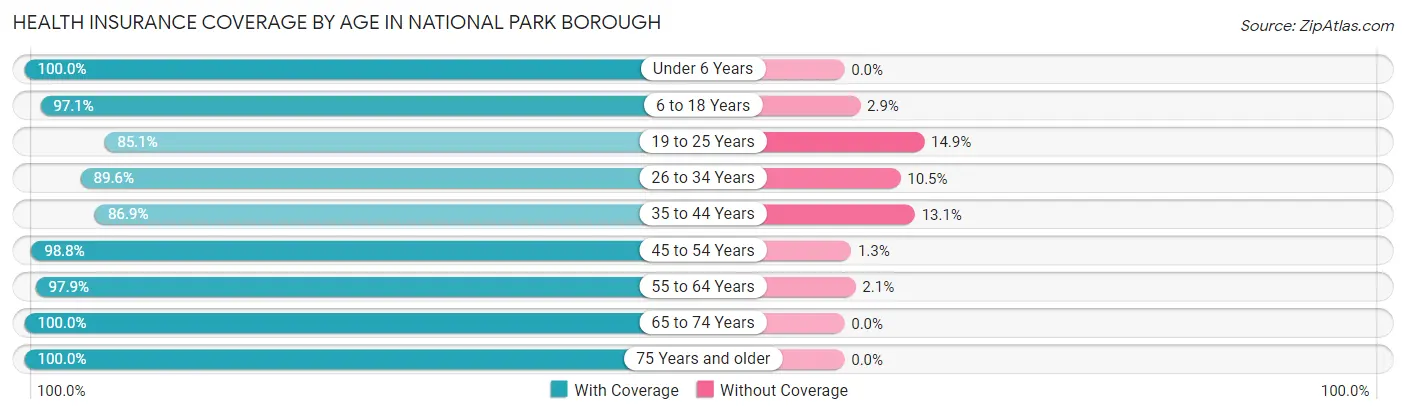
| Age Bracket | With Coverage | Without Coverage |
| Under 6 Years | 171 (100.0%) | 0 (0.0%) |
| 6 to 18 Years | 463 (97.1%) | 14 (2.9%) |
| 19 to 25 Years | 269 (85.1%) | 47 (14.9%) |
| 26 to 34 Years | 257 (89.5%) | 30 (10.4%) |
| 35 to 44 Years | 430 (86.9%) | 65 (13.1%) |
| 45 to 54 Years | 395 (98.8%) | 5 (1.3%) |
| 55 to 64 Years | 425 (97.9%) | 9 (2.1%) |
| 65 to 74 Years | 283 (100.0%) | 0 (0.0%) |
| 75 Years and older | 161 (100.0%) | 0 (0.0%) |
| Total | 2,854 (94.4%) | 170 (5.6%) |
Health Insurance Coverage by Citizenship Status in National Park borough
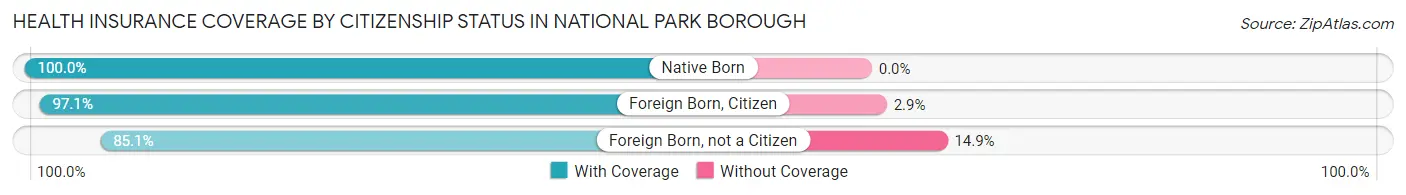
| Citizenship Status | With Coverage | Without Coverage |
| Native Born | 171 (100.0%) | 0 (0.0%) |
| Foreign Born, Citizen | 463 (97.1%) | 14 (2.9%) |
| Foreign Born, not a Citizen | 269 (85.1%) | 47 (14.9%) |
Health Insurance Coverage by Household Income in National Park borough
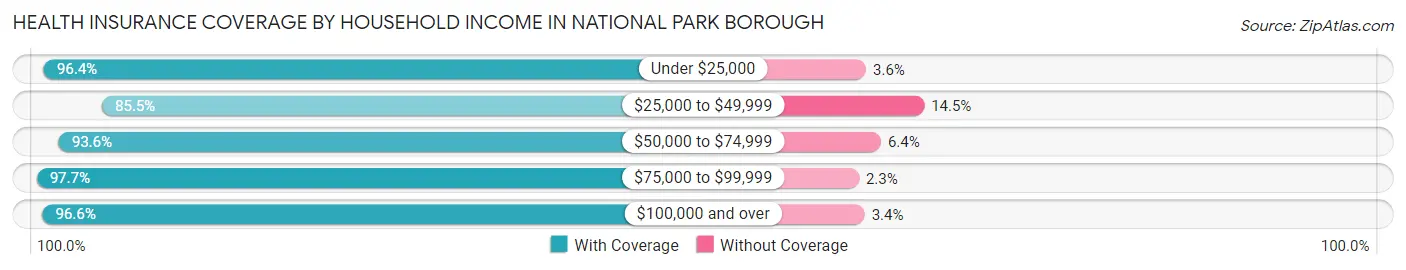
| Household Income | With Coverage | Without Coverage |
| Under $25,000 | 133 (96.4%) | 5 (3.6%) |
| $25,000 to $49,999 | 460 (85.5%) | 78 (14.5%) |
| $50,000 to $74,999 | 394 (93.6%) | 27 (6.4%) |
| $75,000 to $99,999 | 472 (97.7%) | 11 (2.3%) |
| $100,000 and over | 1,379 (96.6%) | 48 (3.4%) |
Public vs Private Health Insurance Coverage by Age in National Park borough
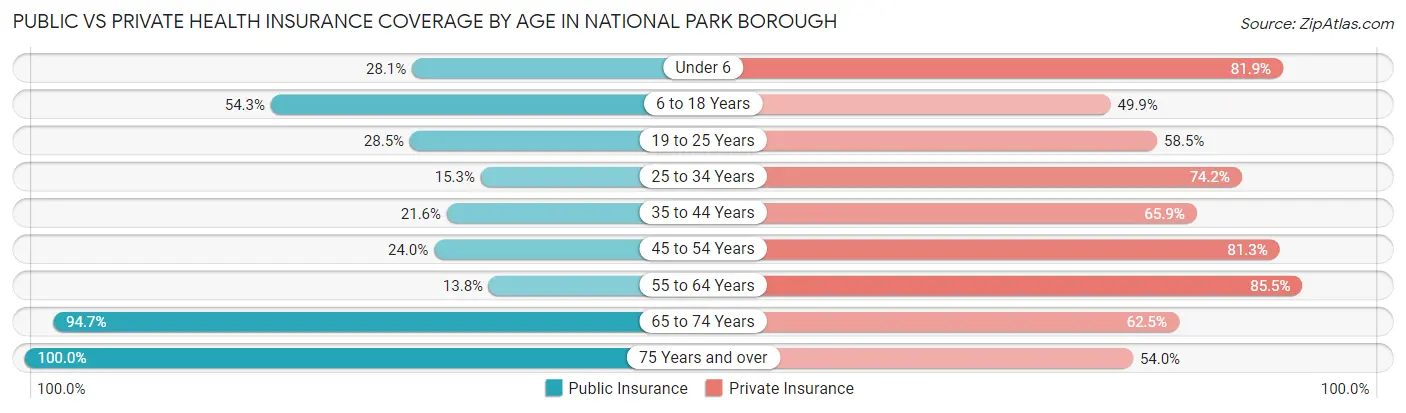
| Age Bracket | Public Insurance | Private Insurance |
| Under 6 | 48 (28.1%) | 140 (81.9%) |
| 6 to 18 Years | 259 (54.3%) | 238 (49.9%) |
| 19 to 25 Years | 90 (28.5%) | 185 (58.5%) |
| 25 to 34 Years | 44 (15.3%) | 213 (74.2%) |
| 35 to 44 Years | 107 (21.6%) | 326 (65.9%) |
| 45 to 54 Years | 96 (24.0%) | 325 (81.2%) |
| 55 to 64 Years | 60 (13.8%) | 371 (85.5%) |
| 65 to 74 Years | 268 (94.7%) | 177 (62.5%) |
| 75 Years and over | 161 (100.0%) | 87 (54.0%) |
| Total | 1,133 (37.5%) | 2,062 (68.2%) |
Disability Status by Sex by Age in National Park borough
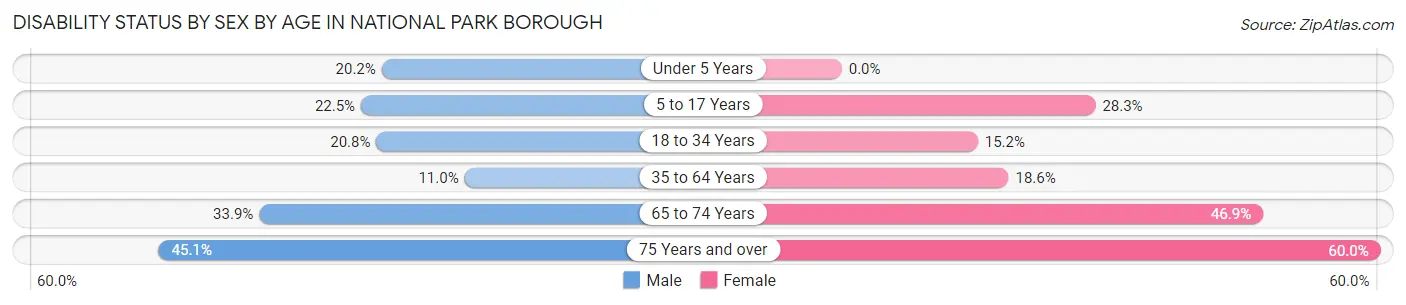
| Age Bracket | Male | Female |
| Under 5 Years | 17 (20.2%) | 0 (0.0%) |
| 5 to 17 Years | 55 (22.5%) | 63 (28.2%) |
| 18 to 34 Years | 75 (20.8%) | 45 (15.1%) |
| 35 to 64 Years | 74 (11.0%) | 122 (18.6%) |
| 65 to 74 Years | 41 (33.9%) | 76 (46.9%) |
| 75 Years and over | 32 (45.1%) | 54 (60.0%) |
Disability Class by Sex by Age in National Park borough
Disability Class: Hearing Difficulty
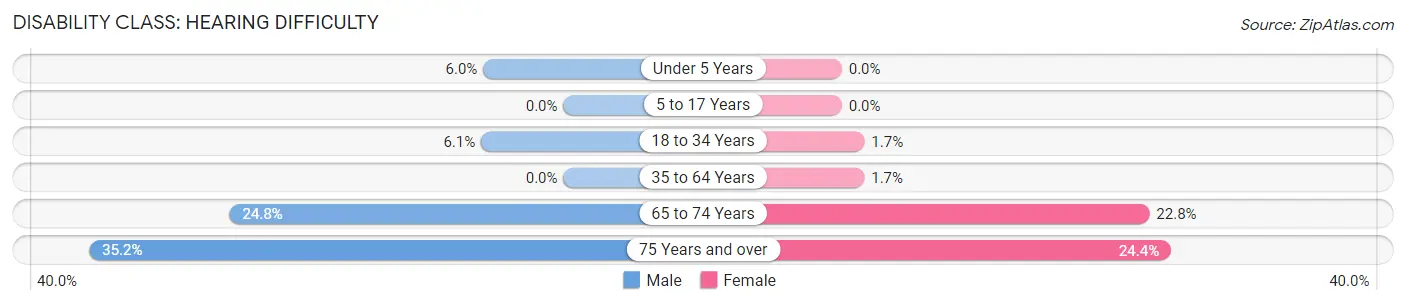
| Age Bracket | Male | Female |
| Under 5 Years | 5 (5.9%) | 0 (0.0%) |
| 5 to 17 Years | 0 (0.0%) | 0 (0.0%) |
| 18 to 34 Years | 22 (6.1%) | 5 (1.7%) |
| 35 to 64 Years | 0 (0.0%) | 11 (1.7%) |
| 65 to 74 Years | 30 (24.8%) | 37 (22.8%) |
| 75 Years and over | 25 (35.2%) | 22 (24.4%) |
Disability Class: Vision Difficulty
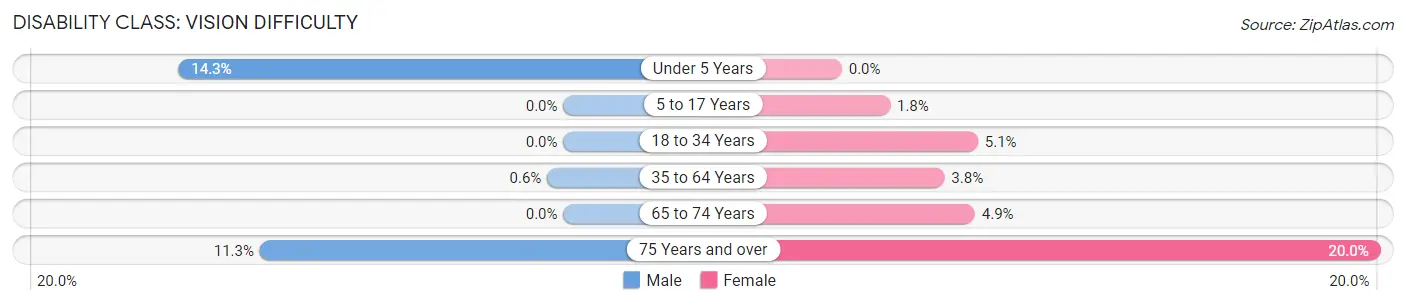
| Age Bracket | Male | Female |
| Under 5 Years | 12 (14.3%) | 0 (0.0%) |
| 5 to 17 Years | 0 (0.0%) | 4 (1.8%) |
| 18 to 34 Years | 0 (0.0%) | 15 (5.1%) |
| 35 to 64 Years | 4 (0.6%) | 25 (3.8%) |
| 65 to 74 Years | 0 (0.0%) | 8 (4.9%) |
| 75 Years and over | 8 (11.3%) | 18 (20.0%) |
Disability Class: Cognitive Difficulty
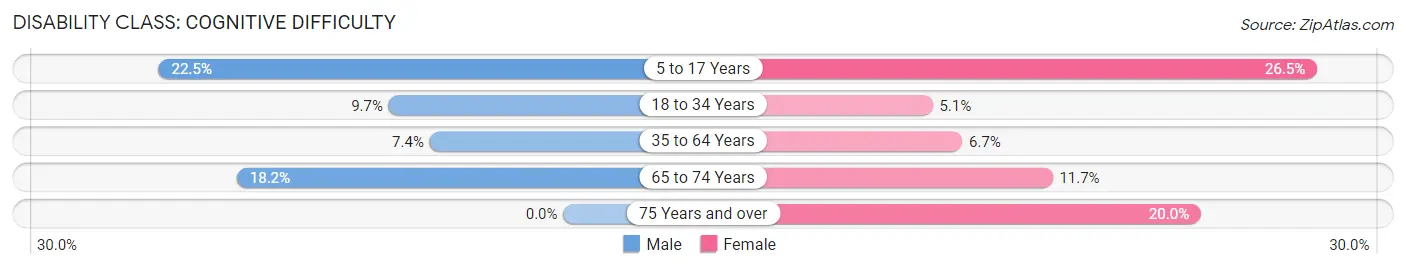
| Age Bracket | Male | Female |
| 5 to 17 Years | 55 (22.5%) | 59 (26.5%) |
| 18 to 34 Years | 35 (9.7%) | 15 (5.1%) |
| 35 to 64 Years | 50 (7.4%) | 44 (6.7%) |
| 65 to 74 Years | 22 (18.2%) | 19 (11.7%) |
| 75 Years and over | 0 (0.0%) | 18 (20.0%) |
Disability Class: Ambulatory Difficulty
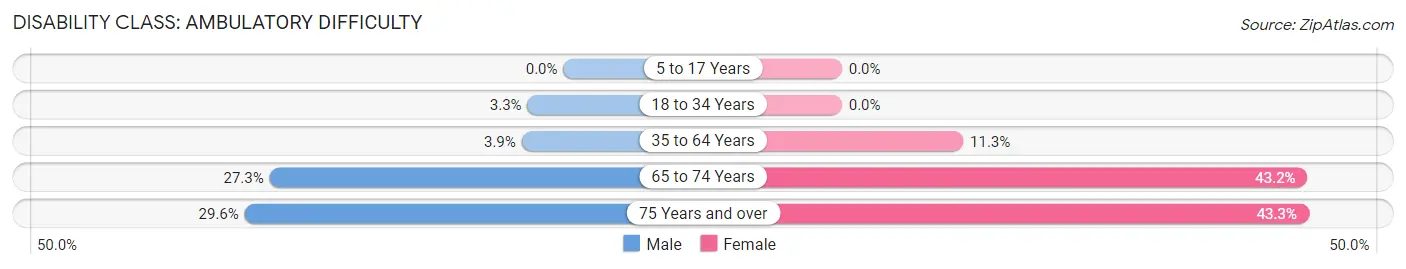
| Age Bracket | Male | Female |
| 5 to 17 Years | 0 (0.0%) | 0 (0.0%) |
| 18 to 34 Years | 12 (3.3%) | 0 (0.0%) |
| 35 to 64 Years | 26 (3.9%) | 74 (11.3%) |
| 65 to 74 Years | 33 (27.3%) | 70 (43.2%) |
| 75 Years and over | 21 (29.6%) | 39 (43.3%) |
Disability Class: Self-Care Difficulty
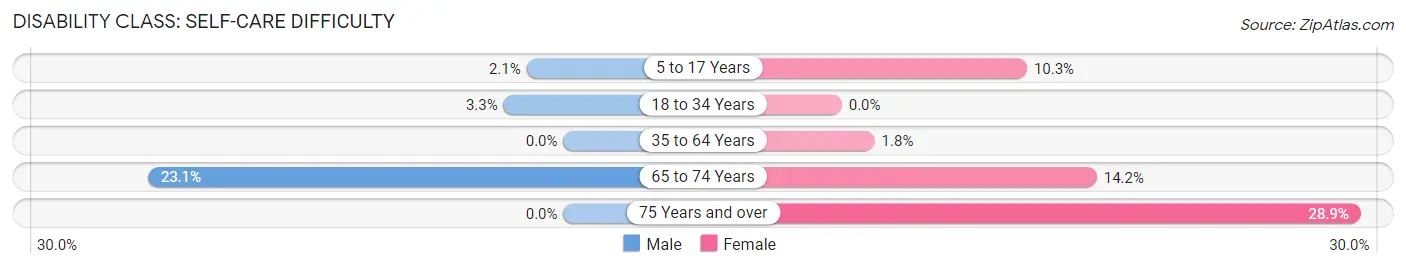
| Age Bracket | Male | Female |
| 5 to 17 Years | 5 (2.1%) | 23 (10.3%) |
| 18 to 34 Years | 12 (3.3%) | 0 (0.0%) |
| 35 to 64 Years | 0 (0.0%) | 12 (1.8%) |
| 65 to 74 Years | 28 (23.1%) | 23 (14.2%) |
| 75 Years and over | 0 (0.0%) | 26 (28.9%) |
Technology Access in National Park borough
Computing Device Access in National Park borough
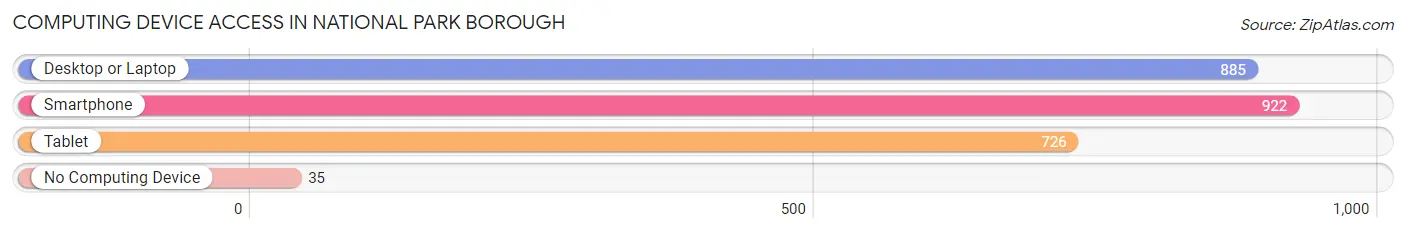
| Device Type | # Households | % Households |
| Desktop or Laptop | 885 | 84.4% |
| Smartphone | 922 | 87.9% |
| Tablet | 726 | 69.2% |
| No Computing Device | 35 | 3.3% |
| Total | 1,049 | 100.0% |
Internet Access in National Park borough
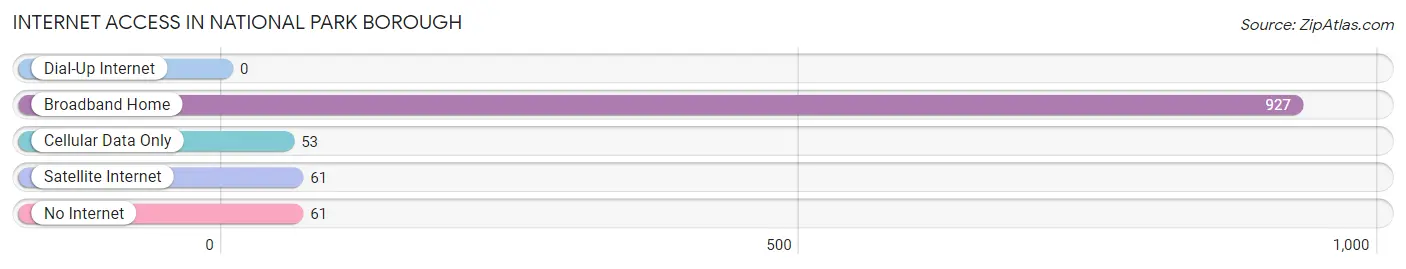
| Internet Type | # Households | % Households |
| Dial-Up Internet | 0 | 0.0% |
| Broadband Home | 927 | 88.4% |
| Cellular Data Only | 53 | 5.1% |
| Satellite Internet | 61 | 5.8% |
| No Internet | 61 | 5.8% |
| Total | 1,049 | 100.0% |
National Park borough Summary
National Park Borough is a borough located in Gloucester County, New Jersey, United States. As of the 2010 United States Census, the borough's population was 1,845, reflecting an increase of 441 (+31.4%) from the 1,404 counted in the 2000 Census, which had in turn increased by 441 (+31.4%) from the 963 counted in the 1990 Census.
History
National Park was incorporated as a borough by an act of the New Jersey Legislature on March 8, 1905, from portions of Mantua Township, based on the results of a referendum held on April 4, 1905. The borough was named for the National Park Seminary, a girls' school that operated in the area from 1894 to 1942.
Geography
According to the United States Census Bureau, the borough had a total area of 0.945 square miles (2.447km^2), including 0.944 square miles (2.444km^2) of land and 0.001 square miles (0.003km^2) of water (0.11%).
The borough borders Mantua Township and Wenonah
Demographics
As of the 2010 United States Census, there were 1,845 people, 690 households, and 486.9 families residing in the borough. The population density was 1,955.3 per square mile (754.7/km^2). There were 717 housing units at an average density of 759.3 per square mile (293.3/km^2). The racial makeup of the borough was 87.90% (1,631) White, 6.90% (127) Black or African American, 0.11% (2) Native American, 1.45% (27) Asian, 0.00% (0) Pacific Islander, 1.76% (33) from other races, and 2.88% (53) from two or more races. Hispanic or Latino of any race were 6.45% (119) of the population.
There were 690 households, out of which 33.0% had children under the age of 18 living with them, 51.3% were married couples living together, 13.0% had a female householder with no husband present, and 30.3% were non-families. 24.3% of all households were made up of individuals, and 8.3% had someone living alone who was 65 years of age or older. The average household size was 2.67 and the average family size was 3.20.
In the borough, the population was spread out, with 24.2% under the age of 18, 8.2% from 18 to 24, 29.2% from 25 to 44, 26.2% from 45 to 64, and 12.2% who were 65 years of age or older. The median age was 38.2 years. For every 100 females there were 95.2 males. For every 100 females ages 18 and older there were 92.2 males.
The Census Bureau's 2006-2010 American Community Survey showed that (in 2010 inflation-adjusted dollars) median household income was $68,750 (with a margin of error of +/- $9,945) and the median family income was $76,250 (+/- $14,945). Males had a median income of $50,000 (+/- $7,945) versus $41,250 (+/- $7,945) for females. The per capita income for the borough was $30,945 (+/- $4,945). About 4.2% of families and 5.3% of the population were below the poverty line, including 6.3% of those under age 18 and 4.2% of those age 65 or over.
Economy
National Park Borough is home to a variety of businesses, including retail stores, restaurants, and professional services. The borough is also home to a number of industrial and manufacturing businesses, including a plastics manufacturer, a metal fabricator, and a printing company.
The borough is served by the Gloucester County Library System, which operates a branch in the borough. The library offers a variety of services, including books, magazines, DVDs, and computer access.
The borough is also home to a number of parks and recreational facilities, including a public pool, a playground, and a skate park. The borough also hosts a number of annual events, including a Fourth of July celebration, a Halloween parade, and a Christmas tree lighting.
The borough is served by the National Park School District, which operates two elementary schools, a middle school, and a high school. The district also operates a number of extracurricular activities, including sports teams, clubs, and after-school programs.
Common Questions
What is Per Capita Income in National Park borough?
Per Capita income in National Park borough is $37,065.
What is the Median Family Income in National Park borough?
Median Family Income in National Park borough is $88,929.
What is the Median Household income in National Park borough?
Median Household Income in National Park borough is $83,125.
What is Income or Wage Gap in National Park borough?
Income or Wage Gap in National Park borough is 27.3%.
Women in National Park borough earn 72.7 cents for every dollar earned by a man.
What is Inequality or Gini Index in National Park borough?
Inequality or Gini Index in National Park borough is 0.41.
What is the Total Population of National Park borough?
Total Population of National Park borough is 3,028.
What is the Total Male Population of National Park borough?
Total Male Population of National Park borough is 1,556.
What is the Total Female Population of National Park borough?
Total Female Population of National Park borough is 1,472.
What is the Ratio of Males per 100 Females in National Park borough?
There are 105.71 Males per 100 Females in National Park borough.
What is the Ratio of Females per 100 Males in National Park borough?
There are 94.60 Females per 100 Males in National Park borough.
What is the Median Population Age in National Park borough?
Median Population Age in National Park borough is 40.8 Years.
What is the Average Family Size in National Park borough
Average Family Size in National Park borough is 3.2 People.
What is the Average Household Size in National Park borough
Average Household Size in National Park borough is 2.9 People.
How Large is the Labor Force in National Park borough?
There are 1,678 People in the Labor Forcein in National Park borough.
What is the Percentage of People in the Labor Force in National Park borough?
65.7% of People are in the Labor Force in National Park borough.
What is the Unemployment Rate in National Park borough?
Unemployment Rate in National Park borough is 7.2%.