Oakland borough, NJ Map & Demographics
Oakland borough Overview
$62,874
PER CAPITA INCOME
$175,242
AVG FAMILY INCOME
$162,848
AVG HOUSEHOLD INCOME
35.6%
WAGE / INCOME GAP [ % ]
64.4¢/ $1
WAGE / INCOME GAP [ $ ]
0.36
INEQUALITY / GINI INDEX
12,734
TOTAL POPULATION
6,497
MALE POPULATION
6,237
FEMALE POPULATION
104.17
MALES / 100 FEMALES
96.00
FEMALES / 100 MALES
41.9
MEDIAN AGE
3.2
AVG FAMILY SIZE
2.9
AVG HOUSEHOLD SIZE
7,281
LABOR FORCE [ PEOPLE ]
70.3%
PERCENT IN LABOR FORCE
5.3%
UNEMPLOYMENT RATE
Income in Oakland borough
Income Overview in Oakland borough
Per Capita Income in Oakland borough is $62,874, while median incomes of families and households are $175,242 and $162,848 respectively.
| Characteristic | Number | Measure |
| Per Capita Income | 12,734 | $62,874 |
| Median Family Income | 3,556 | $175,242 |
| Mean Family Income | 3,556 | $193,057 |
| Median Household Income | 4,381 | $162,848 |
| Mean Household Income | 4,381 | $179,284 |
| Income Deficit | 3,556 | $0 |
| Wage / Income Gap (%) | 12,734 | 35.65% |
| Wage / Income Gap ($) | 12,734 | 64.35¢ per $1 |
| Gini / Inequality Index | 12,734 | 0.36 |
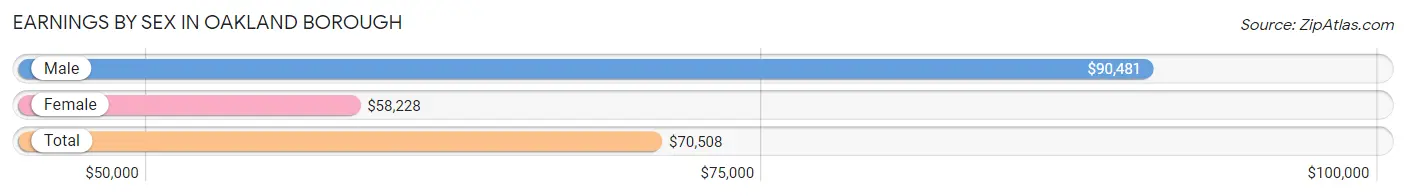
Earnings by Sex in Oakland borough
Average Earnings in Oakland borough are $70,508, $90,481 for men and $58,228 for women, a difference of 35.6%.
| Sex | Number | Average Earnings |
| Male | 4,026 (53.1%) | $90,481 |
| Female | 3,558 (46.9%) | $58,228 |
| Total | 7,584 (100.0%) | $70,508 |
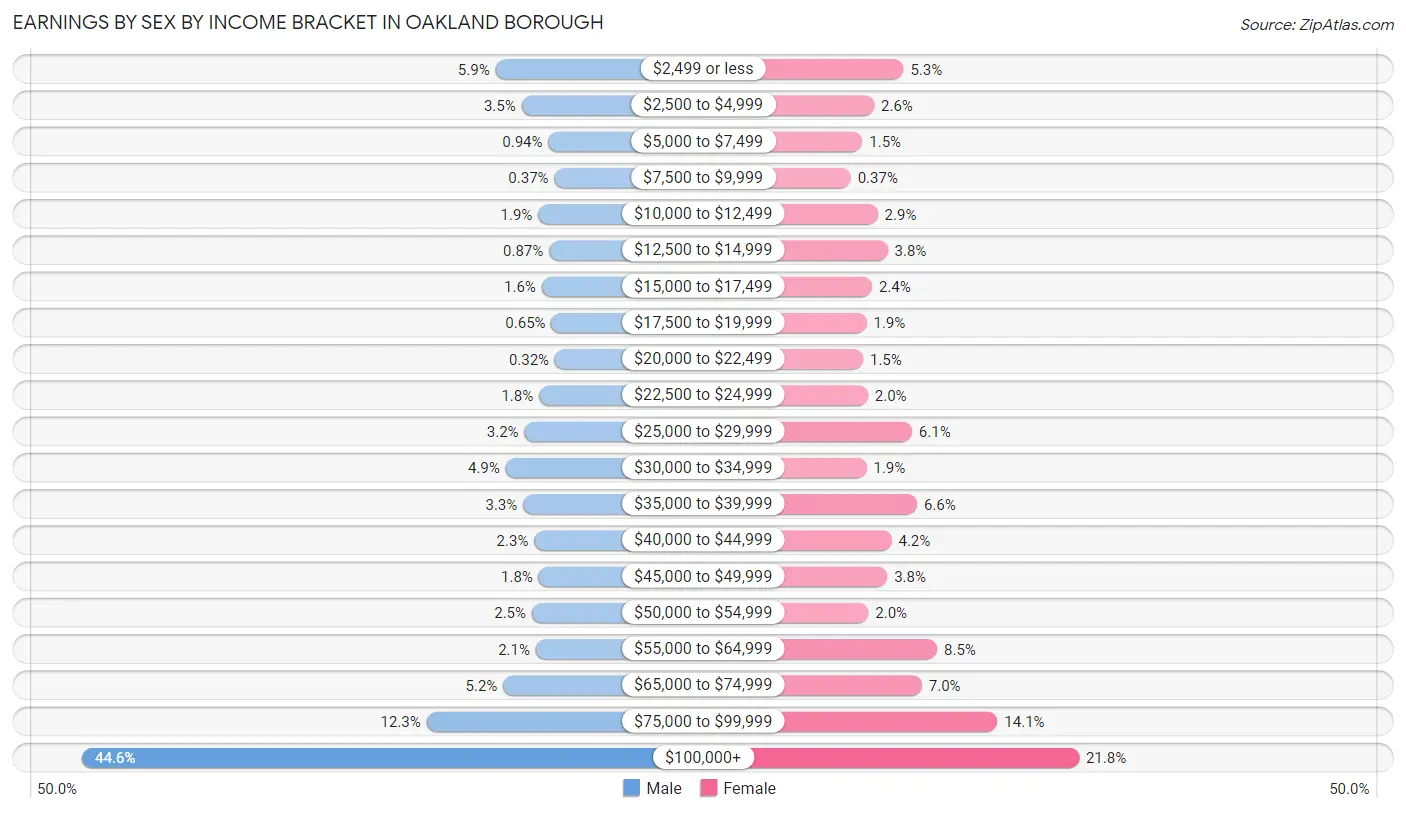
Earnings by Sex by Income Bracket in Oakland borough
The most common earnings brackets in Oakland borough are $100,000+ for men (1,796 | 44.6%) and $100,000+ for women (774 | 21.7%).
| Income | Male | Female |
| $2,499 or less | 237 (5.9%) | 189 (5.3%) |
| $2,500 to $4,999 | 139 (3.5%) | 91 (2.6%) |
| $5,000 to $7,499 | 38 (0.9%) | 52 (1.5%) |
| $7,500 to $9,999 | 15 (0.4%) | 13 (0.4%) |
| $10,000 to $12,499 | 76 (1.9%) | 103 (2.9%) |
| $12,500 to $14,999 | 35 (0.9%) | 136 (3.8%) |
| $15,000 to $17,499 | 63 (1.6%) | 84 (2.4%) |
| $17,500 to $19,999 | 26 (0.6%) | 66 (1.8%) |
| $20,000 to $22,499 | 13 (0.3%) | 54 (1.5%) |
| $22,500 to $24,999 | 73 (1.8%) | 70 (2.0%) |
| $25,000 to $29,999 | 128 (3.2%) | 217 (6.1%) |
| $30,000 to $34,999 | 199 (4.9%) | 66 (1.8%) |
| $35,000 to $39,999 | 133 (3.3%) | 234 (6.6%) |
| $40,000 to $44,999 | 91 (2.3%) | 149 (4.2%) |
| $45,000 to $49,999 | 74 (1.8%) | 135 (3.8%) |
| $50,000 to $54,999 | 100 (2.5%) | 72 (2.0%) |
| $55,000 to $64,999 | 85 (2.1%) | 301 (8.5%) |
| $65,000 to $74,999 | 208 (5.2%) | 250 (7.0%) |
| $75,000 to $99,999 | 497 (12.3%) | 502 (14.1%) |
| $100,000+ | 1,796 (44.6%) | 774 (21.7%) |
| Total | 4,026 (100.0%) | 3,558 (100.0%) |
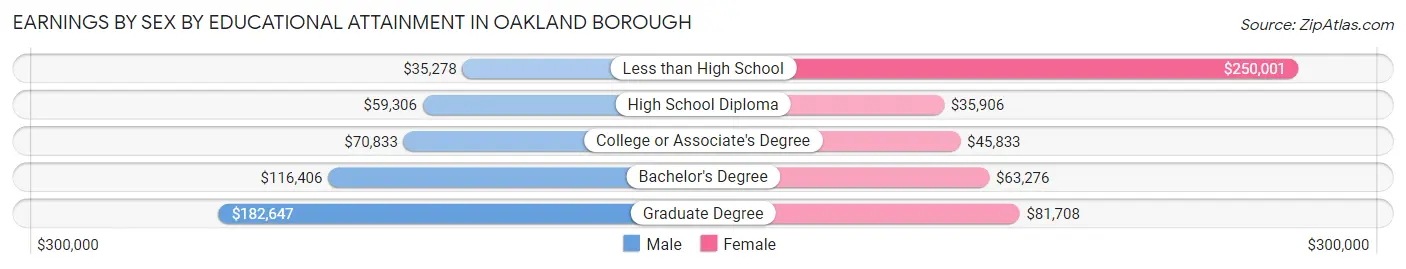
Earnings by Sex by Educational Attainment in Oakland borough
Average earnings in Oakland borough are $100,300 for men and $61,815 for women, a difference of 38.4%. Men with an educational attainment of graduate degree enjoy the highest average annual earnings of $182,647, while those with less than high school education earn the least with $35,278. Women with an educational attainment of less than high school earn the most with the average annual earnings of $250,001, while those with high school diploma education have the smallest earnings of $35,906.
| Educational Attainment | Male Income | Female Income |
| Less than High School | $35,278 | $250,001 |
| High School Diploma | $59,306 | $35,906 |
| College or Associate's Degree | $70,833 | $45,833 |
| Bachelor's Degree | $116,406 | $63,276 |
| Graduate Degree | $182,647 | $81,708 |
| Total | $100,300 | $61,815 |
Family Income in Oakland borough
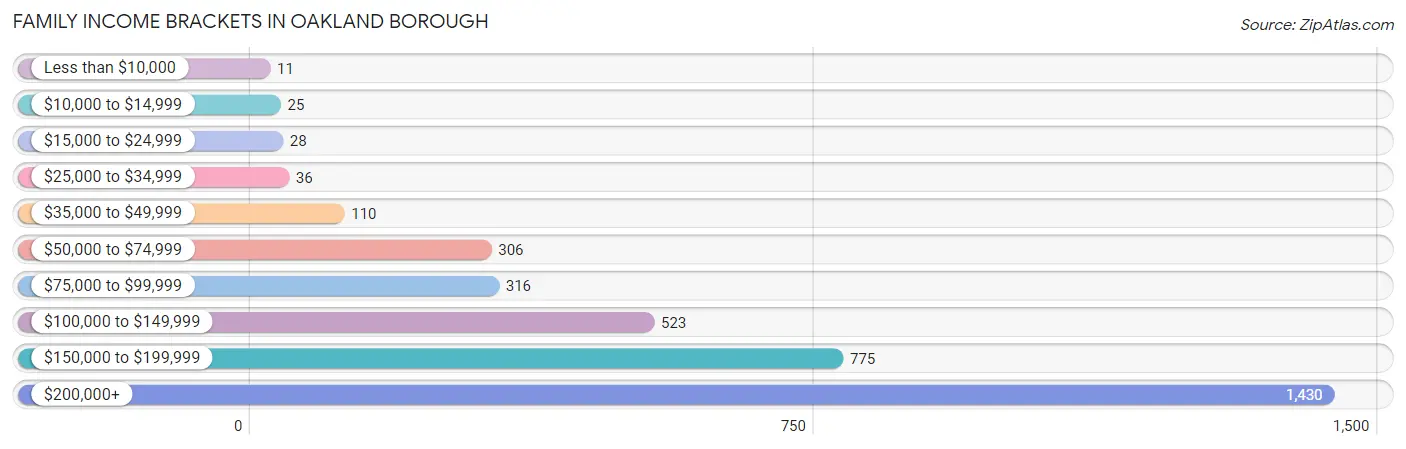
Family Income Brackets in Oakland borough
According to the Oakland borough family income data, there are 1,430 families falling into the $200,000+ income range, which is the most common income bracket and makes up 40.2% of all families. Conversely, the less than $10,000 income bracket is the least frequent group with only 11 families (0.3%) belonging to this category.
| Income Bracket | # Families | % Families |
| Less than $10,000 | 11 | 0.3% |
| $10,000 to $14,999 | 25 | 0.7% |
| $15,000 to $24,999 | 28 | 0.8% |
| $25,000 to $34,999 | 36 | 1.0% |
| $35,000 to $49,999 | 110 | 3.1% |
| $50,000 to $74,999 | 306 | 8.6% |
| $75,000 to $99,999 | 316 | 8.9% |
| $100,000 to $149,999 | 523 | 14.7% |
| $150,000 to $199,999 | 775 | 21.8% |
| $200,000+ | 1,430 | 40.2% |
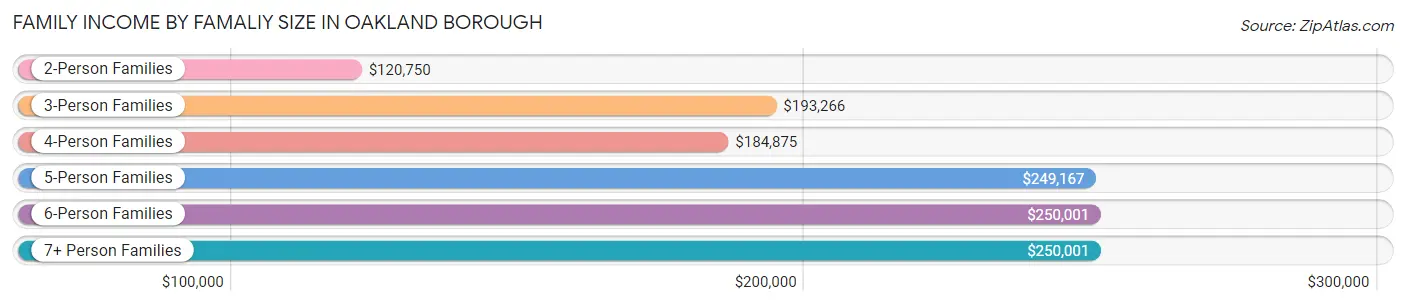
Family Income by Famaliy Size in Oakland borough
6-person families (61 | 1.7%) account for the highest median family income in Oakland borough with $250,001 per family, while 3-person families (1,149 | 32.3%) have the highest median income of $64,422 per family member.
| Income Bracket | # Families | Median Income |
| 2-Person Families | 1,180 (33.2%) | $120,750 |
| 3-Person Families | 1,149 (32.3%) | $193,266 |
| 4-Person Families | 929 (26.1%) | $184,875 |
| 5-Person Families | 214 (6.0%) | $249,167 |
| 6-Person Families | 61 (1.7%) | $250,001 |
| 7+ Person Families | 23 (0.6%) | $250,001 |
| Total | 3,556 (100.0%) | $175,242 |
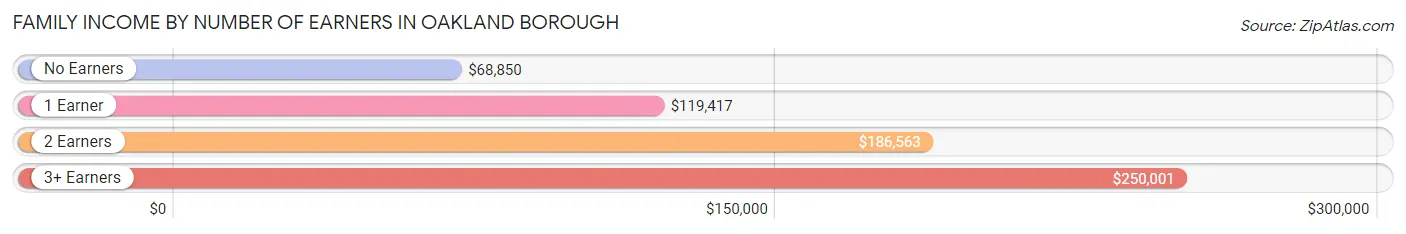
Family Income by Number of Earners in Oakland borough
The median family income in Oakland borough is $175,242, with families comprising 3+ earners (720) having the highest median family income of $250,001, while families with no earners (271) have the lowest median family income of $68,850, accounting for 20.3% and 7.6% of families, respectively.
| Number of Earners | # Families | Median Income |
| No Earners | 271 (7.6%) | $68,850 |
| 1 Earner | 757 (21.3%) | $119,417 |
| 2 Earners | 1,808 (50.8%) | $186,563 |
| 3+ Earners | 720 (20.3%) | $250,001 |
| Total | 3,556 (100.0%) | $175,242 |
Household Income in Oakland borough
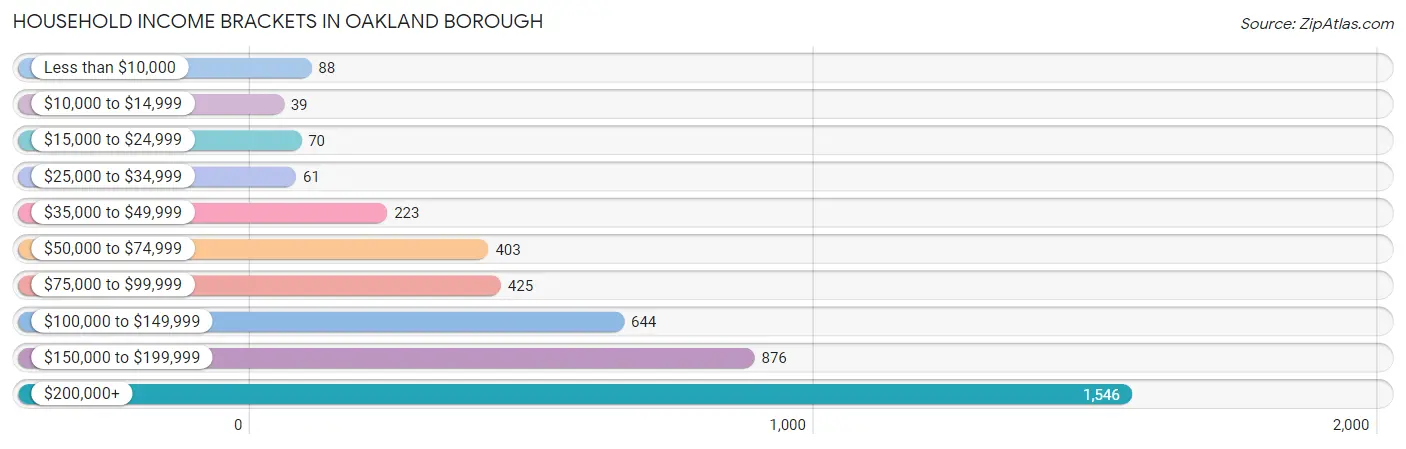
Household Income Brackets in Oakland borough
With 1,546 households falling in the category, the $200,000+ income range is the most frequent in Oakland borough, accounting for 35.3% of all households. In contrast, only 39 households (0.9%) fall into the $10,000 to $14,999 income bracket, making it the least populous group.
| Income Bracket | # Households | % Households |
| Less than $10,000 | 88 | 2.0% |
| $10,000 to $14,999 | 39 | 0.9% |
| $15,000 to $24,999 | 70 | 1.6% |
| $25,000 to $34,999 | 61 | 1.4% |
| $35,000 to $49,999 | 223 | 5.1% |
| $50,000 to $74,999 | 403 | 9.2% |
| $75,000 to $99,999 | 425 | 9.7% |
| $100,000 to $149,999 | 644 | 14.7% |
| $150,000 to $199,999 | 876 | 20.0% |
| $200,000+ | 1,546 | 35.3% |
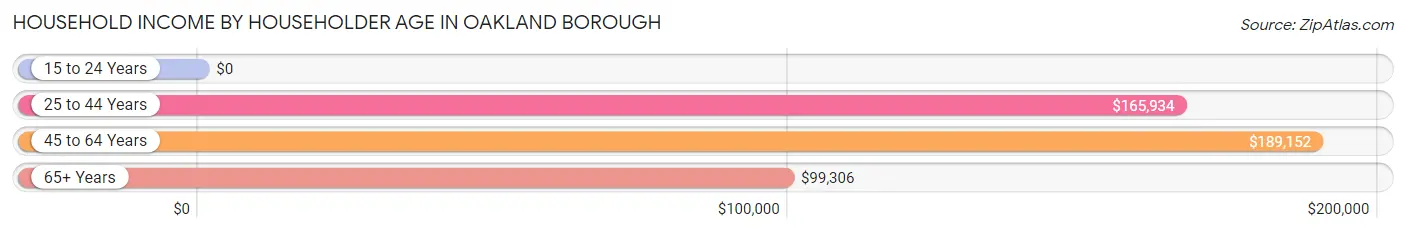
Household Income by Householder Age in Oakland borough
The median household income in Oakland borough is $162,848, with the highest median household income of $189,152 found in the 45 to 64 years age bracket for the primary householder. A total of 1,999 households (45.6%) fall into this category. Meanwhile, the 15 to 24 years age bracket for the primary householder has the lowest median household income of $0, with 47 households (1.1%) in this group.
| Income Bracket | # Households | Median Income |
| 15 to 24 Years | 47 (1.1%) | $0 |
| 25 to 44 Years | 1,284 (29.3%) | $165,934 |
| 45 to 64 Years | 1,999 (45.6%) | $189,152 |
| 65+ Years | 1,051 (24.0%) | $99,306 |
| Total | 4,381 (100.0%) | $162,848 |
Poverty in Oakland borough
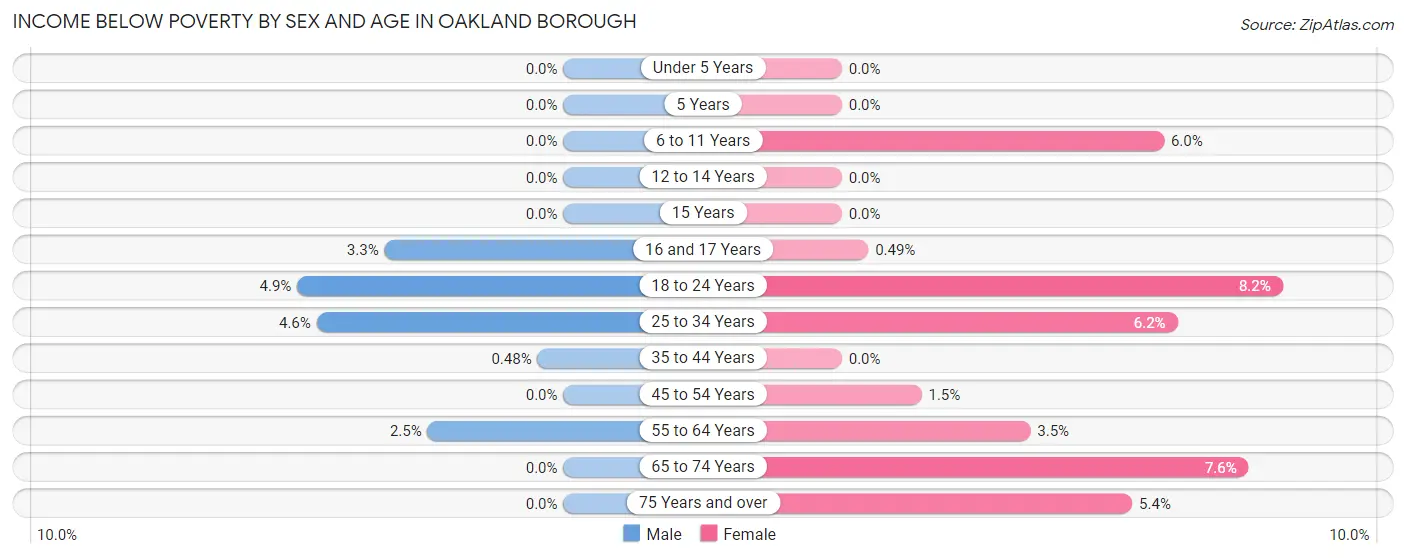
Income Below Poverty by Sex and Age in Oakland borough
With 1.4% poverty level for males and 3.5% for females among the residents of Oakland borough, 18 to 24 year old males and 18 to 24 year old females are the most vulnerable to poverty, with 25 males (4.9%) and 35 females (8.2%) in their respective age groups living below the poverty level.
| Age Bracket | Male | Female |
| Under 5 Years | 0 (0.0%) | 0 (0.0%) |
| 5 Years | 0 (0.0%) | 0 (0.0%) |
| 6 to 11 Years | 0 (0.0%) | 18 (6.0%) |
| 12 to 14 Years | 0 (0.0%) | 0 (0.0%) |
| 15 Years | 0 (0.0%) | 0 (0.0%) |
| 16 and 17 Years | 10 (3.3%) | 1 (0.5%) |
| 18 to 24 Years | 25 (4.9%) | 35 (8.2%) |
| 25 to 34 Years | 25 (4.6%) | 47 (6.2%) |
| 35 to 44 Years | 4 (0.5%) | 0 (0.0%) |
| 45 to 54 Years | 0 (0.0%) | 14 (1.5%) |
| 55 to 64 Years | 26 (2.5%) | 30 (3.5%) |
| 65 to 74 Years | 0 (0.0%) | 45 (7.5%) |
| 75 Years and over | 0 (0.0%) | 22 (5.4%) |
| Total | 90 (1.4%) | 212 (3.5%) |
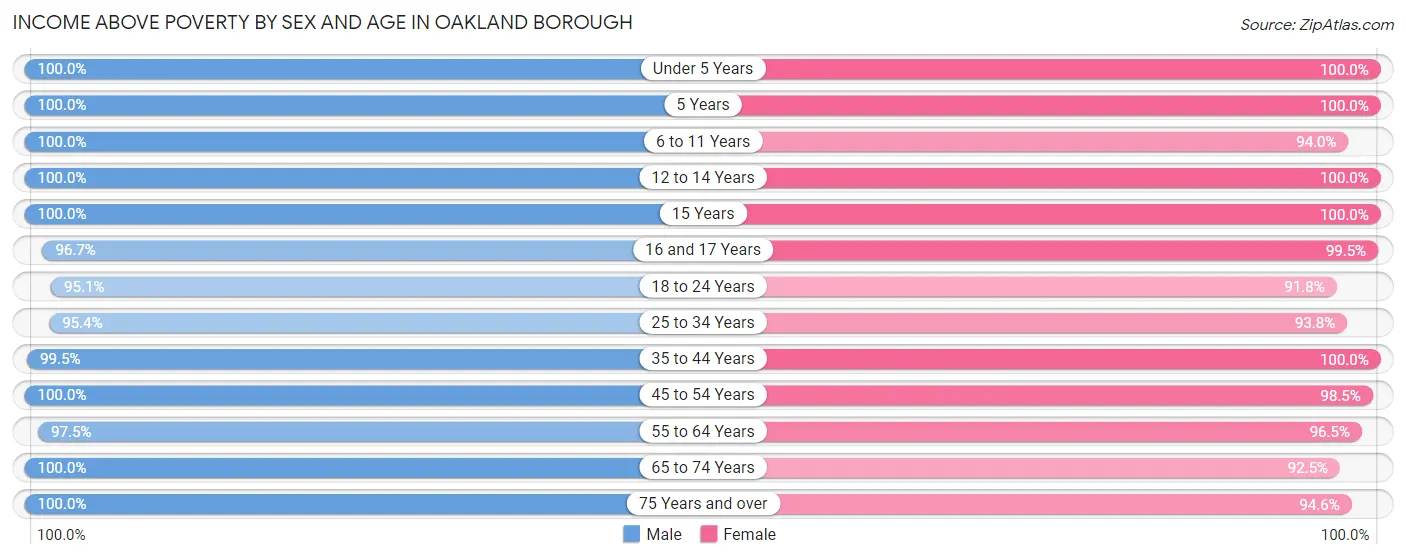
Income Above Poverty by Sex and Age in Oakland borough
According to the poverty statistics in Oakland borough, males aged under 5 years and females aged under 5 years are the age groups that are most secure financially, with 100.0% of males and 100.0% of females in these age groups living above the poverty line.
| Age Bracket | Male | Female |
| Under 5 Years | 401 (100.0%) | 316 (100.0%) |
| 5 Years | 58 (100.0%) | 71 (100.0%) |
| 6 to 11 Years | 378 (100.0%) | 283 (94.0%) |
| 12 to 14 Years | 257 (100.0%) | 275 (100.0%) |
| 15 Years | 103 (100.0%) | 119 (100.0%) |
| 16 and 17 Years | 291 (96.7%) | 203 (99.5%) |
| 18 to 24 Years | 481 (95.1%) | 393 (91.8%) |
| 25 to 34 Years | 521 (95.4%) | 708 (93.8%) |
| 35 to 44 Years | 837 (99.5%) | 834 (100.0%) |
| 45 to 54 Years | 1,102 (100.0%) | 933 (98.5%) |
| 55 to 64 Years | 1,007 (97.5%) | 827 (96.5%) |
| 65 to 74 Years | 484 (100.0%) | 551 (92.4%) |
| 75 Years and over | 322 (100.0%) | 386 (94.6%) |
| Total | 6,242 (98.6%) | 5,899 (96.5%) |
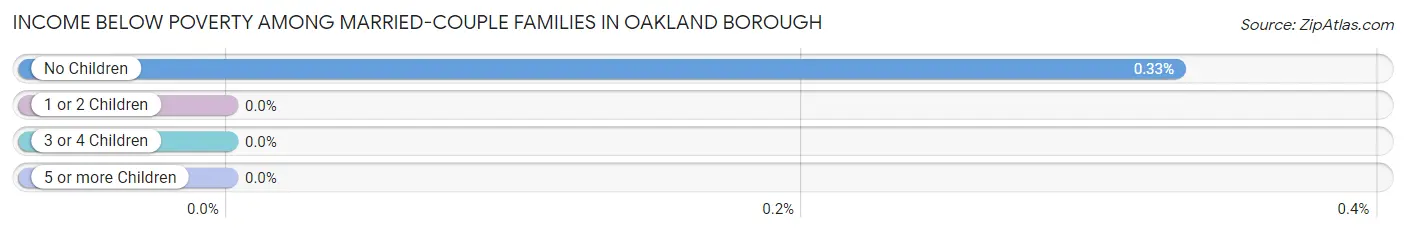
Income Below Poverty Among Married-Couple Families in Oakland borough
The poverty statistics for married-couple families in Oakland borough show that 0.2% or 5 of the total 3,040 families live below the poverty line. Families with no children have the highest poverty rate of 0.3%, comprising of 5 families. On the other hand, families with 1 or 2 children have the lowest poverty rate of 0.0%, which includes 0 families.
| Children | Above Poverty | Below Poverty |
| No Children | 1,526 (99.7%) | 5 (0.3%) |
| 1 or 2 Children | 1,406 (100.0%) | 0 (0.0%) |
| 3 or 4 Children | 103 (100.0%) | 0 (0.0%) |
| 5 or more Children | 0 (0.0%) | 0 (0.0%) |
| Total | 3,035 (99.8%) | 5 (0.2%) |
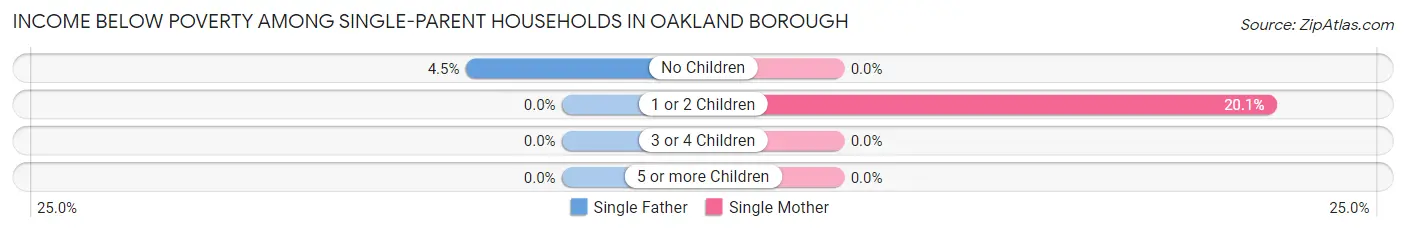
Income Below Poverty Among Single-Parent Households in Oakland borough
According to the poverty data in Oakland borough, 3.4% or 10 single-father households and 13.0% or 29 single-mother households are living below the poverty line. Among single-father households, those with no children have the highest poverty rate, with 10 households (4.5%) experiencing poverty. Likewise, among single-mother households, those with 1 or 2 children have the highest poverty rate, with 29 households (20.1%) falling below the poverty line.
| Children | Single Father | Single Mother |
| No Children | 10 (4.5%) | 0 (0.0%) |
| 1 or 2 Children | 0 (0.0%) | 29 (20.1%) |
| 3 or 4 Children | 0 (0.0%) | 0 (0.0%) |
| 5 or more Children | 0 (0.0%) | 0 (0.0%) |
| Total | 10 (3.4%) | 29 (13.0%) |
Income Below Poverty Among Married-Couple vs Single-Parent Households in Oakland borough
The poverty data for Oakland borough shows that 5 of the married-couple family households (0.2%) and 39 of the single-parent households (7.6%) are living below the poverty level. Within the married-couple family households, those with no children have the highest poverty rate, with 5 households (0.3%) falling below the poverty line. Among the single-parent households, those with 1 or 2 children have the highest poverty rate, with 29 household (17.2%) living below poverty.
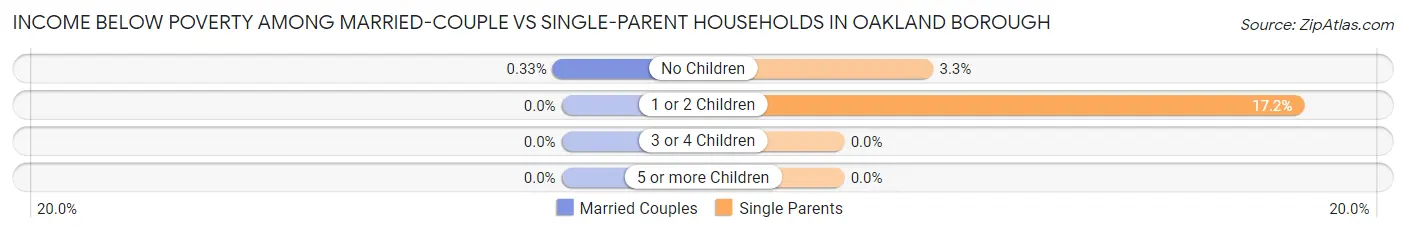
| Children | Married-Couple Families | Single-Parent Households |
| No Children | 5 (0.3%) | 10 (3.3%) |
| 1 or 2 Children | 0 (0.0%) | 29 (17.2%) |
| 3 or 4 Children | 0 (0.0%) | 0 (0.0%) |
| 5 or more Children | 0 (0.0%) | 0 (0.0%) |
| Total | 5 (0.2%) | 39 (7.6%) |
Race in Oakland borough
The most populous races in Oakland borough are White / Caucasian (10,909 | 85.7%), Hispanic or Latino (1,491 | 11.7%), and Two or more Races (899 | 7.1%).
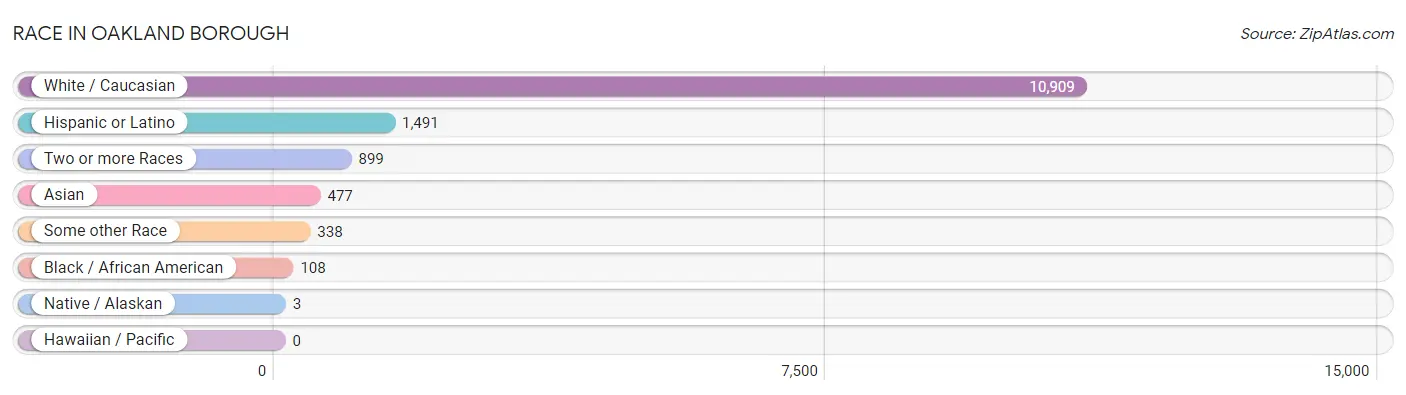
| Race | # Population | % Population |
| Asian | 477 | 3.7% |
| Black / African American | 108 | 0.9% |
| Hawaiian / Pacific | 0 | 0.0% |
| Hispanic or Latino | 1,491 | 11.7% |
| Native / Alaskan | 3 | 0.0% |
| White / Caucasian | 10,909 | 85.7% |
| Two or more Races | 899 | 7.1% |
| Some other Race | 338 | 2.6% |
| Total | 12,734 | 100.0% |
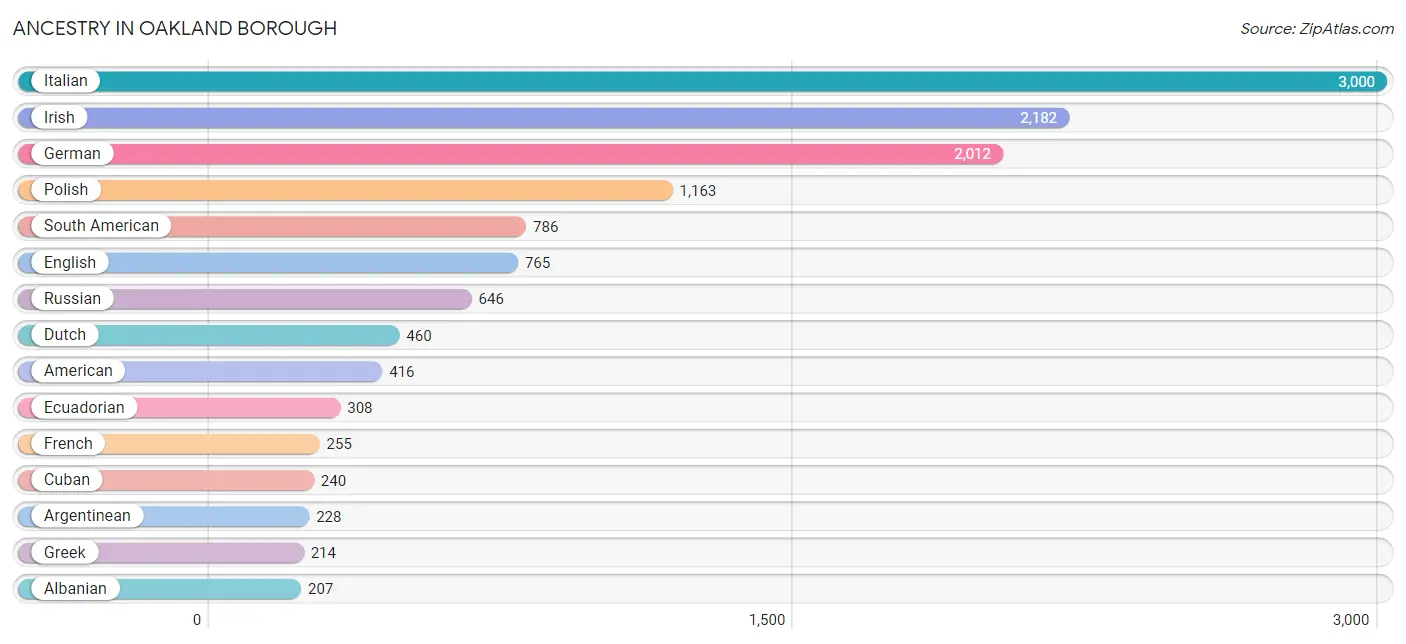
Ancestry in Oakland borough
The most populous ancestries reported in Oakland borough are Italian (3,000 | 23.6%), Irish (2,182 | 17.1%), German (2,012 | 15.8%), Polish (1,163 | 9.1%), and South American (786 | 6.2%), together accounting for 71.8% of all Oakland borough residents.
| Ancestry | # Population | % Population |
| Albanian | 207 | 1.6% |
| Alsatian | 8 | 0.1% |
| American | 416 | 3.3% |
| Arab | 134 | 1.1% |
| Argentinean | 228 | 1.8% |
| Armenian | 31 | 0.2% |
| Australian | 10 | 0.1% |
| Austrian | 138 | 1.1% |
| Belgian | 9 | 0.1% |
| Bhutanese | 9 | 0.1% |
| Blackfeet | 3 | 0.0% |
| British | 60 | 0.5% |
| Burmese | 85 | 0.7% |
| Canadian | 11 | 0.1% |
| Central American | 27 | 0.2% |
| Cherokee | 22 | 0.2% |
| Colombian | 142 | 1.1% |
| Croatian | 69 | 0.5% |
| Cuban | 240 | 1.9% |
| Czech | 71 | 0.6% |
| Czechoslovakian | 27 | 0.2% |
| Danish | 15 | 0.1% |
| Dominican | 35 | 0.3% |
| Dutch | 460 | 3.6% |
| Eastern European | 19 | 0.2% |
| Ecuadorian | 308 | 2.4% |
| English | 765 | 6.0% |
| European | 145 | 1.1% |
| Finnish | 23 | 0.2% |
| French | 255 | 2.0% |
| French American Indian | 8 | 0.1% |
| French Canadian | 26 | 0.2% |
| German | 2,012 | 15.8% |
| Greek | 214 | 1.7% |
| Hungarian | 146 | 1.1% |
| Indian (Asian) | 193 | 1.5% |
| Iranian | 58 | 0.5% |
| Irish | 2,182 | 17.1% |
| Italian | 3,000 | 23.6% |
| Jamaican | 23 | 0.2% |
| Korean | 58 | 0.5% |
| Laotian | 35 | 0.3% |
| Lebanese | 23 | 0.2% |
| Lithuanian | 21 | 0.2% |
| Macedonian | 158 | 1.2% |
| Mexican | 163 | 1.3% |
| Moroccan | 22 | 0.2% |
| Navajo | 22 | 0.2% |
| Nicaraguan | 19 | 0.2% |
| Northern European | 46 | 0.4% |
| Norwegian | 110 | 0.9% |
| Pakistani | 79 | 0.6% |
| Peruvian | 59 | 0.5% |
| Polish | 1,163 | 9.1% |
| Portuguese | 157 | 1.2% |
| Puerto Rican | 182 | 1.4% |
| Romanian | 8 | 0.1% |
| Russian | 646 | 5.1% |
| Salvadoran | 8 | 0.1% |
| Scandinavian | 27 | 0.2% |
| Scotch-Irish | 27 | 0.2% |
| Scottish | 129 | 1.0% |
| Serbian | 29 | 0.2% |
| Slavic | 24 | 0.2% |
| Slovak | 50 | 0.4% |
| South American | 786 | 6.2% |
| Spaniard | 51 | 0.4% |
| Swedish | 81 | 0.6% |
| Swiss | 50 | 0.4% |
| Syrian | 27 | 0.2% |
| Thai | 183 | 1.4% |
| Trinidadian and Tobagonian | 12 | 0.1% |
| Turkish | 45 | 0.4% |
| Ukrainian | 196 | 1.5% |
| Uruguayan | 16 | 0.1% |
| Venezuelan | 33 | 0.3% |
| Welsh | 58 | 0.5% |
| Yugoslavian | 9 | 0.1% | View All 78 Rows |
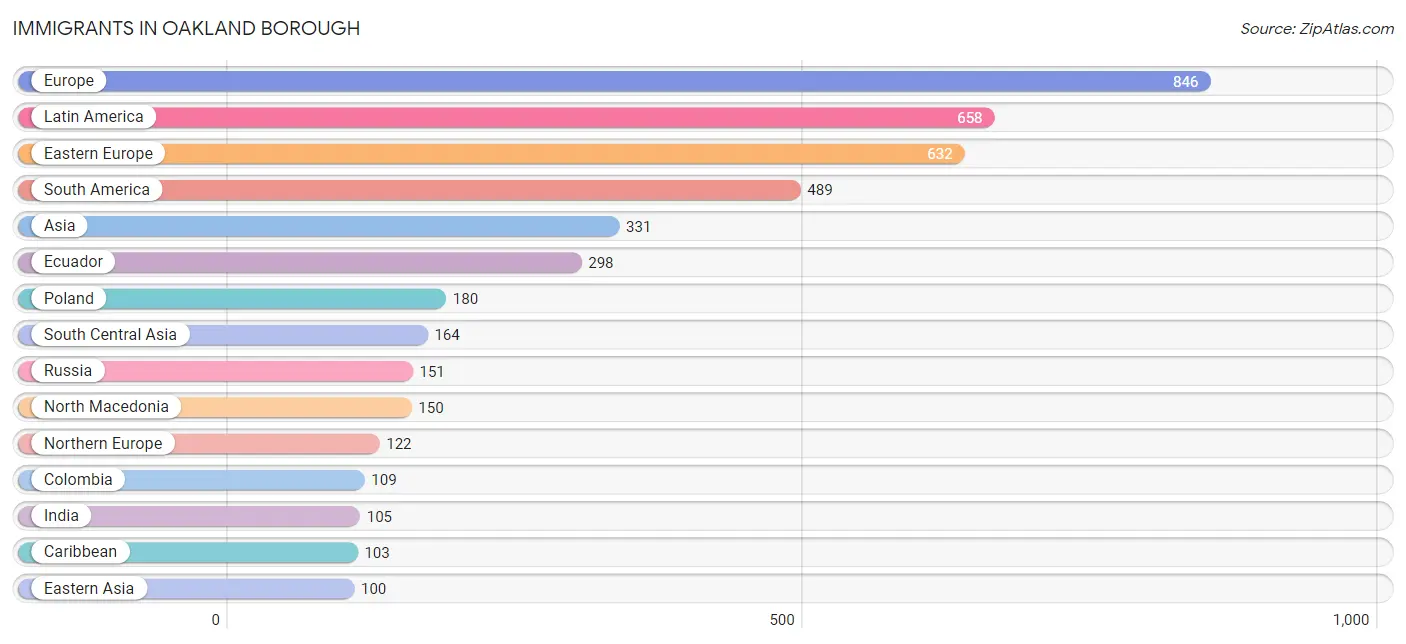
Immigrants in Oakland borough
The most numerous immigrant groups reported in Oakland borough came from Europe (846 | 6.6%), Latin America (658 | 5.2%), Eastern Europe (632 | 5.0%), South America (489 | 3.8%), and Asia (331 | 2.6%), together accounting for 23.2% of all Oakland borough residents.
| Immigration Origin | # Population | % Population |
| Africa | 30 | 0.2% |
| Albania | 71 | 0.6% |
| Asia | 331 | 2.6% |
| Australia | 6 | 0.1% |
| Canada | 54 | 0.4% |
| Caribbean | 103 | 0.8% |
| Central America | 66 | 0.5% |
| China | 56 | 0.4% |
| Colombia | 109 | 0.9% |
| Croatia | 10 | 0.1% |
| Cuba | 70 | 0.5% |
| Czechoslovakia | 34 | 0.3% |
| Dominica | 1 | 0.0% |
| Dominican Republic | 20 | 0.2% |
| Eastern Asia | 100 | 0.8% |
| Eastern Europe | 632 | 5.0% |
| Ecuador | 298 | 2.3% |
| Egypt | 11 | 0.1% |
| El Salvador | 8 | 0.1% |
| England | 70 | 0.5% |
| Europe | 846 | 6.6% |
| Germany | 37 | 0.3% |
| Greece | 7 | 0.1% |
| India | 105 | 0.8% |
| Iran | 58 | 0.5% |
| Ireland | 31 | 0.2% |
| Israel | 29 | 0.2% |
| Italy | 22 | 0.2% |
| Korea | 44 | 0.4% |
| Latin America | 658 | 5.2% |
| Mexico | 58 | 0.5% |
| Nepal | 1 | 0.0% |
| North Macedonia | 150 | 1.2% |
| Northern Africa | 30 | 0.2% |
| Northern Europe | 122 | 1.0% |
| Oceania | 6 | 0.1% |
| Peru | 56 | 0.4% |
| Philippines | 15 | 0.1% |
| Poland | 180 | 1.4% |
| Portugal | 6 | 0.1% |
| Romania | 5 | 0.0% |
| Russia | 151 | 1.2% |
| South America | 489 | 3.8% |
| South Central Asia | 164 | 1.3% |
| South Eastern Asia | 15 | 0.1% |
| Southern Europe | 55 | 0.4% |
| Spain | 20 | 0.2% |
| Trinidad and Tobago | 12 | 0.1% |
| Turkey | 13 | 0.1% |
| Ukraine | 21 | 0.2% |
| Venezuela | 26 | 0.2% |
| Western Asia | 52 | 0.4% |
| Western Europe | 37 | 0.3% | View All 53 Rows |
Sex and Age in Oakland borough
Sex and Age in Oakland borough
The most populous age groups in Oakland borough are 50 to 54 Years (780 | 12.0%) for men and 50 to 54 Years (597 | 9.6%) for women.
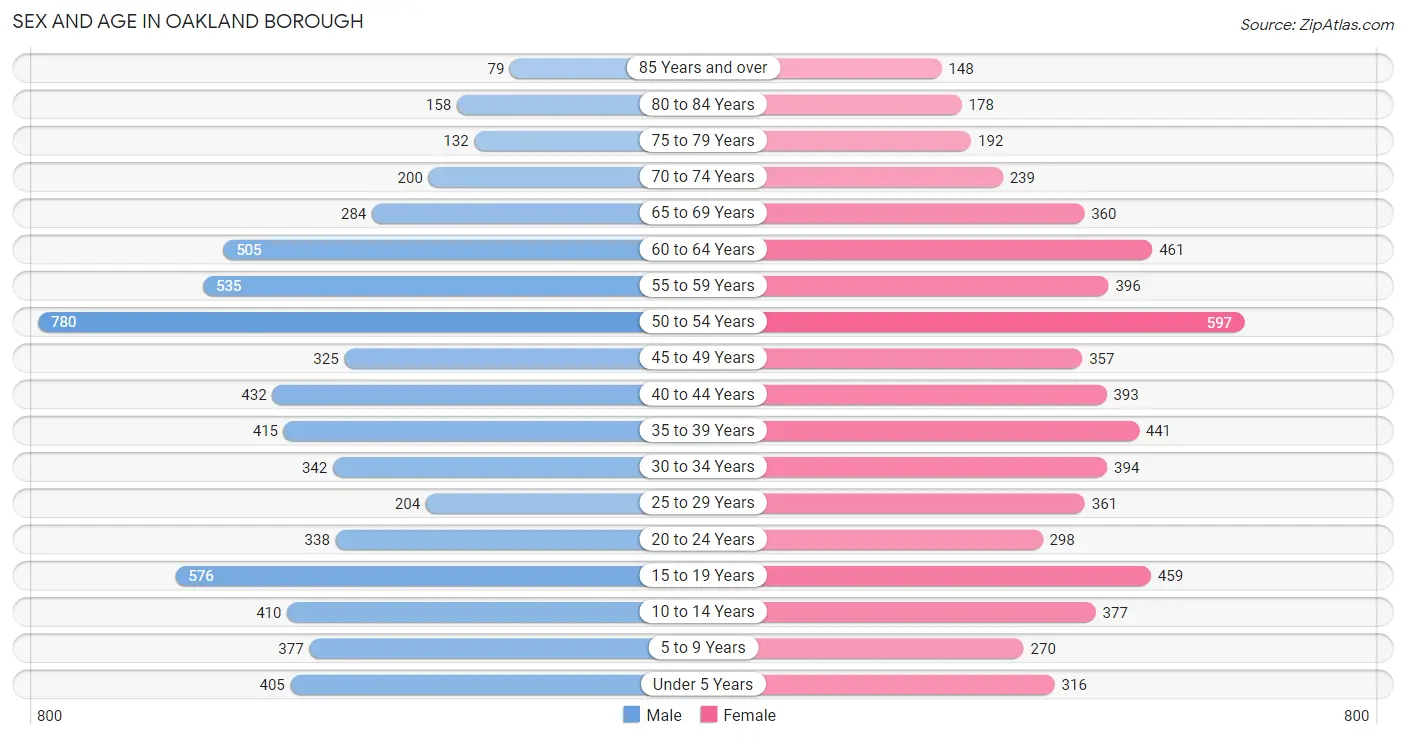
| Age Bracket | Male | Female |
| Under 5 Years | 405 (6.2%) | 316 (5.1%) |
| 5 to 9 Years | 377 (5.8%) | 270 (4.3%) |
| 10 to 14 Years | 410 (6.3%) | 377 (6.0%) |
| 15 to 19 Years | 576 (8.9%) | 459 (7.4%) |
| 20 to 24 Years | 338 (5.2%) | 298 (4.8%) |
| 25 to 29 Years | 204 (3.1%) | 361 (5.8%) |
| 30 to 34 Years | 342 (5.3%) | 394 (6.3%) |
| 35 to 39 Years | 415 (6.4%) | 441 (7.1%) |
| 40 to 44 Years | 432 (6.7%) | 393 (6.3%) |
| 45 to 49 Years | 325 (5.0%) | 357 (5.7%) |
| 50 to 54 Years | 780 (12.0%) | 597 (9.6%) |
| 55 to 59 Years | 535 (8.2%) | 396 (6.4%) |
| 60 to 64 Years | 505 (7.8%) | 461 (7.4%) |
| 65 to 69 Years | 284 (4.4%) | 360 (5.8%) |
| 70 to 74 Years | 200 (3.1%) | 239 (3.8%) |
| 75 to 79 Years | 132 (2.0%) | 192 (3.1%) |
| 80 to 84 Years | 158 (2.4%) | 178 (2.9%) |
| 85 Years and over | 79 (1.2%) | 148 (2.4%) |
| Total | 6,497 (100.0%) | 6,237 (100.0%) |
Families and Households in Oakland borough
Median Family Size in Oakland borough
The median family size in Oakland borough is 3.21 persons per family, with married-couple families (3,040 | 85.5%) accounting for the largest median family size of 3.24 persons per family. On the other hand, single female/mother families (223 | 6.3%) represent the smallest median family size with 2.89 persons per family.
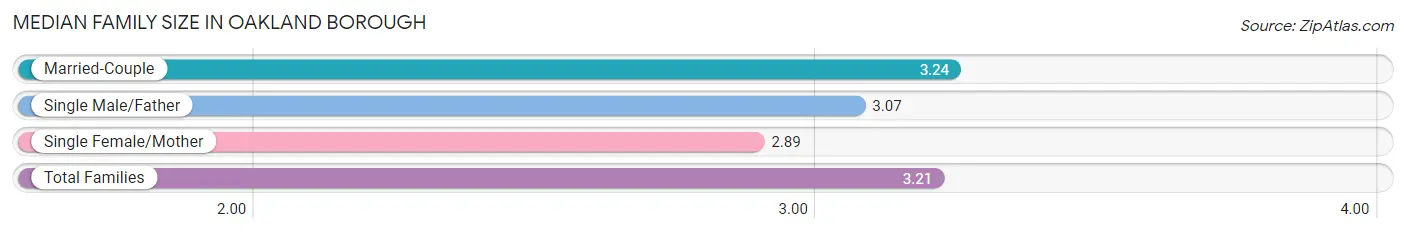
| Family Type | # Families | Family Size |
| Married-Couple | 3,040 (85.5%) | 3.24 |
| Single Male/Father | 293 (8.2%) | 3.07 |
| Single Female/Mother | 223 (6.3%) | 2.89 |
| Total Families | 3,556 (100.0%) | 3.21 |
Median Household Size in Oakland borough
The median household size in Oakland borough is 2.86 persons per household, with single male/father households (293 | 6.7%) accounting for the largest median household size of 3.3 persons per household. non-family households (825 | 18.8%) represent the smallest median household size with 1.21 persons per household.
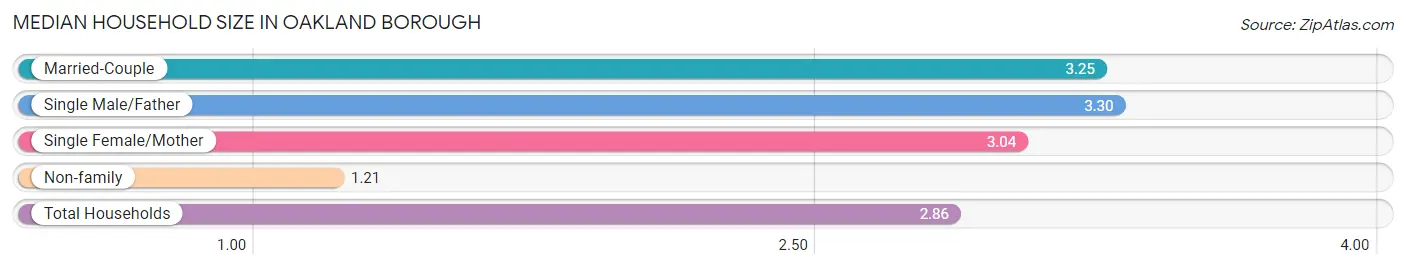
| Household Type | # Households | Household Size |
| Married-Couple | 3,040 (69.4%) | 3.25 |
| Single Male/Father | 293 (6.7%) | 3.30 |
| Single Female/Mother | 223 (5.1%) | 3.04 |
| Non-family | 825 (18.8%) | 1.21 |
| Total Households | 4,381 (100.0%) | 2.86 |
Household Size by Marriage Status in Oakland borough
Out of a total of 4,381 households in Oakland borough, 3,556 (81.2%) are family households, while 825 (18.8%) are nonfamily households. The most numerous type of family households are 3-person households, comprising 1,154, and the most common type of nonfamily households are 1-person households, comprising 689.
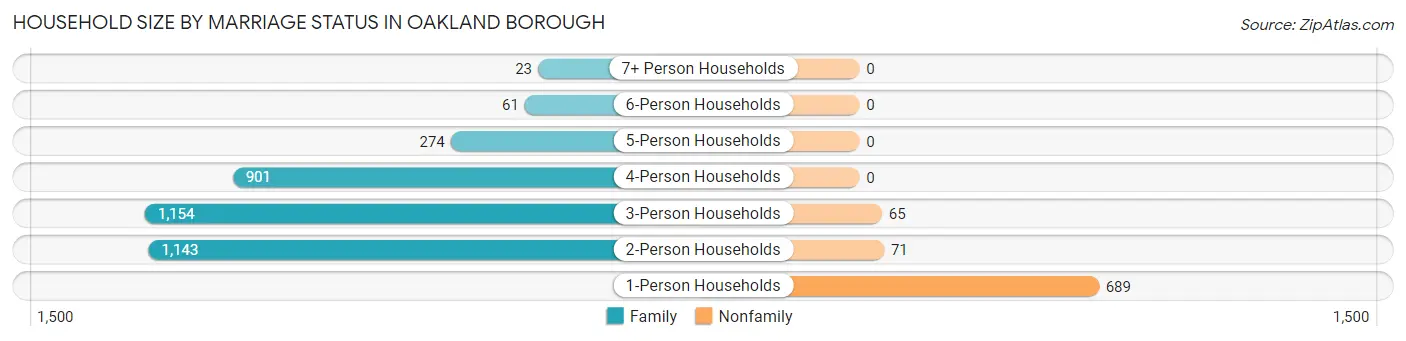
| Household Size | Family Households | Nonfamily Households |
| 1-Person Households | - | 689 (15.7%) |
| 2-Person Households | 1,143 (26.1%) | 71 (1.6%) |
| 3-Person Households | 1,154 (26.3%) | 65 (1.5%) |
| 4-Person Households | 901 (20.6%) | 0 (0.0%) |
| 5-Person Households | 274 (6.2%) | 0 (0.0%) |
| 6-Person Households | 61 (1.4%) | 0 (0.0%) |
| 7+ Person Households | 23 (0.5%) | 0 (0.0%) |
| Total | 3,556 (81.2%) | 825 (18.8%) |
Female Fertility in Oakland borough
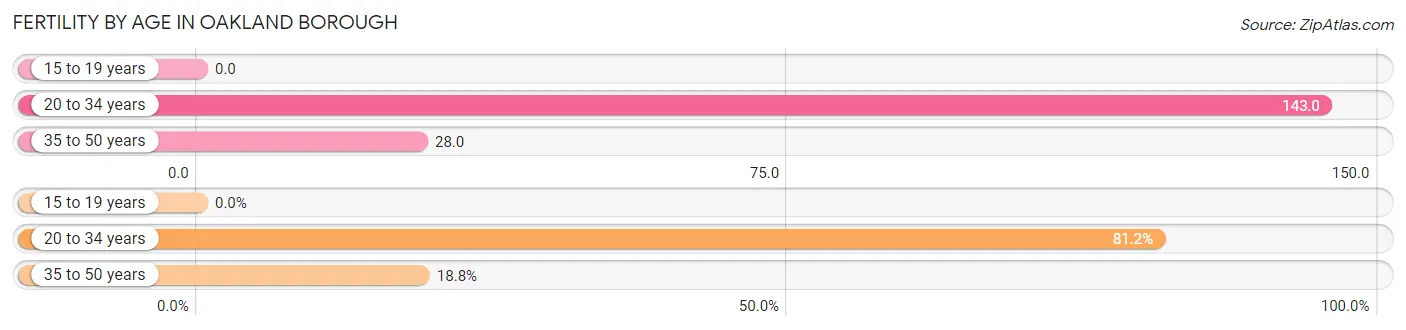
Fertility by Age in Oakland borough
Average fertility rate in Oakland borough is 67.0 births per 1,000 women. Women in the age bracket of 20 to 34 years have the highest fertility rate with 143.0 births per 1,000 women. Women in the age bracket of 20 to 34 years acount for 81.2% of all women with births.
| Age Bracket | Women with Births | Births / 1,000 Women |
| 15 to 19 years | 0 (0.0%) | 0.0 |
| 20 to 34 years | 151 (81.2%) | 143.0 |
| 35 to 50 years | 35 (18.8%) | 28.0 |
| Total | 186 (100.0%) | 67.0 |
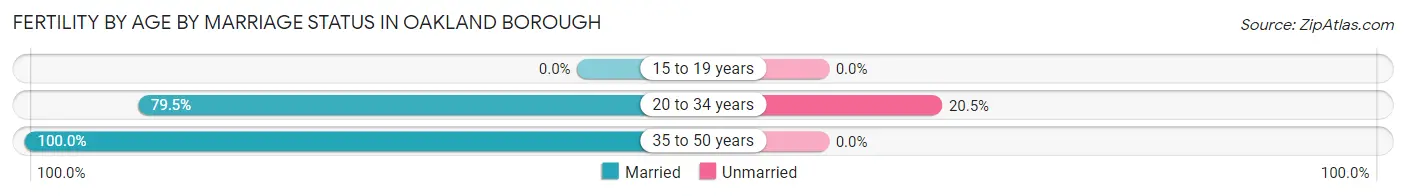
Fertility by Age by Marriage Status in Oakland borough
83.3% of women with births (186) in Oakland borough are married. The highest percentage of unmarried women with births falls into 20 to 34 years age bracket with 20.5% of them unmarried at the time of birth, while the lowest percentage of unmarried women with births belong to 35 to 50 years age bracket with 0.0% of them unmarried.
| Age Bracket | Married | Unmarried |
| 15 to 19 years | 0 (0.0%) | 0 (0.0%) |
| 20 to 34 years | 120 (79.5%) | 31 (20.5%) |
| 35 to 50 years | 35 (100.0%) | 0 (0.0%) |
| Total | 155 (83.3%) | 31 (16.7%) |
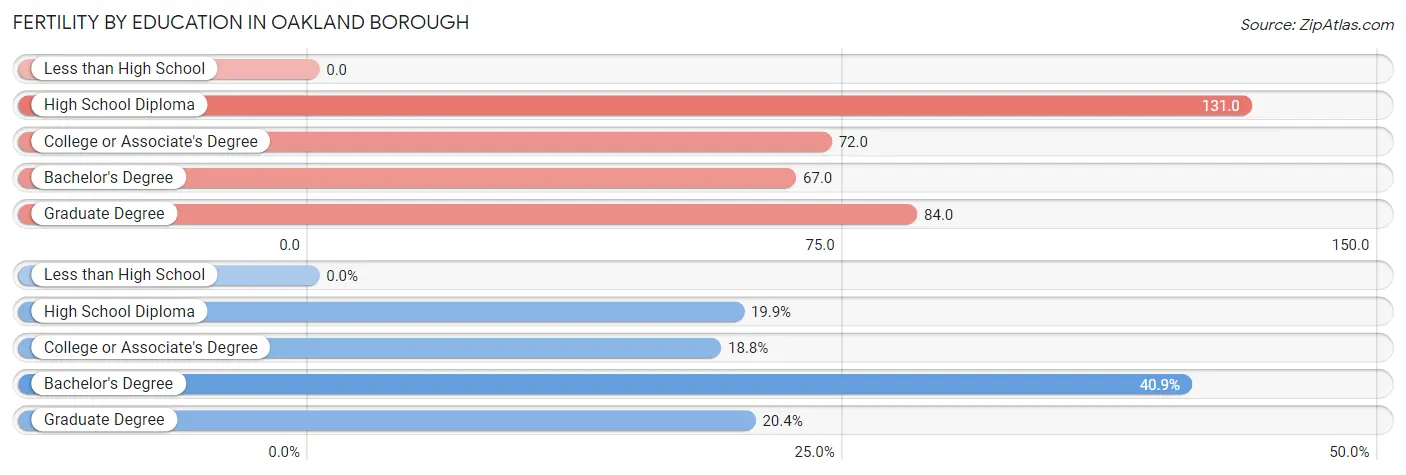
Fertility by Education in Oakland borough
| Educational Attainment | Women with Births | Births / 1,000 Women |
| Less than High School | 0 (0.0%) | 0.0 |
| High School Diploma | 37 (19.9%) | 131.0 |
| College or Associate's Degree | 35 (18.8%) | 72.0 |
| Bachelor's Degree | 76 (40.9%) | 67.0 |
| Graduate Degree | 38 (20.4%) | 84.0 |
| Total | 186 (100.0%) | 67.0 |
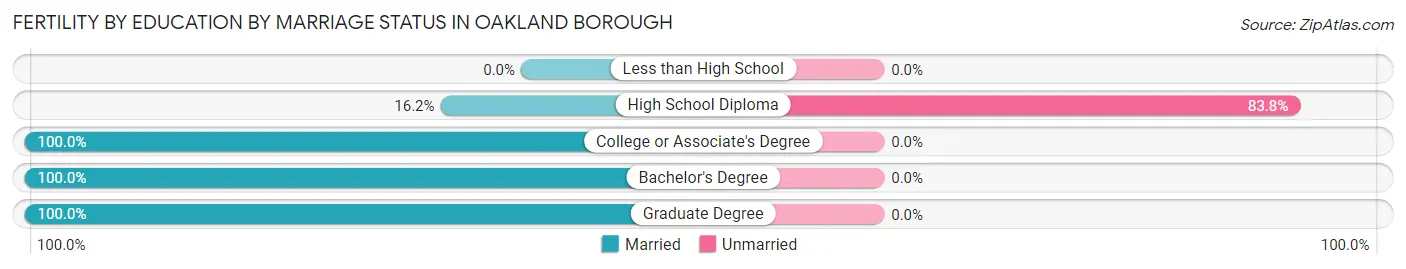
Fertility by Education by Marriage Status in Oakland borough
16.7% of women with births in Oakland borough are unmarried. Women with the educational attainment of college or associate's degree are most likely to be married with 100.0% of them married at childbirth, while women with the educational attainment of high school diploma are least likely to be married with 83.8% of them unmarried at childbirth.
| Educational Attainment | Married | Unmarried |
| Less than High School | 0 (0.0%) | 0 (0.0%) |
| High School Diploma | 6 (16.2%) | 31 (83.8%) |
| College or Associate's Degree | 35 (100.0%) | 0 (0.0%) |
| Bachelor's Degree | 76 (100.0%) | 0 (0.0%) |
| Graduate Degree | 38 (100.0%) | 0 (0.0%) |
| Total | 155 (83.3%) | 31 (16.7%) |
Employment Characteristics in Oakland borough
Employment by Class of Employer in Oakland borough
Among the 6,740 employed individuals in Oakland borough, private company employees (4,936 | 73.2%), local government employees (669 | 9.9%), and not-for-profit organizations (388 | 5.8%) make up the most common classes of employment.
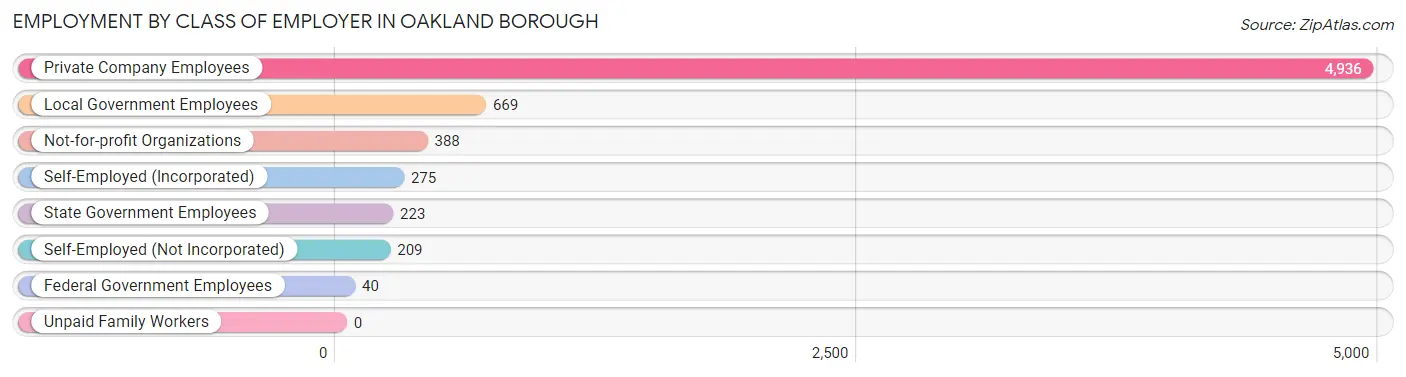
| Employer Class | # Employees | % Employees |
| Private Company Employees | 4,936 | 73.2% |
| Self-Employed (Incorporated) | 275 | 4.1% |
| Self-Employed (Not Incorporated) | 209 | 3.1% |
| Not-for-profit Organizations | 388 | 5.8% |
| Local Government Employees | 669 | 9.9% |
| State Government Employees | 223 | 3.3% |
| Federal Government Employees | 40 | 0.6% |
| Unpaid Family Workers | 0 | 0.0% |
| Total | 6,740 | 100.0% |
Employment Status by Age in Oakland borough
According to the labor force statistics for Oakland borough, out of the total population over 16 years of age (10,357), 70.3% or 7,281 individuals are in the labor force, with 5.3% or 386 of them unemployed. The age group with the highest labor force participation rate is 35 to 44 years, with 93.9% or 1,578 individuals in the labor force. Within the labor force, the 75 years and over age range has the highest percentage of unemployed individuals, with 18.4% or 14 of them being unemployed.
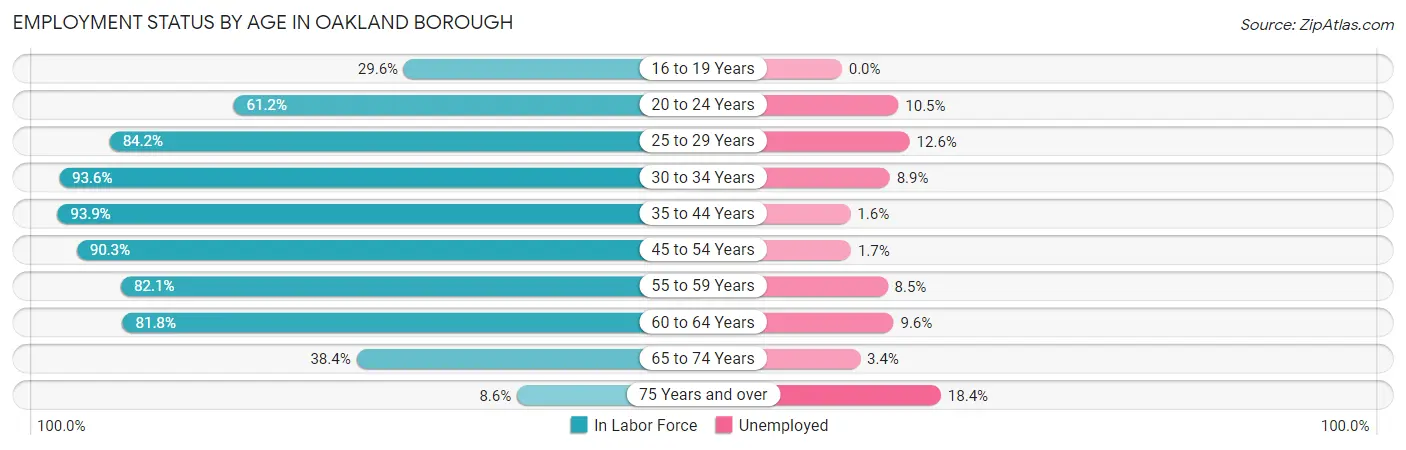
| Age Bracket | In Labor Force | Unemployed |
| 16 to 19 Years | 241 (29.6%) | 0 (0.0%) |
| 20 to 24 Years | 389 (61.2%) | 41 (10.5%) |
| 25 to 29 Years | 476 (84.2%) | 60 (12.6%) |
| 30 to 34 Years | 689 (93.6%) | 61 (8.9%) |
| 35 to 44 Years | 1,578 (93.9%) | 25 (1.6%) |
| 45 to 54 Years | 1,859 (90.3%) | 32 (1.7%) |
| 55 to 59 Years | 764 (82.1%) | 65 (8.5%) |
| 60 to 64 Years | 790 (81.8%) | 76 (9.6%) |
| 65 to 74 Years | 416 (38.4%) | 14 (3.4%) |
| 75 Years and over | 76 (8.6%) | 14 (18.4%) |
| Total | 7,281 (70.3%) | 386 (5.3%) |
Employment Status by Educational Attainment in Oakland borough
According to labor force statistics for Oakland borough, 88.7% of individuals (6,154) out of the total population between 25 and 64 years of age (6,938) are in the labor force, with 5.2% or 320 of them being unemployed. The group with the highest labor force participation rate are those with the educational attainment of bachelor's degree or higher, with 91.1% or 3,650 individuals in the labor force. Within the labor force, individuals with high school diploma education have the highest percentage of unemployment, with 9.7% or 96 of them being unemployed.
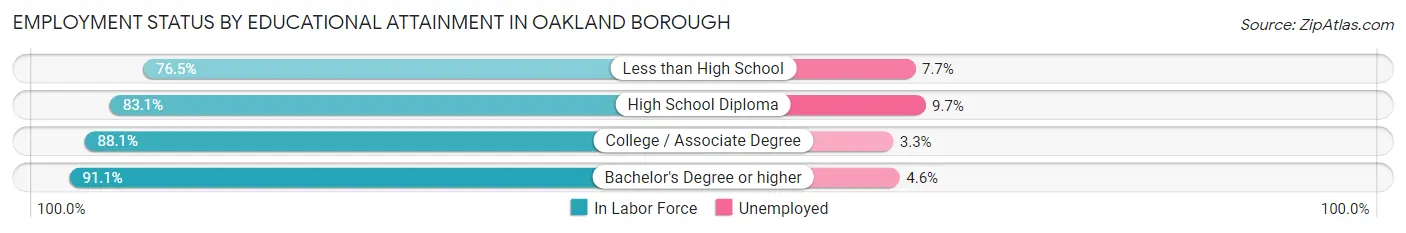
| Educational Attainment | In Labor Force | Unemployed |
| Less than High School | 117 (76.5%) | 12 (7.7%) |
| High School Diploma | 994 (83.1%) | 116 (9.7%) |
| College / Associate Degree | 1,394 (88.1%) | 52 (3.3%) |
| Bachelor's Degree or higher | 3,650 (91.1%) | 184 (4.6%) |
| Total | 6,154 (88.7%) | 361 (5.2%) |
Employment Occupations by Sex in Oakland borough
Management, Business, Science and Arts Occupations
The most common Management, Business, Science and Arts occupations in Oakland borough are Management (1,140 | 16.6%), Community & Social Service (1,083 | 15.7%), Education Instruction & Library (670 | 9.7%), Business & Financial (579 | 8.4%), and Health Diagnosing & Treating (561 | 8.1%).
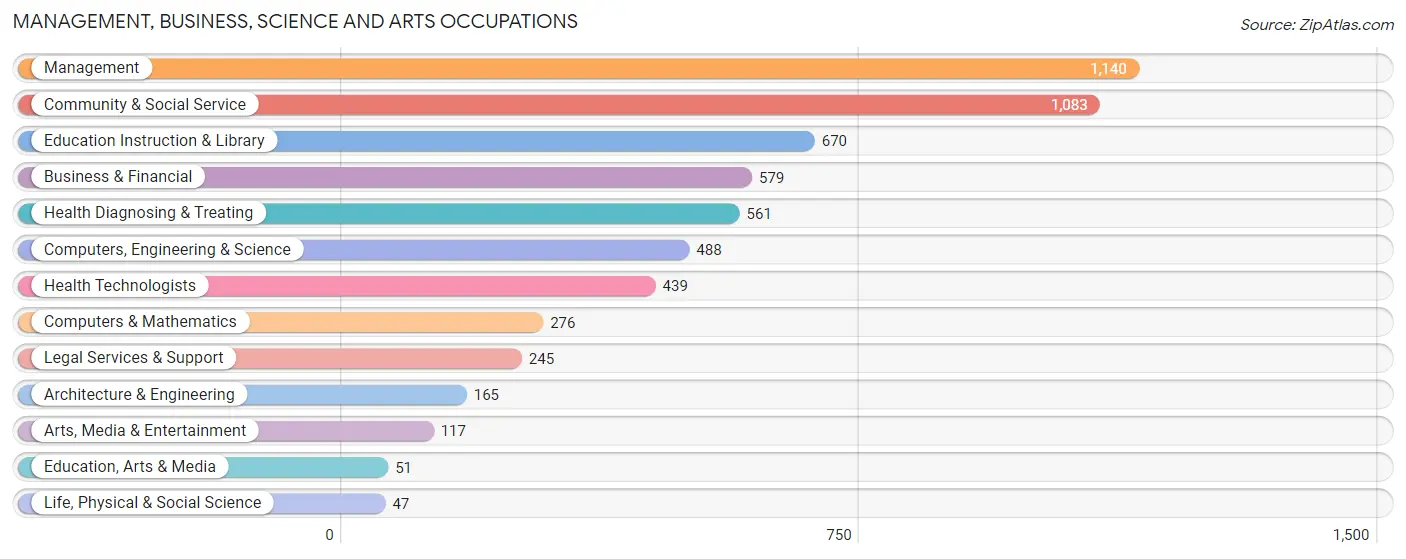
Management, Business, Science and Arts Occupations by Sex
Within the Management, Business, Science and Arts occupations in Oakland borough, the most male-oriented occupations are Architecture & Engineering (80.0%), Computers & Mathematics (75.0%), and Computers, Engineering & Science (70.3%), while the most female-oriented occupations are Life, Physical & Social Science (91.5%), Education Instruction & Library (76.3%), and Education, Arts & Media (70.6%).
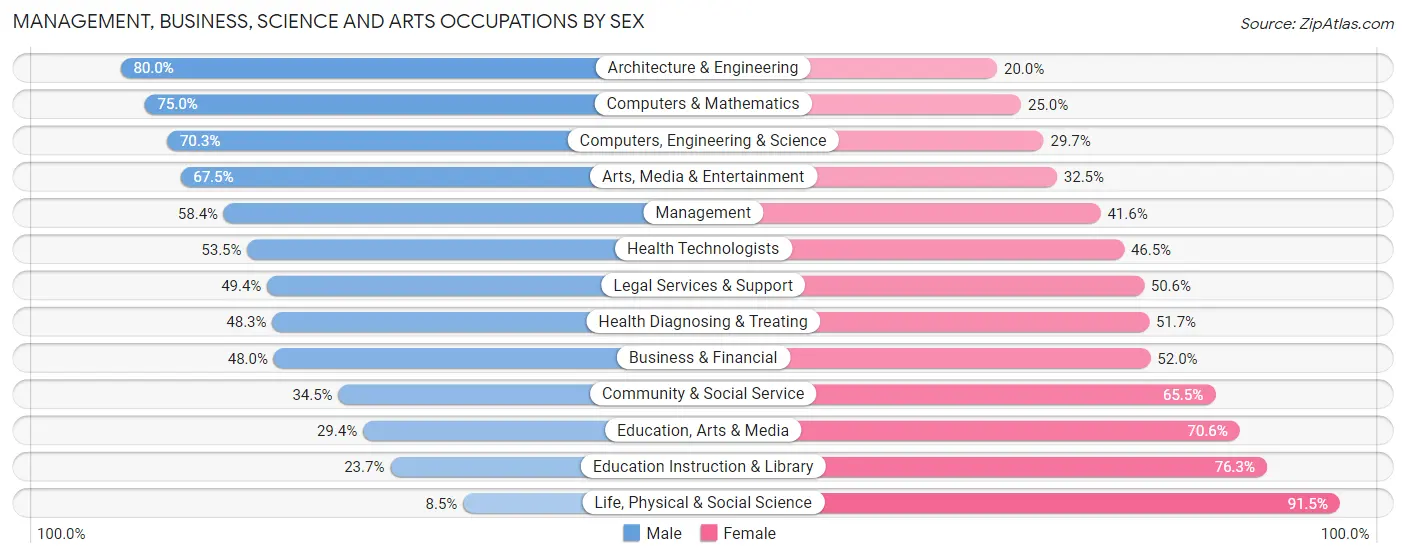
| Occupation | Male | Female |
| Management | 666 (58.4%) | 474 (41.6%) |
| Business & Financial | 278 (48.0%) | 301 (52.0%) |
| Computers, Engineering & Science | 343 (70.3%) | 145 (29.7%) |
| Computers & Mathematics | 207 (75.0%) | 69 (25.0%) |
| Architecture & Engineering | 132 (80.0%) | 33 (20.0%) |
| Life, Physical & Social Science | 4 (8.5%) | 43 (91.5%) |
| Community & Social Service | 374 (34.5%) | 709 (65.5%) |
| Education, Arts & Media | 15 (29.4%) | 36 (70.6%) |
| Legal Services & Support | 121 (49.4%) | 124 (50.6%) |
| Education Instruction & Library | 159 (23.7%) | 511 (76.3%) |
| Arts, Media & Entertainment | 79 (67.5%) | 38 (32.5%) |
| Health Diagnosing & Treating | 271 (48.3%) | 290 (51.7%) |
| Health Technologists | 235 (53.5%) | 204 (46.5%) |
| Total (Category) | 1,932 (50.2%) | 1,919 (49.8%) |
| Total (Overall) | 3,714 (53.9%) | 3,175 (46.1%) |
Services Occupations
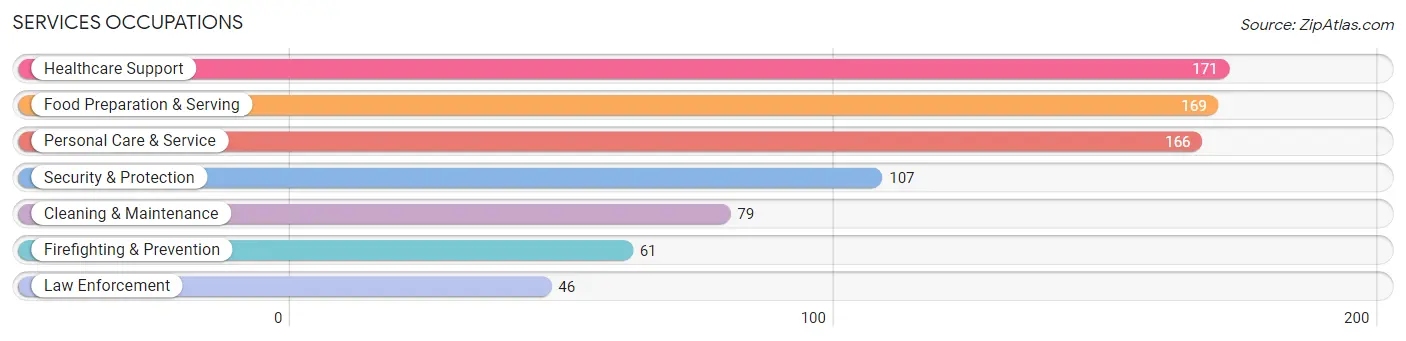
The most common Services occupations in Oakland borough are Healthcare Support (171 | 2.5%), Food Preparation & Serving (169 | 2.5%), Personal Care & Service (166 | 2.4%), Security & Protection (107 | 1.5%), and Cleaning & Maintenance (79 | 1.1%).
Services Occupations by Sex
Within the Services occupations in Oakland borough, the most male-oriented occupations are Law Enforcement (100.0%), Security & Protection (94.4%), and Firefighting & Prevention (90.2%), while the most female-oriented occupations are Healthcare Support (100.0%), Cleaning & Maintenance (58.2%), and Personal Care & Service (44.0%).
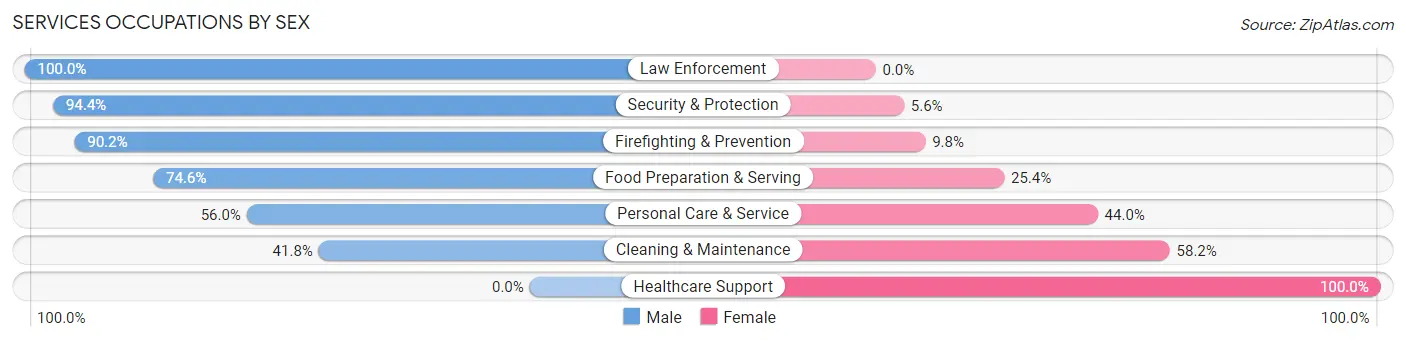
| Occupation | Male | Female |
| Healthcare Support | 0 (0.0%) | 171 (100.0%) |
| Security & Protection | 101 (94.4%) | 6 (5.6%) |
| Firefighting & Prevention | 55 (90.2%) | 6 (9.8%) |
| Law Enforcement | 46 (100.0%) | 0 (0.0%) |
| Food Preparation & Serving | 126 (74.6%) | 43 (25.4%) |
| Cleaning & Maintenance | 33 (41.8%) | 46 (58.2%) |
| Personal Care & Service | 93 (56.0%) | 73 (44.0%) |
| Total (Category) | 353 (51.0%) | 339 (49.0%) |
| Total (Overall) | 3,714 (53.9%) | 3,175 (46.1%) |
Sales and Office Occupations
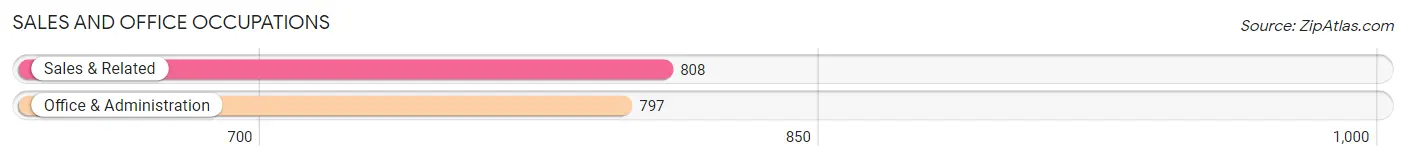
The most common Sales and Office occupations in Oakland borough are Sales & Related (808 | 11.7%), and Office & Administration (797 | 11.6%).
Sales and Office Occupations by Sex

| Occupation | Male | Female |
| Sales & Related | 498 (61.6%) | 310 (38.4%) |
| Office & Administration | 303 (38.0%) | 494 (62.0%) |
| Total (Category) | 801 (49.9%) | 804 (50.1%) |
| Total (Overall) | 3,714 (53.9%) | 3,175 (46.1%) |
Natural Resources, Construction and Maintenance Occupations
The most common Natural Resources, Construction and Maintenance occupations in Oakland borough are Construction & Extraction (239 | 3.5%), and Installation, Maintenance & Repair (138 | 2.0%).
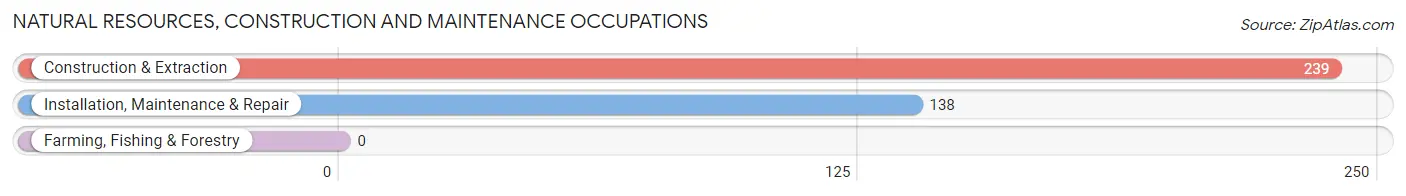
Natural Resources, Construction and Maintenance Occupations by Sex
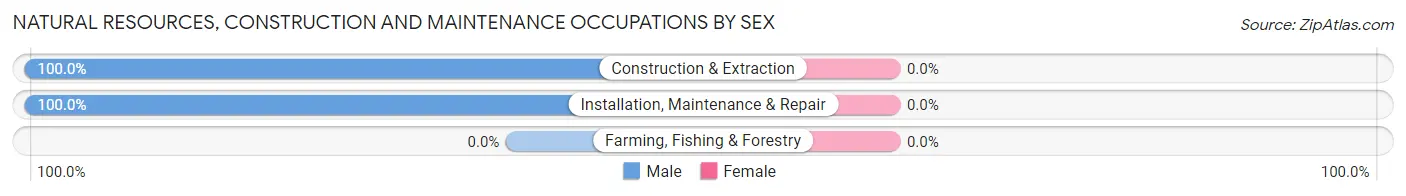
| Occupation | Male | Female |
| Farming, Fishing & Forestry | 0 (0.0%) | 0 (0.0%) |
| Construction & Extraction | 239 (100.0%) | 0 (0.0%) |
| Installation, Maintenance & Repair | 138 (100.0%) | 0 (0.0%) |
| Total (Category) | 377 (100.0%) | 0 (0.0%) |
| Total (Overall) | 3,714 (53.9%) | 3,175 (46.1%) |
Production, Transportation and Moving Occupations
The most common Production, Transportation and Moving occupations in Oakland borough are Production (125 | 1.8%), Transportation (124 | 1.8%), and Material Moving (115 | 1.7%).
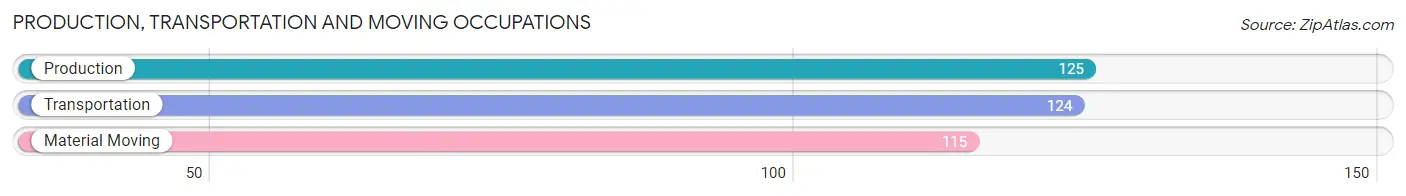
Production, Transportation and Moving Occupations by Sex
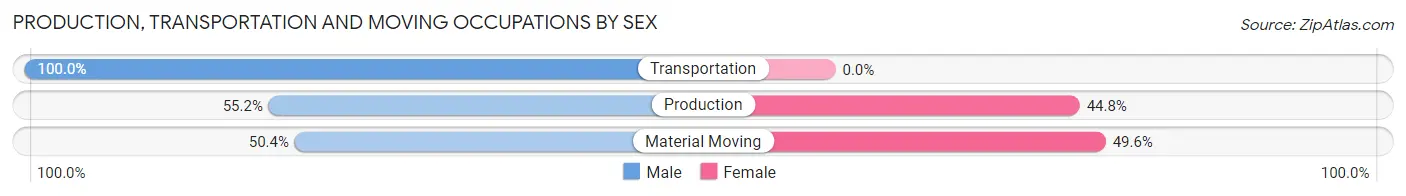
| Occupation | Male | Female |
| Production | 69 (55.2%) | 56 (44.8%) |
| Transportation | 124 (100.0%) | 0 (0.0%) |
| Material Moving | 58 (50.4%) | 57 (49.6%) |
| Total (Category) | 251 (69.0%) | 113 (31.0%) |
| Total (Overall) | 3,714 (53.9%) | 3,175 (46.1%) |
Employment Industries by Sex in Oakland borough
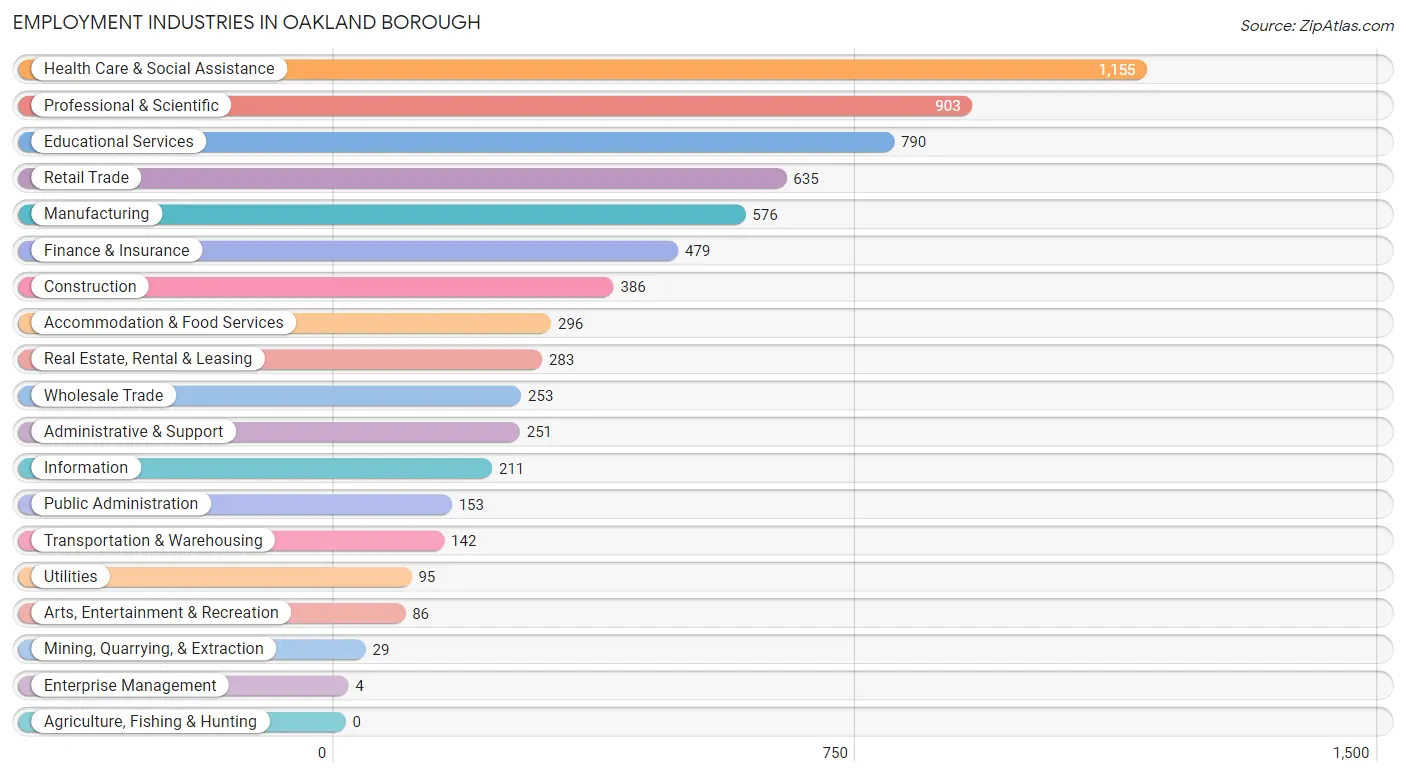
Employment Industries in Oakland borough
The major employment industries in Oakland borough include Health Care & Social Assistance (1,155 | 16.8%), Professional & Scientific (903 | 13.1%), Educational Services (790 | 11.5%), Retail Trade (635 | 9.2%), and Manufacturing (576 | 8.4%).
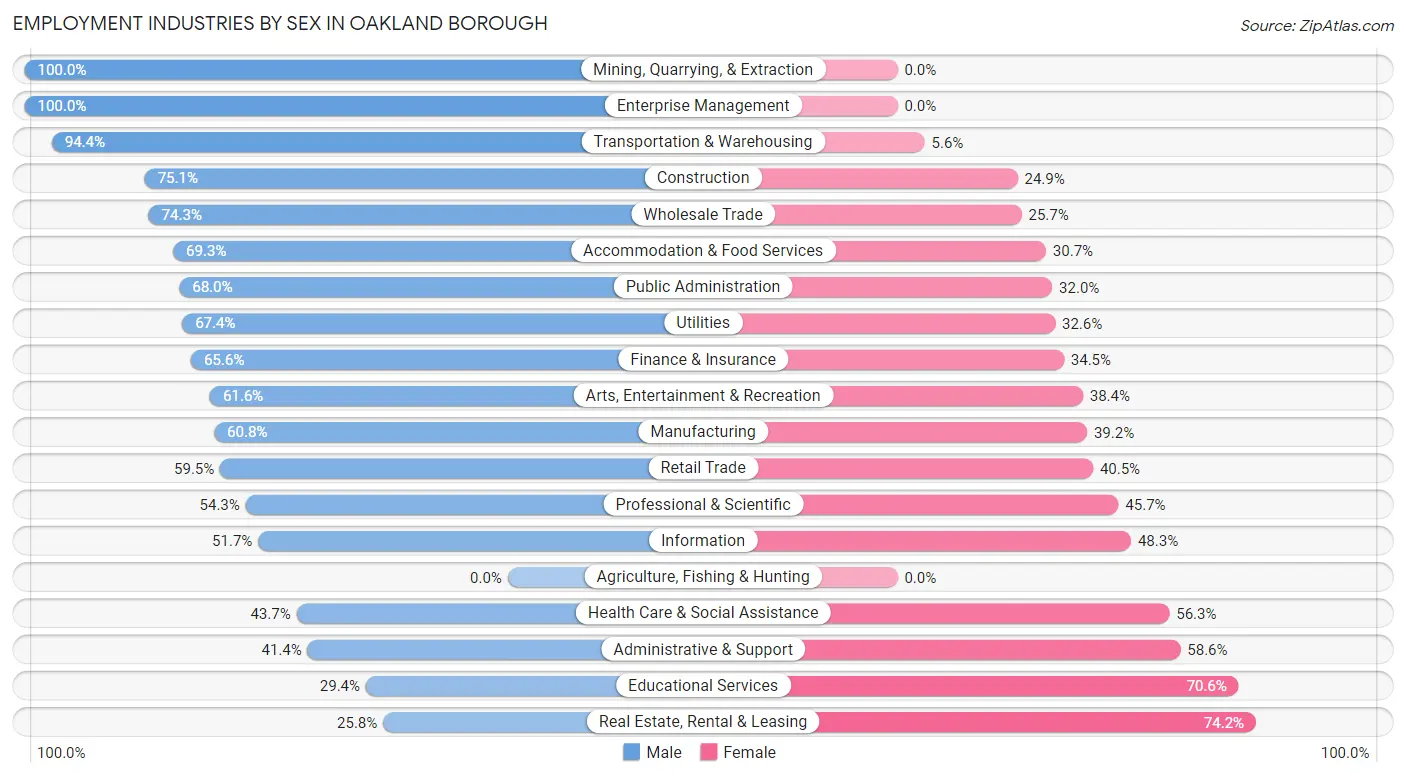
Employment Industries by Sex in Oakland borough
The Oakland borough industries that see more men than women are Mining, Quarrying, & Extraction (100.0%), Enterprise Management (100.0%), and Transportation & Warehousing (94.4%), whereas the industries that tend to have a higher number of women are Real Estate, Rental & Leasing (74.2%), Educational Services (70.6%), and Administrative & Support (58.6%).
| Industry | Male | Female |
| Agriculture, Fishing & Hunting | 0 (0.0%) | 0 (0.0%) |
| Mining, Quarrying, & Extraction | 29 (100.0%) | 0 (0.0%) |
| Construction | 290 (75.1%) | 96 (24.9%) |
| Manufacturing | 350 (60.8%) | 226 (39.2%) |
| Wholesale Trade | 188 (74.3%) | 65 (25.7%) |
| Retail Trade | 378 (59.5%) | 257 (40.5%) |
| Transportation & Warehousing | 134 (94.4%) | 8 (5.6%) |
| Utilities | 64 (67.4%) | 31 (32.6%) |
| Information | 109 (51.7%) | 102 (48.3%) |
| Finance & Insurance | 314 (65.5%) | 165 (34.4%) |
| Real Estate, Rental & Leasing | 73 (25.8%) | 210 (74.2%) |
| Professional & Scientific | 490 (54.3%) | 413 (45.7%) |
| Enterprise Management | 4 (100.0%) | 0 (0.0%) |
| Administrative & Support | 104 (41.4%) | 147 (58.6%) |
| Educational Services | 232 (29.4%) | 558 (70.6%) |
| Health Care & Social Assistance | 505 (43.7%) | 650 (56.3%) |
| Arts, Entertainment & Recreation | 53 (61.6%) | 33 (38.4%) |
| Accommodation & Food Services | 205 (69.3%) | 91 (30.7%) |
| Public Administration | 104 (68.0%) | 49 (32.0%) |
| Total | 3,714 (53.9%) | 3,175 (46.1%) |
Education in Oakland borough
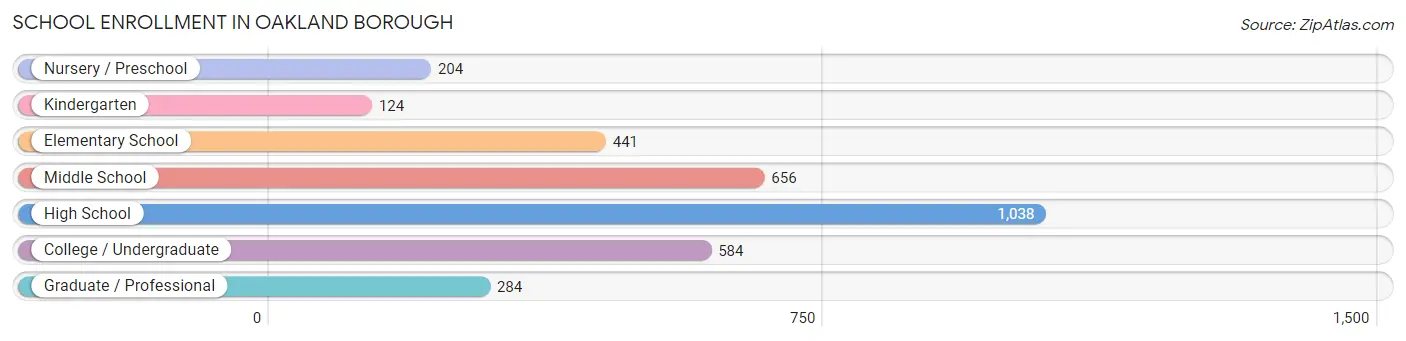
School Enrollment in Oakland borough
The most common levels of schooling among the 3,331 students in Oakland borough are high school (1,038 | 31.2%), middle school (656 | 19.7%), and college / undergraduate (584 | 17.5%).
| School Level | # Students | % Students |
| Nursery / Preschool | 204 | 6.1% |
| Kindergarten | 124 | 3.7% |
| Elementary School | 441 | 13.2% |
| Middle School | 656 | 19.7% |
| High School | 1,038 | 31.2% |
| College / Undergraduate | 584 | 17.5% |
| Graduate / Professional | 284 | 8.5% |
| Total | 3,331 | 100.0% |
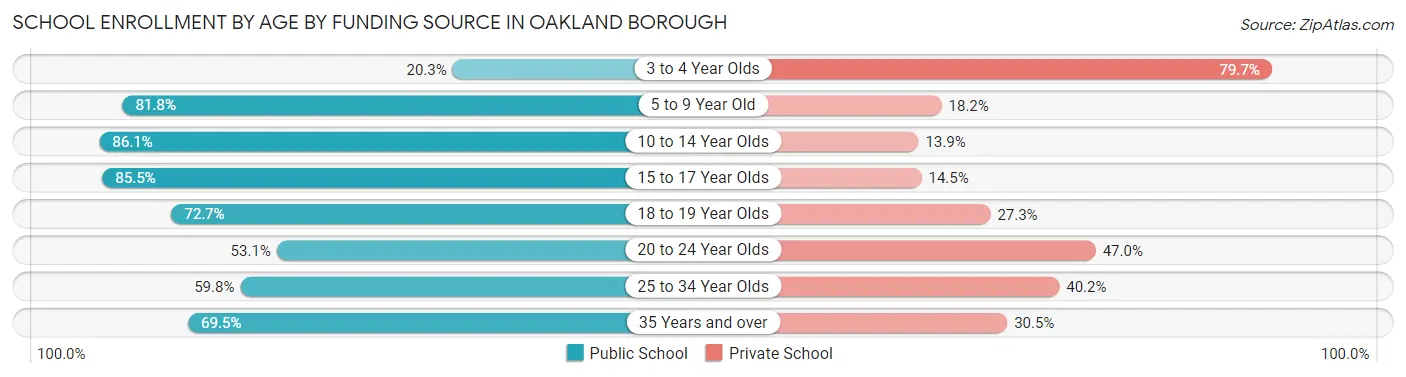
School Enrollment by Age by Funding Source in Oakland borough
Out of a total of 3,331 students who are enrolled in schools in Oakland borough, 829 (24.9%) attend a private institution, while the remaining 2,502 (75.1%) are enrolled in public schools. The age group of 3 to 4 year olds has the highest likelihood of being enrolled in private schools, with 110 (79.7% in the age bracket) enrolled. Conversely, the age group of 10 to 14 year olds has the lowest likelihood of being enrolled in a private school, with 673 (86.1% in the age bracket) attending a public institution.
| Age Bracket | Public School | Private School |
| 3 to 4 Year Olds | 28 (20.3%) | 110 (79.7%) |
| 5 to 9 Year Old | 520 (81.8%) | 116 (18.2%) |
| 10 to 14 Year Olds | 673 (86.1%) | 109 (13.9%) |
| 15 to 17 Year Olds | 613 (85.5%) | 104 (14.5%) |
| 18 to 19 Year Olds | 210 (72.7%) | 79 (27.3%) |
| 20 to 24 Year Olds | 139 (53.0%) | 123 (46.9%) |
| 25 to 34 Year Olds | 213 (59.8%) | 143 (40.2%) |
| 35 Years and over | 105 (69.5%) | 46 (30.5%) |
| Total | 2,502 (75.1%) | 829 (24.9%) |
Educational Attainment by Field of Study in Oakland borough
Business (1,233 | 23.9%), education (652 | 12.7%), computers & mathematics (464 | 9.0%), social sciences (432 | 8.4%), and engineering (338 | 6.6%) are the most common fields of study among 5,156 individuals in Oakland borough who have obtained a bachelor's degree or higher.
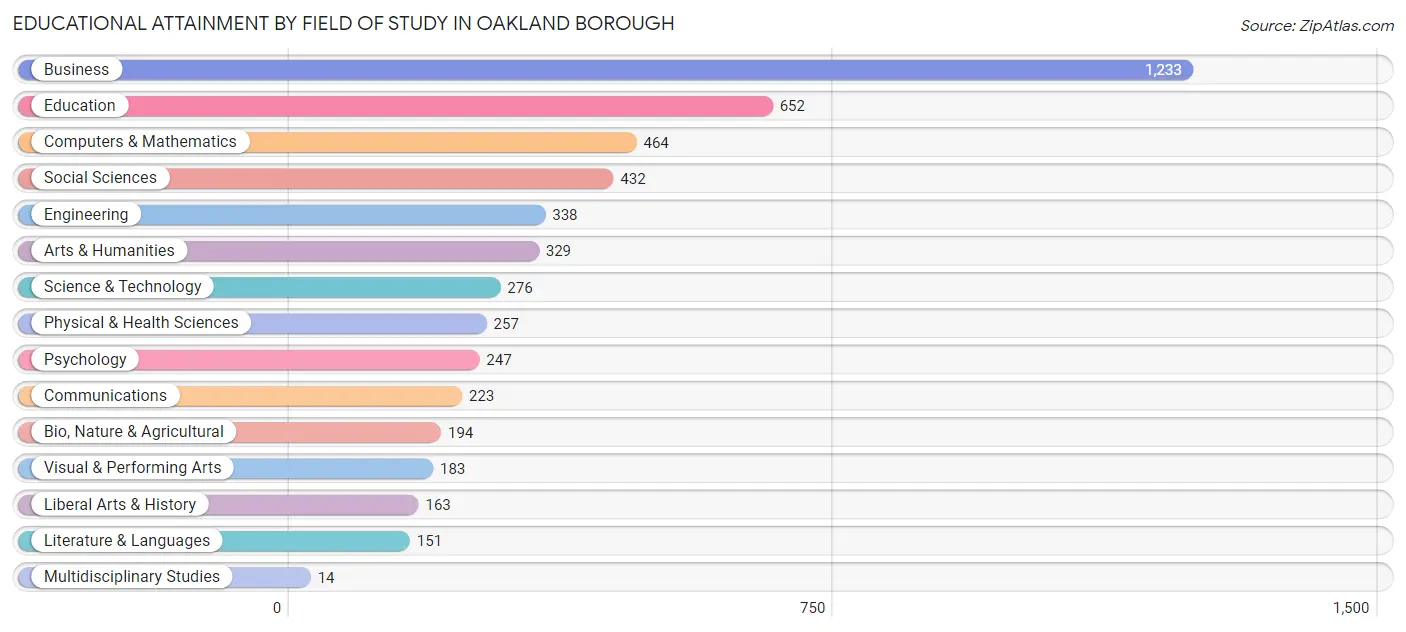
| Field of Study | # Graduates | % Graduates |
| Computers & Mathematics | 464 | 9.0% |
| Bio, Nature & Agricultural | 194 | 3.8% |
| Physical & Health Sciences | 257 | 5.0% |
| Psychology | 247 | 4.8% |
| Social Sciences | 432 | 8.4% |
| Engineering | 338 | 6.6% |
| Multidisciplinary Studies | 14 | 0.3% |
| Science & Technology | 276 | 5.3% |
| Business | 1,233 | 23.9% |
| Education | 652 | 12.7% |
| Literature & Languages | 151 | 2.9% |
| Liberal Arts & History | 163 | 3.2% |
| Visual & Performing Arts | 183 | 3.5% |
| Communications | 223 | 4.3% |
| Arts & Humanities | 329 | 6.4% |
| Total | 5,156 | 100.0% |
Transportation & Commute in Oakland borough
Vehicle Availability by Sex in Oakland borough
The most prevalent vehicle ownership categories in Oakland borough are males with 2 vehicles (1,461, accounting for 39.8%) and females with 2 vehicles (1,388, making up 47.7%).
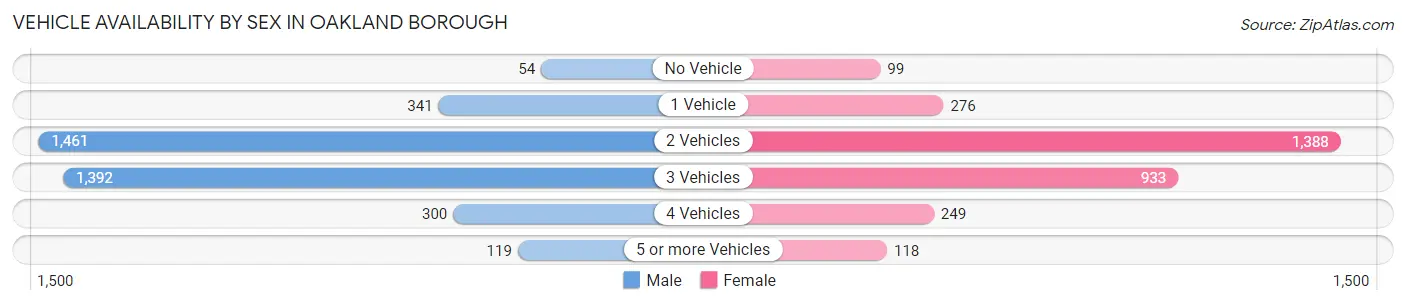
| Vehicles Available | Male | Female |
| No Vehicle | 54 (1.5%) | 99 (3.2%) |
| 1 Vehicle | 341 (9.3%) | 276 (9.0%) |
| 2 Vehicles | 1,461 (39.8%) | 1,388 (45.3%) |
| 3 Vehicles | 1,392 (38.0%) | 933 (30.5%) |
| 4 Vehicles | 300 (8.2%) | 249 (8.1%) |
| 5 or more Vehicles | 119 (3.3%) | 118 (3.8%) |
| Total | 3,667 (100.0%) | 3,063 (100.0%) |
Commute Time in Oakland borough
The most frequently occuring commute durations in Oakland borough are 15 to 19 minutes (963 commuters, 17.2%), 30 to 34 minutes (679 commuters, 12.1%), and 25 to 29 minutes (638 commuters, 11.4%).
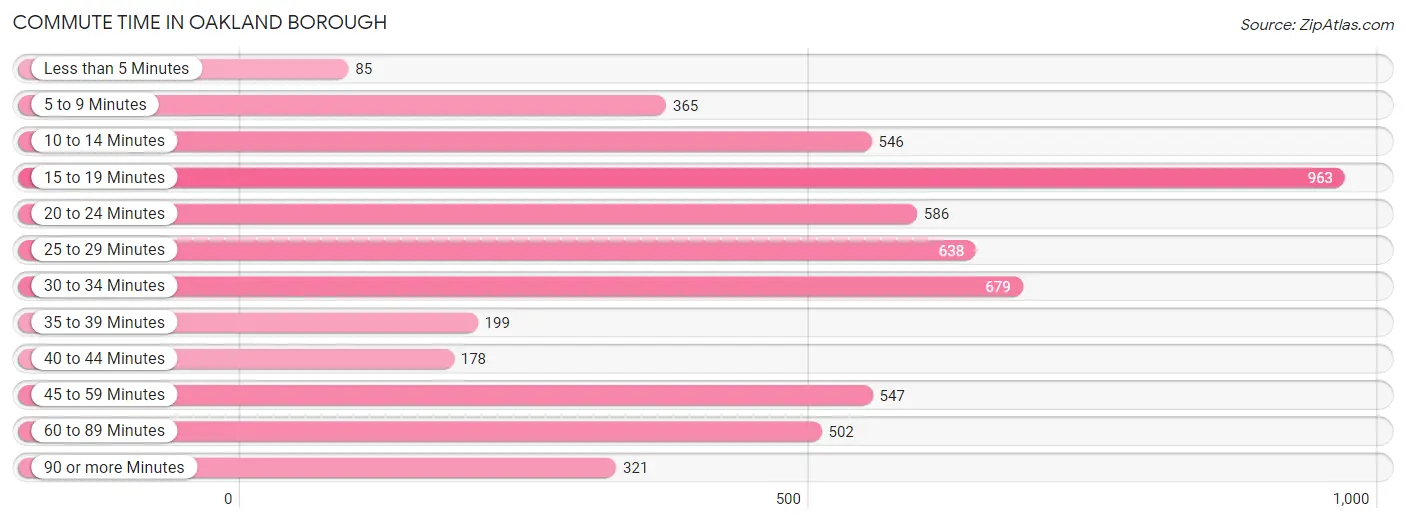
| Commute Time | # Commuters | % Commuters |
| Less than 5 Minutes | 85 | 1.5% |
| 5 to 9 Minutes | 365 | 6.5% |
| 10 to 14 Minutes | 546 | 9.7% |
| 15 to 19 Minutes | 963 | 17.2% |
| 20 to 24 Minutes | 586 | 10.4% |
| 25 to 29 Minutes | 638 | 11.4% |
| 30 to 34 Minutes | 679 | 12.1% |
| 35 to 39 Minutes | 199 | 3.5% |
| 40 to 44 Minutes | 178 | 3.2% |
| 45 to 59 Minutes | 547 | 9.8% |
| 60 to 89 Minutes | 502 | 8.9% |
| 90 or more Minutes | 321 | 5.7% |
Commute Time by Sex in Oakland borough
The most common commute times in Oakland borough are 15 to 19 minutes (471 commuters, 15.5%) for males and 15 to 19 minutes (492 commuters, 19.2%) for females.
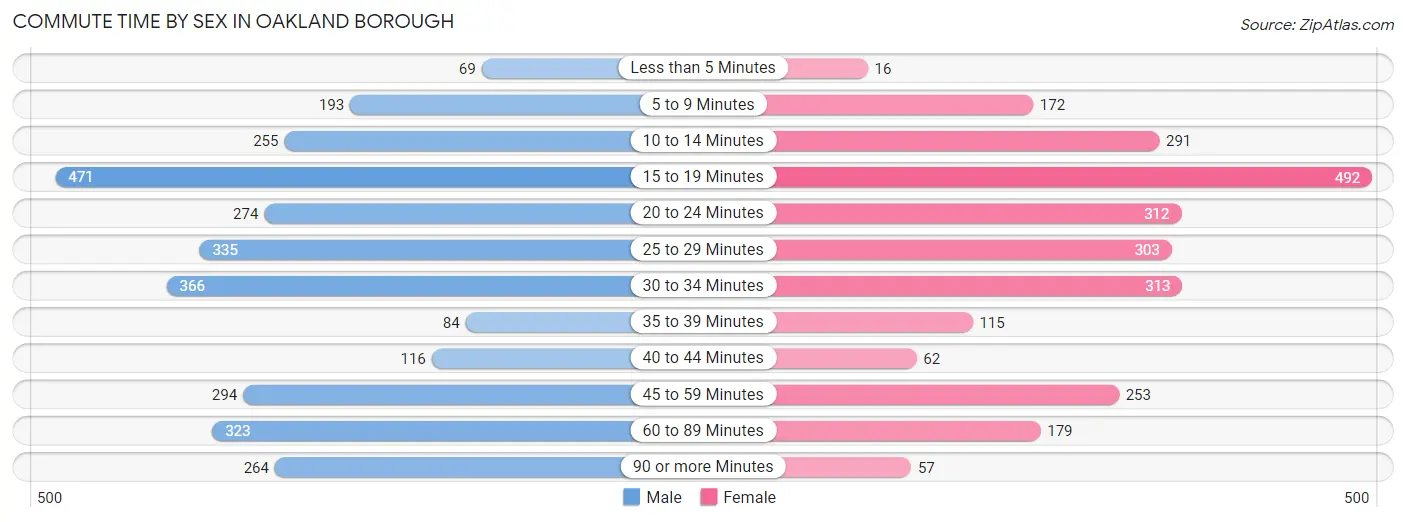
| Commute Time | Male | Female |
| Less than 5 Minutes | 69 (2.3%) | 16 (0.6%) |
| 5 to 9 Minutes | 193 (6.3%) | 172 (6.7%) |
| 10 to 14 Minutes | 255 (8.4%) | 291 (11.4%) |
| 15 to 19 Minutes | 471 (15.5%) | 492 (19.2%) |
| 20 to 24 Minutes | 274 (9.0%) | 312 (12.2%) |
| 25 to 29 Minutes | 335 (11.0%) | 303 (11.8%) |
| 30 to 34 Minutes | 366 (12.0%) | 313 (12.2%) |
| 35 to 39 Minutes | 84 (2.8%) | 115 (4.5%) |
| 40 to 44 Minutes | 116 (3.8%) | 62 (2.4%) |
| 45 to 59 Minutes | 294 (9.7%) | 253 (9.9%) |
| 60 to 89 Minutes | 323 (10.6%) | 179 (7.0%) |
| 90 or more Minutes | 264 (8.7%) | 57 (2.2%) |
Time of Departure to Work by Sex in Oakland borough
The most frequent times of departure to work in Oakland borough are 8:00 AM to 8:29 AM (530, 17.4%) for males and 7:00 AM to 7:29 AM (469, 18.3%) for females.
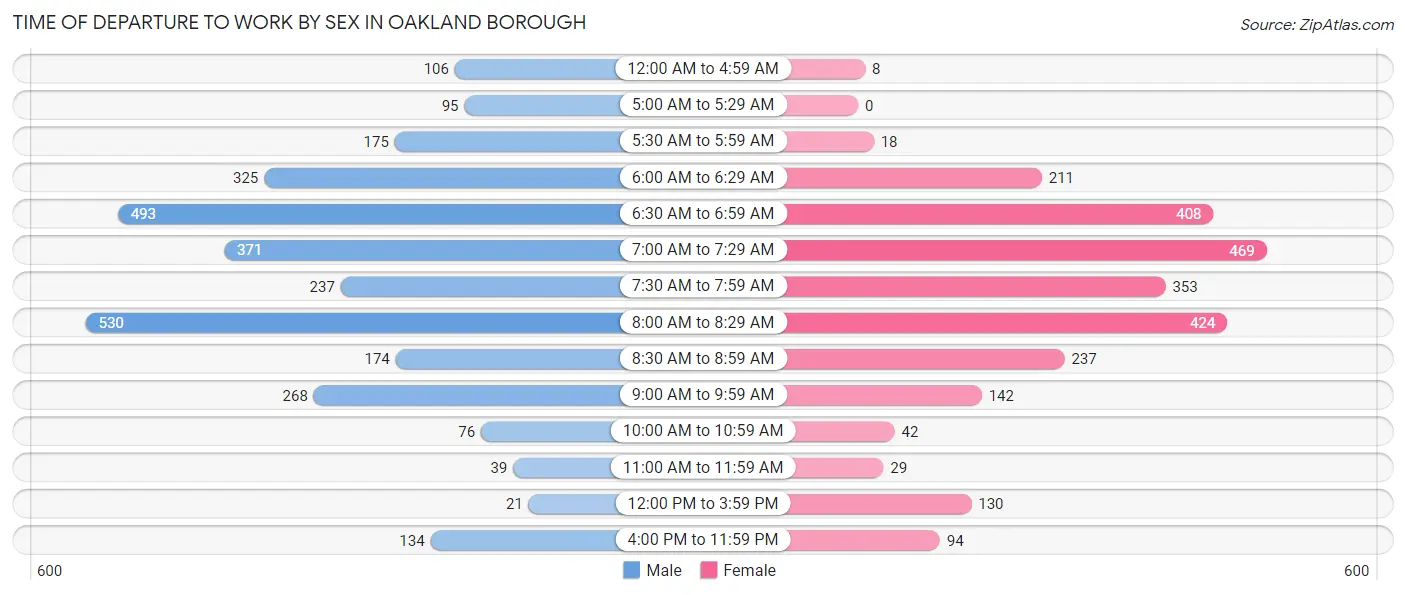
| Time of Departure | Male | Female |
| 12:00 AM to 4:59 AM | 106 (3.5%) | 8 (0.3%) |
| 5:00 AM to 5:29 AM | 95 (3.1%) | 0 (0.0%) |
| 5:30 AM to 5:59 AM | 175 (5.8%) | 18 (0.7%) |
| 6:00 AM to 6:29 AM | 325 (10.7%) | 211 (8.2%) |
| 6:30 AM to 6:59 AM | 493 (16.2%) | 408 (15.9%) |
| 7:00 AM to 7:29 AM | 371 (12.2%) | 469 (18.3%) |
| 7:30 AM to 7:59 AM | 237 (7.8%) | 353 (13.8%) |
| 8:00 AM to 8:29 AM | 530 (17.4%) | 424 (16.5%) |
| 8:30 AM to 8:59 AM | 174 (5.7%) | 237 (9.2%) |
| 9:00 AM to 9:59 AM | 268 (8.8%) | 142 (5.5%) |
| 10:00 AM to 10:59 AM | 76 (2.5%) | 42 (1.6%) |
| 11:00 AM to 11:59 AM | 39 (1.3%) | 29 (1.1%) |
| 12:00 PM to 3:59 PM | 21 (0.7%) | 130 (5.1%) |
| 4:00 PM to 11:59 PM | 134 (4.4%) | 94 (3.7%) |
| Total | 3,044 (100.0%) | 2,565 (100.0%) |
Housing Occupancy in Oakland borough
Occupancy by Ownership in Oakland borough
Of the total 4,381 dwellings in Oakland borough, owner-occupied units account for 3,989 (91.0%), while renter-occupied units make up 392 (8.9%).
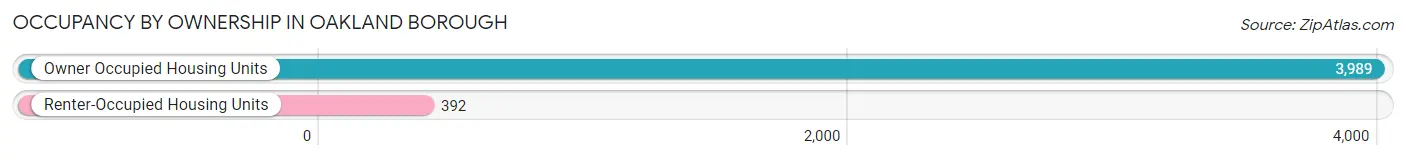
| Occupancy | # Housing Units | % Housing Units |
| Owner Occupied Housing Units | 3,989 | 91.0% |
| Renter-Occupied Housing Units | 392 | 8.9% |
| Total Occupied Housing Units | 4,381 | 100.0% |
Occupancy by Household Size in Oakland borough
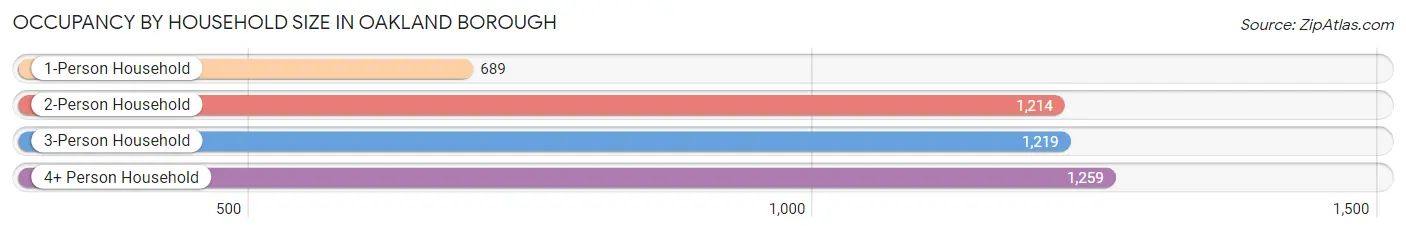
| Household Size | # Housing Units | % Housing Units |
| 1-Person Household | 689 | 15.7% |
| 2-Person Household | 1,214 | 27.7% |
| 3-Person Household | 1,219 | 27.8% |
| 4+ Person Household | 1,259 | 28.7% |
| Total Housing Units | 4,381 | 100.0% |
Occupancy by Ownership by Household Size in Oakland borough
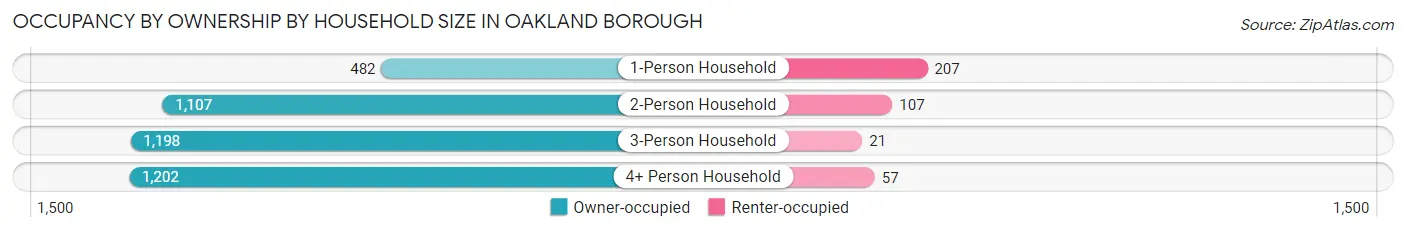
| Household Size | Owner-occupied | Renter-occupied |
| 1-Person Household | 482 (70.0%) | 207 (30.0%) |
| 2-Person Household | 1,107 (91.2%) | 107 (8.8%) |
| 3-Person Household | 1,198 (98.3%) | 21 (1.7%) |
| 4+ Person Household | 1,202 (95.5%) | 57 (4.5%) |
| Total Housing Units | 3,989 (91.0%) | 392 (8.9%) |
Occupancy by Educational Attainment in Oakland borough
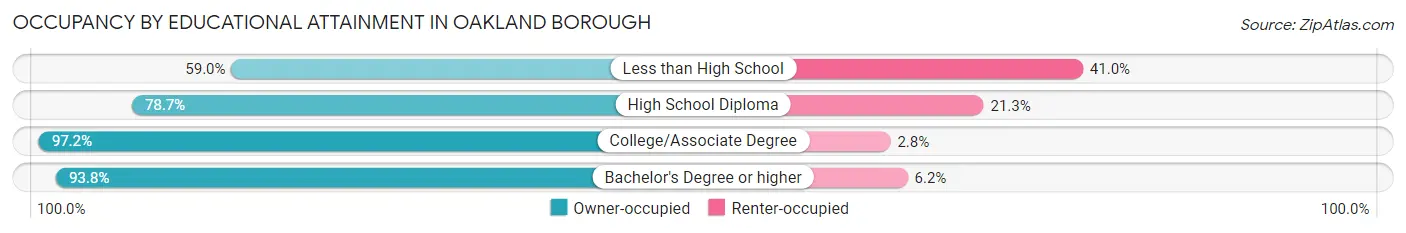
| Household Size | Owner-occupied | Renter-occupied |
| Less than High School | 95 (59.0%) | 66 (41.0%) |
| High School Diploma | 499 (78.7%) | 135 (21.3%) |
| College/Associate Degree | 928 (97.2%) | 27 (2.8%) |
| Bachelor's Degree or higher | 2,467 (93.8%) | 164 (6.2%) |
Occupancy by Age of Householder in Oakland borough
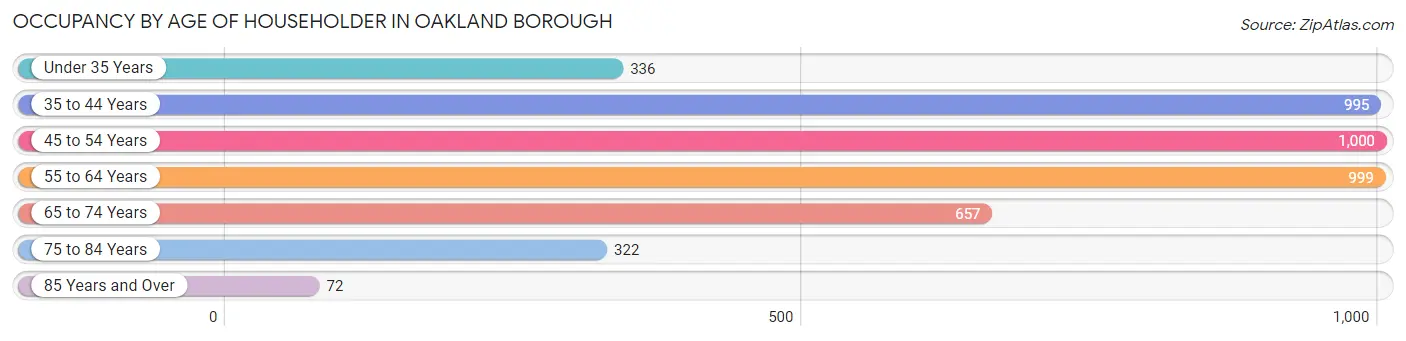
| Age Bracket | # Households | % Households |
| Under 35 Years | 336 | 7.7% |
| 35 to 44 Years | 995 | 22.7% |
| 45 to 54 Years | 1,000 | 22.8% |
| 55 to 64 Years | 999 | 22.8% |
| 65 to 74 Years | 657 | 15.0% |
| 75 to 84 Years | 322 | 7.3% |
| 85 Years and Over | 72 | 1.6% |
| Total | 4,381 | 100.0% |
Housing Finances in Oakland borough
Median Income by Occupancy in Oakland borough
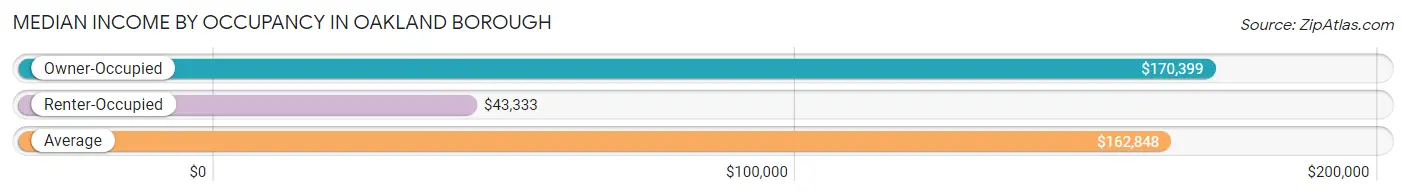
| Occupancy Type | # Households | Median Income |
| Owner-Occupied | 3,989 (91.0%) | $170,399 |
| Renter-Occupied | 392 (8.9%) | $43,333 |
| Average | 4,381 (100.0%) | $162,848 |
Occupancy by Householder Income Bracket in Oakland borough
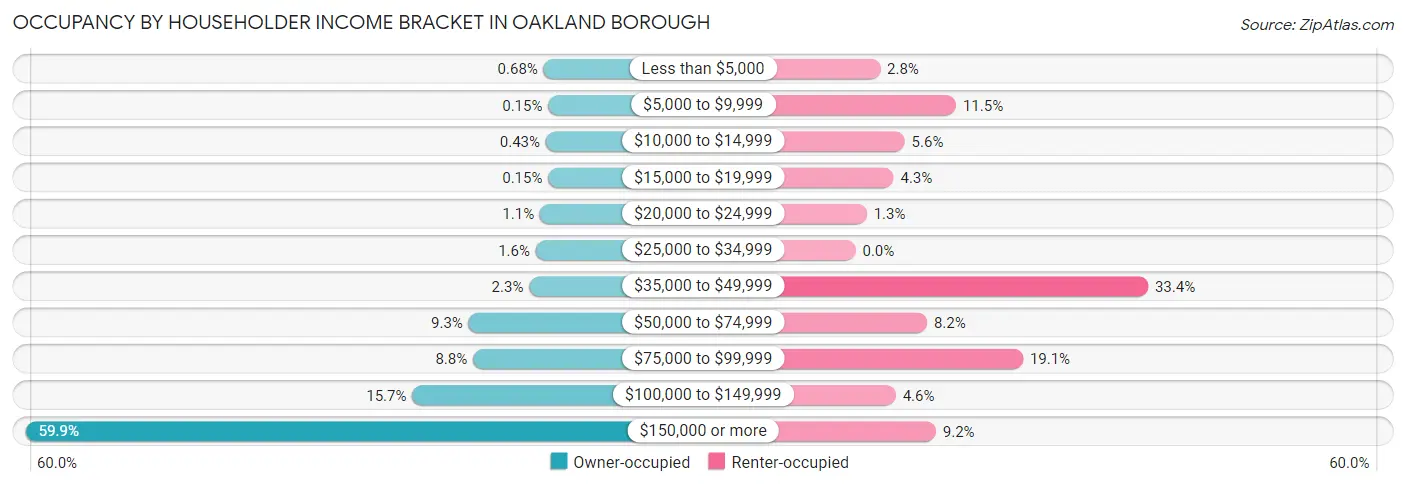
| Income Bracket | Owner-occupied | Renter-occupied |
| Less than $5,000 | 27 (0.7%) | 11 (2.8%) |
| $5,000 to $9,999 | 6 (0.2%) | 45 (11.5%) |
| $10,000 to $14,999 | 17 (0.4%) | 22 (5.6%) |
| $15,000 to $19,999 | 6 (0.2%) | 17 (4.3%) |
| $20,000 to $24,999 | 44 (1.1%) | 5 (1.3%) |
| $25,000 to $34,999 | 63 (1.6%) | 0 (0.0%) |
| $35,000 to $49,999 | 93 (2.3%) | 131 (33.4%) |
| $50,000 to $74,999 | 369 (9.2%) | 32 (8.2%) |
| $75,000 to $99,999 | 349 (8.7%) | 75 (19.1%) |
| $100,000 to $149,999 | 626 (15.7%) | 18 (4.6%) |
| $150,000 or more | 2,389 (59.9%) | 36 (9.2%) |
| Total | 3,989 (100.0%) | 392 (100.0%) |
Monthly Housing Cost Tiers in Oakland borough
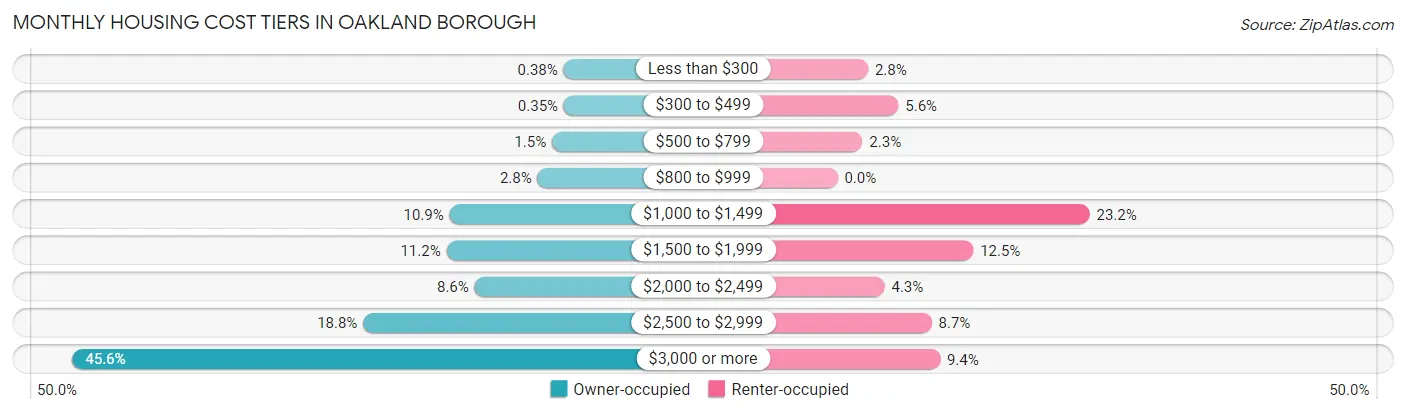
| Monthly Cost | Owner-occupied | Renter-occupied |
| Less than $300 | 15 (0.4%) | 11 (2.8%) |
| $300 to $499 | 14 (0.4%) | 22 (5.6%) |
| $500 to $799 | 58 (1.5%) | 9 (2.3%) |
| $800 to $999 | 111 (2.8%) | 0 (0.0%) |
| $1,000 to $1,499 | 434 (10.9%) | 91 (23.2%) |
| $1,500 to $1,999 | 445 (11.2%) | 49 (12.5%) |
| $2,000 to $2,499 | 342 (8.6%) | 17 (4.3%) |
| $2,500 to $2,999 | 751 (18.8%) | 34 (8.7%) |
| $3,000 or more | 1,819 (45.6%) | 37 (9.4%) |
| Total | 3,989 (100.0%) | 392 (100.0%) |
Physical Housing Characteristics in Oakland borough
Housing Structures in Oakland borough
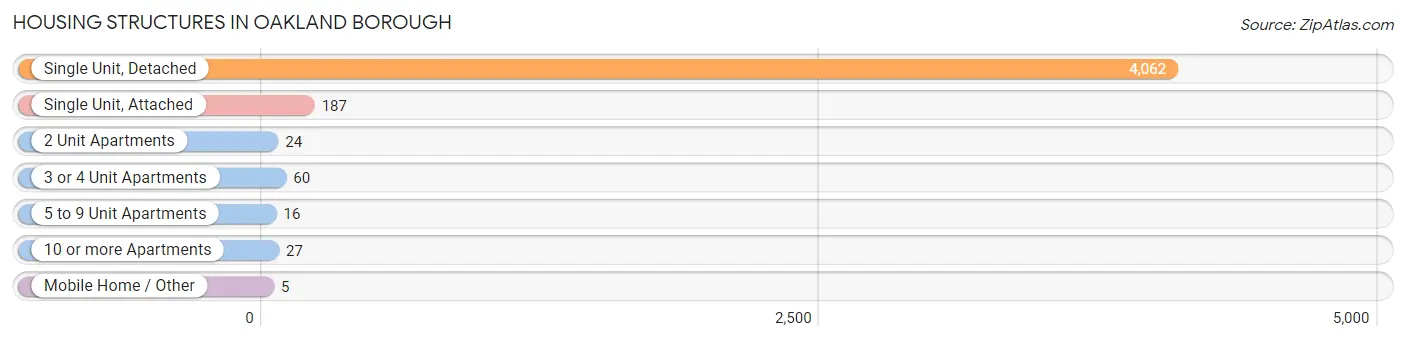
| Structure Type | # Housing Units | % Housing Units |
| Single Unit, Detached | 4,062 | 92.7% |
| Single Unit, Attached | 187 | 4.3% |
| 2 Unit Apartments | 24 | 0.5% |
| 3 or 4 Unit Apartments | 60 | 1.4% |
| 5 to 9 Unit Apartments | 16 | 0.4% |
| 10 or more Apartments | 27 | 0.6% |
| Mobile Home / Other | 5 | 0.1% |
| Total | 4,381 | 100.0% |
Housing Structures by Occupancy in Oakland borough
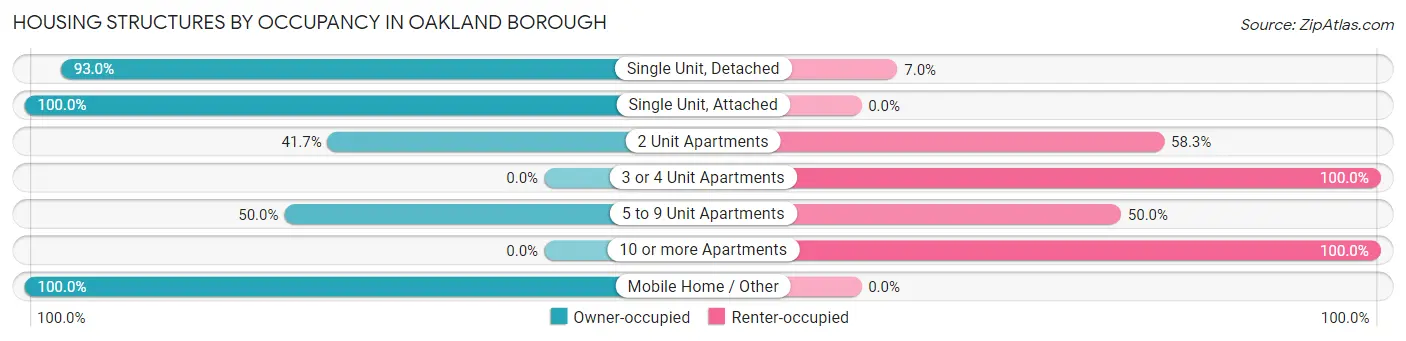
| Structure Type | Owner-occupied | Renter-occupied |
| Single Unit, Detached | 3,779 (93.0%) | 283 (7.0%) |
| Single Unit, Attached | 187 (100.0%) | 0 (0.0%) |
| 2 Unit Apartments | 10 (41.7%) | 14 (58.3%) |
| 3 or 4 Unit Apartments | 0 (0.0%) | 60 (100.0%) |
| 5 to 9 Unit Apartments | 8 (50.0%) | 8 (50.0%) |
| 10 or more Apartments | 0 (0.0%) | 27 (100.0%) |
| Mobile Home / Other | 5 (100.0%) | 0 (0.0%) |
| Total | 3,989 (91.0%) | 392 (8.9%) |
Housing Structures by Number of Rooms in Oakland borough
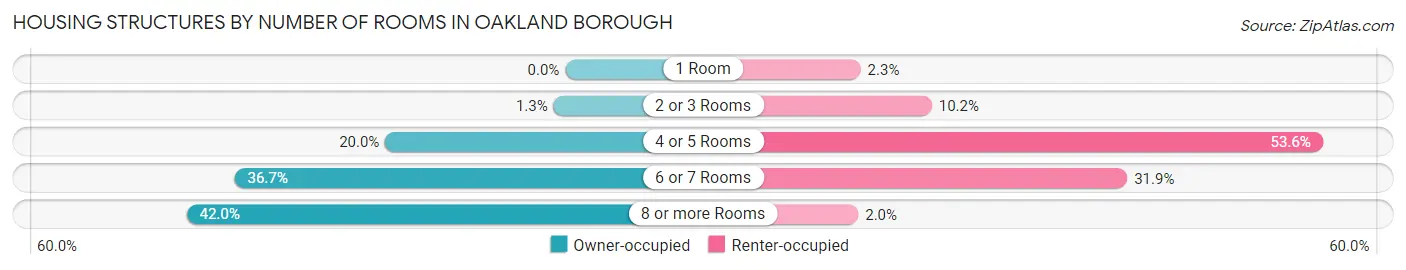
| Number of Rooms | Owner-occupied | Renter-occupied |
| 1 Room | 0 (0.0%) | 9 (2.3%) |
| 2 or 3 Rooms | 52 (1.3%) | 40 (10.2%) |
| 4 or 5 Rooms | 797 (20.0%) | 210 (53.6%) |
| 6 or 7 Rooms | 1,464 (36.7%) | 125 (31.9%) |
| 8 or more Rooms | 1,676 (42.0%) | 8 (2.0%) |
| Total | 3,989 (100.0%) | 392 (100.0%) |
Housing Structure by Heating Type in Oakland borough
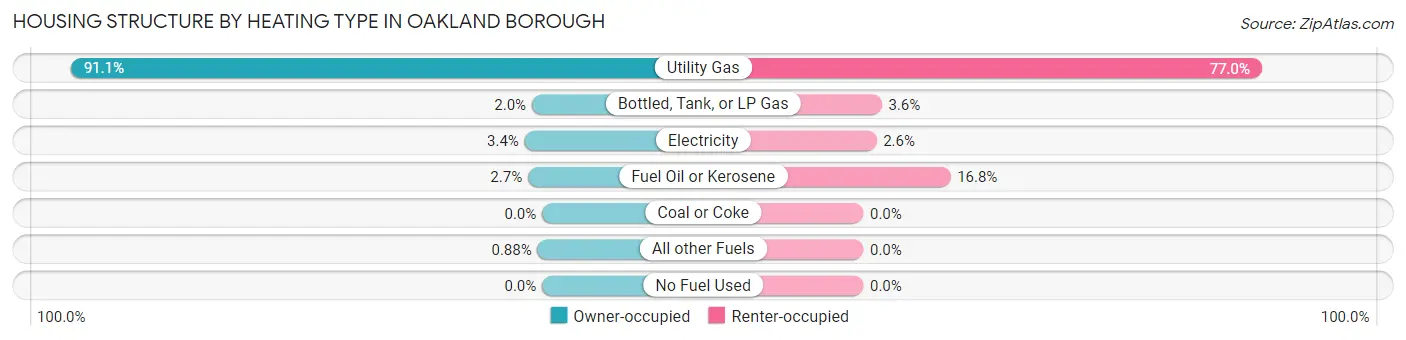
| Heating Type | Owner-occupied | Renter-occupied |
| Utility Gas | 3,633 (91.1%) | 302 (77.0%) |
| Bottled, Tank, or LP Gas | 78 (2.0%) | 14 (3.6%) |
| Electricity | 134 (3.4%) | 10 (2.5%) |
| Fuel Oil or Kerosene | 109 (2.7%) | 66 (16.8%) |
| Coal or Coke | 0 (0.0%) | 0 (0.0%) |
| All other Fuels | 35 (0.9%) | 0 (0.0%) |
| No Fuel Used | 0 (0.0%) | 0 (0.0%) |
| Total | 3,989 (100.0%) | 392 (100.0%) |
Household Vehicle Usage in Oakland borough
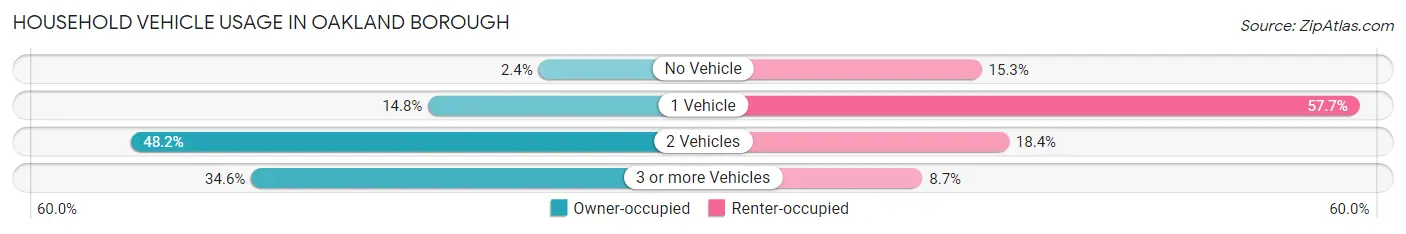
| Vehicles per Household | Owner-occupied | Renter-occupied |
| No Vehicle | 97 (2.4%) | 60 (15.3%) |
| 1 Vehicle | 590 (14.8%) | 226 (57.7%) |
| 2 Vehicles | 1,921 (48.2%) | 72 (18.4%) |
| 3 or more Vehicles | 1,381 (34.6%) | 34 (8.7%) |
| Total | 3,989 (100.0%) | 392 (100.0%) |
Real Estate & Mortgages in Oakland borough
Real Estate and Mortgage Overview in Oakland borough
| Characteristic | Without Mortgage | With Mortgage |
| Housing Units | 1,146 | 2,843 |
| Median Property Value | $534,400 | $536,400 |
| Median Household Income | $115,167 | $1,975 |
| Monthly Housing Costs | $1,487 | $1,799 |
| Real Estate Taxes | $10,001 | $35 |
Property Value by Mortgage Status in Oakland borough
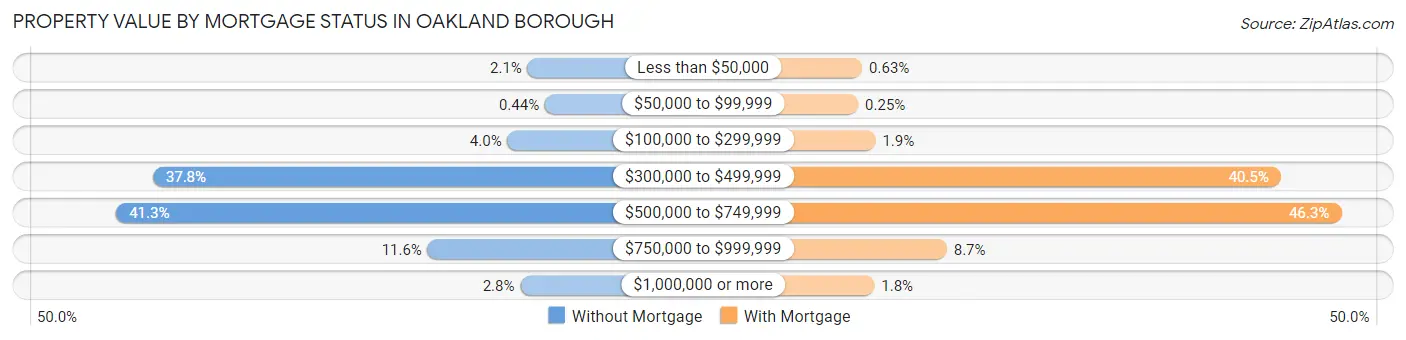
| Property Value | Without Mortgage | With Mortgage |
| Less than $50,000 | 24 (2.1%) | 18 (0.6%) |
| $50,000 to $99,999 | 5 (0.4%) | 7 (0.3%) |
| $100,000 to $299,999 | 46 (4.0%) | 54 (1.9%) |
| $300,000 to $499,999 | 433 (37.8%) | 1,151 (40.5%) |
| $500,000 to $749,999 | 473 (41.3%) | 1,315 (46.3%) |
| $750,000 to $999,999 | 133 (11.6%) | 247 (8.7%) |
| $1,000,000 or more | 32 (2.8%) | 51 (1.8%) |
| Total | 1,146 (100.0%) | 2,843 (100.0%) |
Household Income by Mortgage Status in Oakland borough
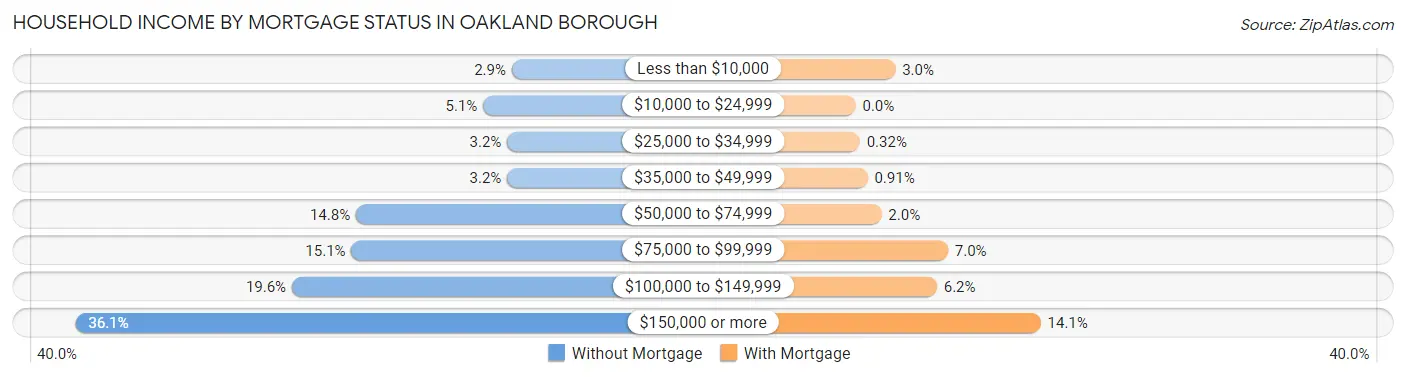
| Household Income | Without Mortgage | With Mortgage |
| Less than $10,000 | 33 (2.9%) | 86 (3.0%) |
| $10,000 to $24,999 | 58 (5.1%) | 0 (0.0%) |
| $25,000 to $34,999 | 37 (3.2%) | 9 (0.3%) |
| $35,000 to $49,999 | 37 (3.2%) | 26 (0.9%) |
| $50,000 to $74,999 | 169 (14.7%) | 56 (2.0%) |
| $75,000 to $99,999 | 173 (15.1%) | 200 (7.0%) |
| $100,000 to $149,999 | 225 (19.6%) | 176 (6.2%) |
| $150,000 or more | 414 (36.1%) | 401 (14.1%) |
| Total | 1,146 (100.0%) | 2,843 (100.0%) |
Property Value to Household Income Ratio in Oakland borough
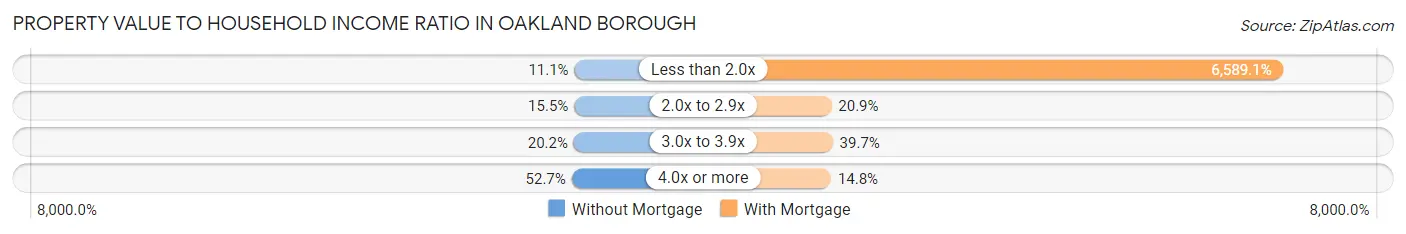
| Value-to-Income Ratio | Without Mortgage | With Mortgage |
| Less than 2.0x | 127 (11.1%) | 187,327 (6,589.1%) |
| 2.0x to 2.9x | 177 (15.4%) | 595 (20.9%) |
| 3.0x to 3.9x | 231 (20.2%) | 1,128 (39.7%) |
| 4.0x or more | 604 (52.7%) | 421 (14.8%) |
| Total | 1,146 (100.0%) | 2,843 (100.0%) |
Real Estate Taxes by Mortgage Status in Oakland borough
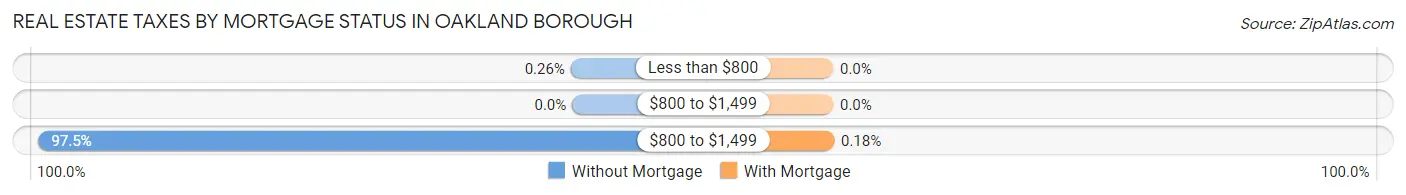
| Property Taxes | Without Mortgage | With Mortgage |
| Less than $800 | 3 (0.3%) | 0 (0.0%) |
| $800 to $1,499 | 0 (0.0%) | 0 (0.0%) |
| $800 to $1,499 | 1,117 (97.5%) | 5 (0.2%) |
| Total | 1,146 (100.0%) | 2,843 (100.0%) |
Health & Disability in Oakland borough
Health Insurance Coverage by Age in Oakland borough
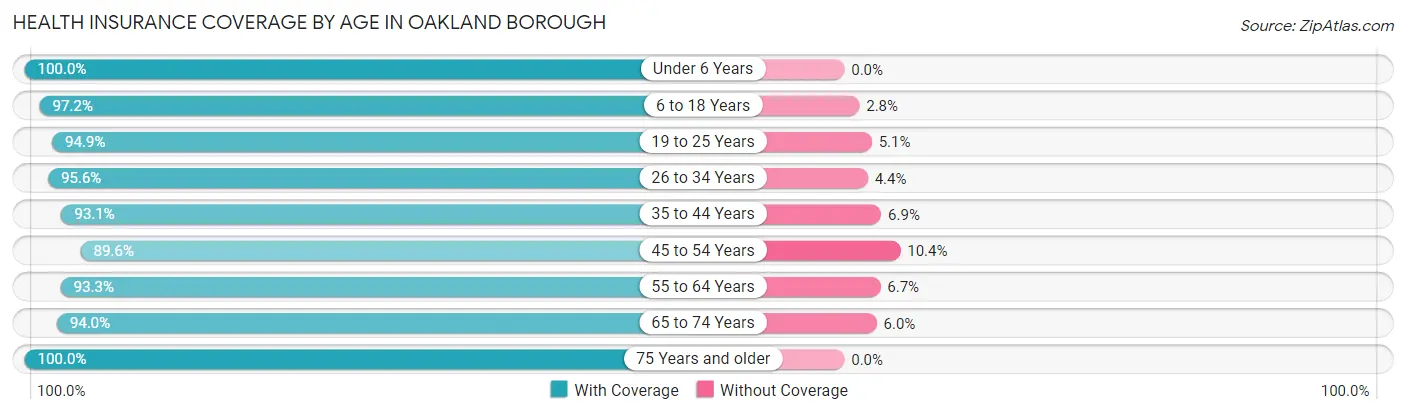
| Age Bracket | With Coverage | Without Coverage |
| Under 6 Years | 850 (100.0%) | 0 (0.0%) |
| 6 to 18 Years | 2,153 (97.2%) | 62 (2.8%) |
| 19 to 25 Years | 889 (94.9%) | 48 (5.1%) |
| 26 to 34 Years | 1,076 (95.6%) | 49 (4.4%) |
| 35 to 44 Years | 1,560 (93.1%) | 115 (6.9%) |
| 45 to 54 Years | 1,835 (89.6%) | 214 (10.4%) |
| 55 to 64 Years | 1,763 (93.3%) | 127 (6.7%) |
| 65 to 74 Years | 1,015 (94.0%) | 65 (6.0%) |
| 75 Years and older | 730 (100.0%) | 0 (0.0%) |
| Total | 11,871 (94.6%) | 680 (5.4%) |
Health Insurance Coverage by Citizenship Status in Oakland borough
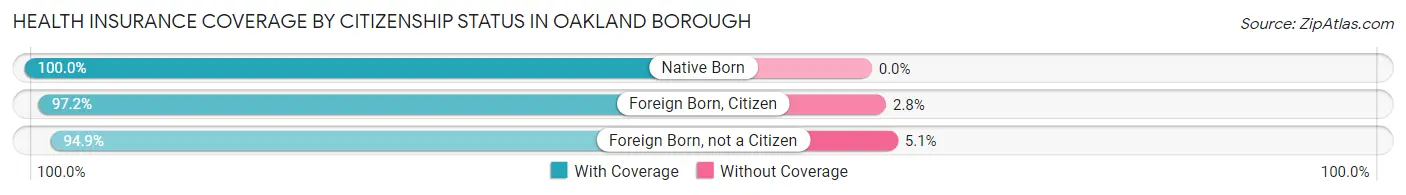
| Citizenship Status | With Coverage | Without Coverage |
| Native Born | 850 (100.0%) | 0 (0.0%) |
| Foreign Born, Citizen | 2,153 (97.2%) | 62 (2.8%) |
| Foreign Born, not a Citizen | 889 (94.9%) | 48 (5.1%) |
Health Insurance Coverage by Household Income in Oakland borough
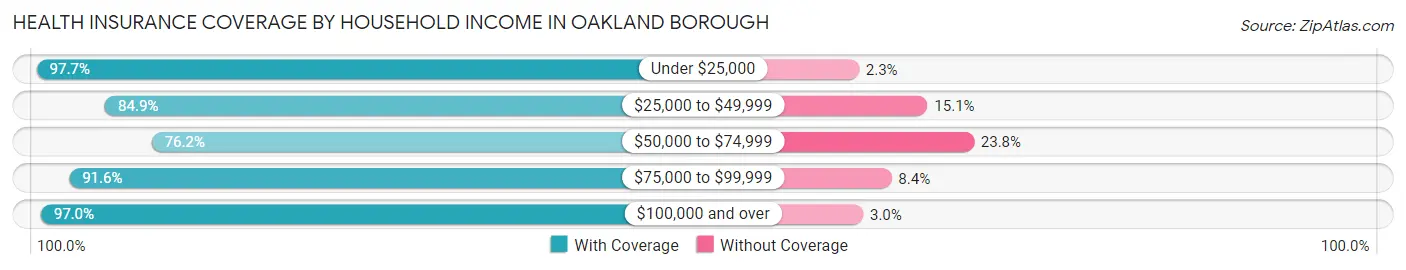
| Household Income | With Coverage | Without Coverage |
| Under $25,000 | 259 (97.7%) | 6 (2.3%) |
| $25,000 to $49,999 | 461 (84.9%) | 82 (15.1%) |
| $50,000 to $74,999 | 653 (76.2%) | 204 (23.8%) |
| $75,000 to $99,999 | 986 (91.6%) | 90 (8.4%) |
| $100,000 and over | 9,493 (97.0%) | 298 (3.0%) |
Public vs Private Health Insurance Coverage by Age in Oakland borough
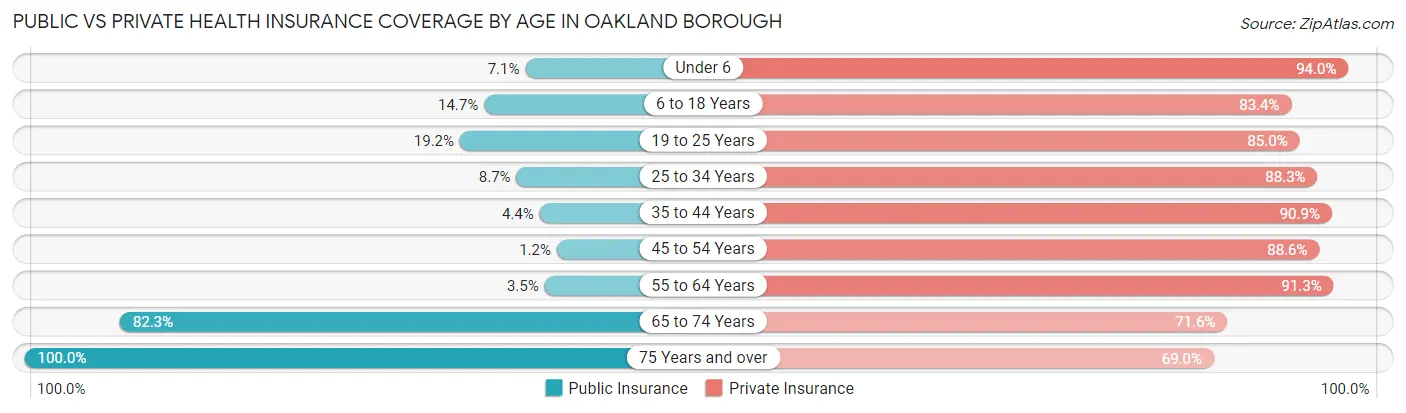
| Age Bracket | Public Insurance | Private Insurance |
| Under 6 | 60 (7.1%) | 799 (94.0%) |
| 6 to 18 Years | 326 (14.7%) | 1,848 (83.4%) |
| 19 to 25 Years | 180 (19.2%) | 796 (85.0%) |
| 25 to 34 Years | 98 (8.7%) | 993 (88.3%) |
| 35 to 44 Years | 74 (4.4%) | 1,523 (90.9%) |
| 45 to 54 Years | 25 (1.2%) | 1,816 (88.6%) |
| 55 to 64 Years | 66 (3.5%) | 1,725 (91.3%) |
| 65 to 74 Years | 889 (82.3%) | 773 (71.6%) |
| 75 Years and over | 730 (100.0%) | 504 (69.0%) |
| Total | 2,448 (19.5%) | 10,777 (85.9%) |
Disability Status by Sex by Age in Oakland borough
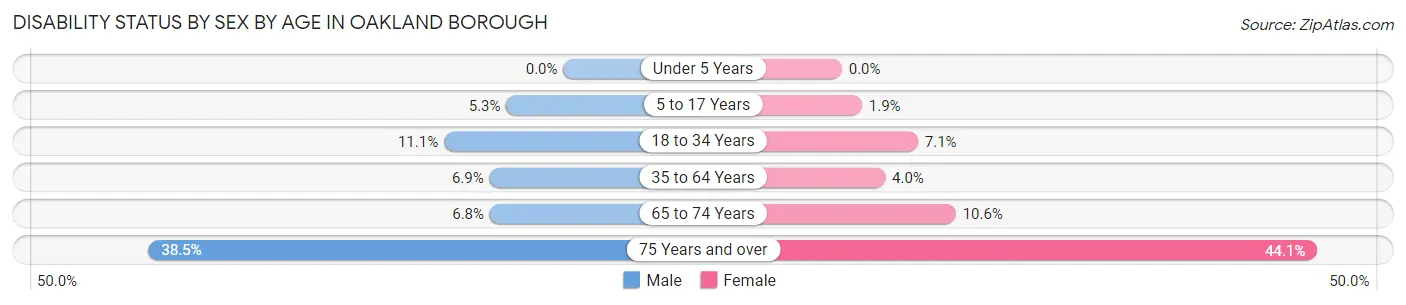
| Age Bracket | Male | Female |
| Under 5 Years | 0 (0.0%) | 0 (0.0%) |
| 5 to 17 Years | 63 (5.3%) | 18 (1.9%) |
| 18 to 34 Years | 117 (11.1%) | 84 (7.1%) |
| 35 to 64 Years | 204 (6.9%) | 106 (4.0%) |
| 65 to 74 Years | 33 (6.8%) | 63 (10.6%) |
| 75 Years and over | 124 (38.5%) | 180 (44.1%) |
Disability Class by Sex by Age in Oakland borough
Disability Class: Hearing Difficulty
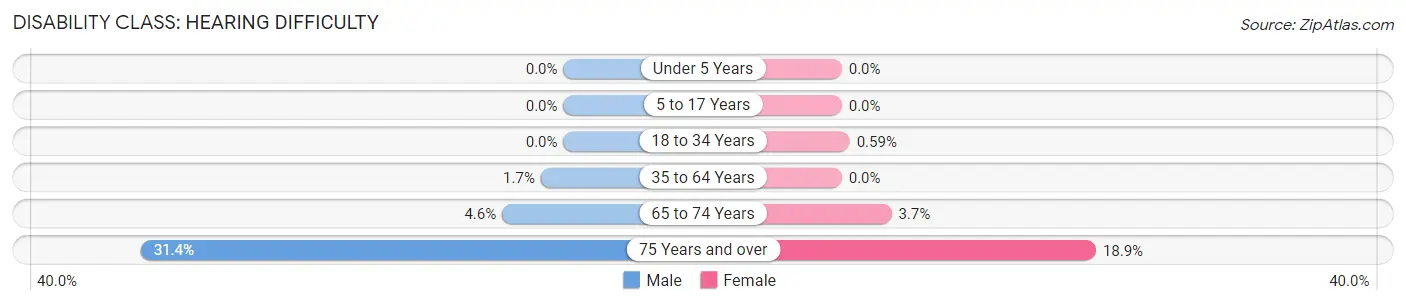
| Age Bracket | Male | Female |
| Under 5 Years | 0 (0.0%) | 0 (0.0%) |
| 5 to 17 Years | 0 (0.0%) | 0 (0.0%) |
| 18 to 34 Years | 0 (0.0%) | 7 (0.6%) |
| 35 to 64 Years | 50 (1.7%) | 0 (0.0%) |
| 65 to 74 Years | 22 (4.5%) | 22 (3.7%) |
| 75 Years and over | 101 (31.4%) | 77 (18.9%) |
Disability Class: Vision Difficulty
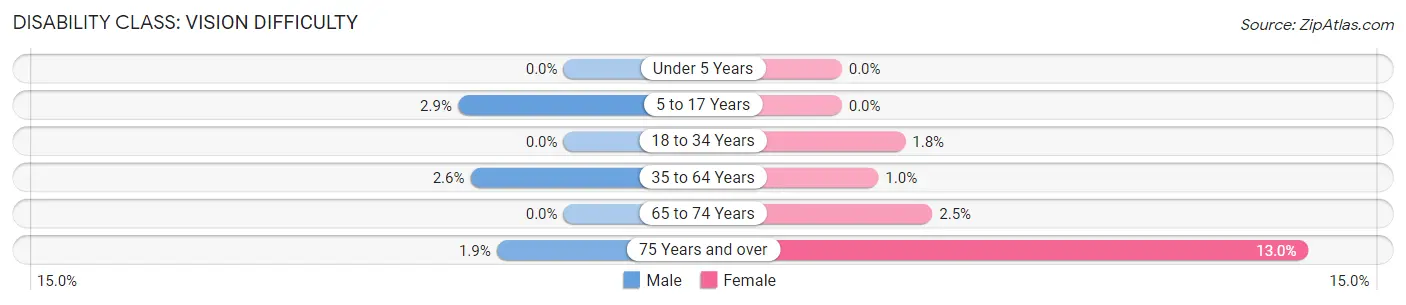
| Age Bracket | Male | Female |
| Under 5 Years | 0 (0.0%) | 0 (0.0%) |
| 5 to 17 Years | 35 (2.9%) | 0 (0.0%) |
| 18 to 34 Years | 0 (0.0%) | 21 (1.8%) |
| 35 to 64 Years | 77 (2.6%) | 27 (1.0%) |
| 65 to 74 Years | 0 (0.0%) | 15 (2.5%) |
| 75 Years and over | 6 (1.9%) | 53 (13.0%) |
Disability Class: Cognitive Difficulty
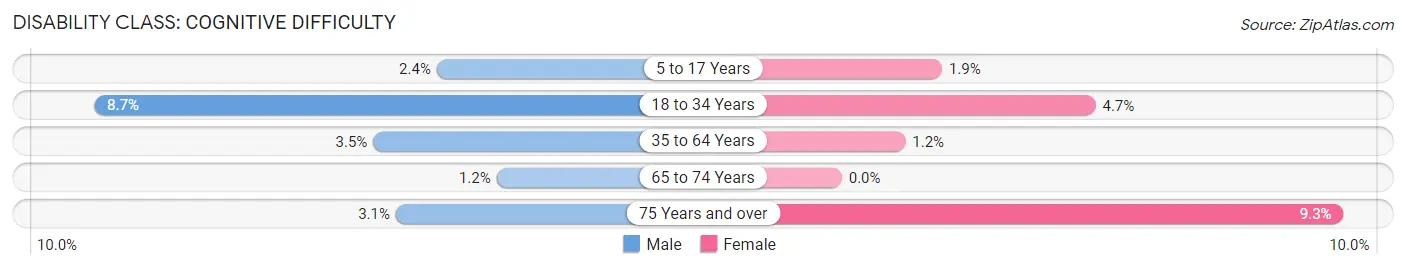
| Age Bracket | Male | Female |
| 5 to 17 Years | 28 (2.4%) | 18 (1.9%) |
| 18 to 34 Years | 92 (8.7%) | 56 (4.7%) |
| 35 to 64 Years | 105 (3.5%) | 31 (1.2%) |
| 65 to 74 Years | 6 (1.2%) | 0 (0.0%) |
| 75 Years and over | 10 (3.1%) | 38 (9.3%) |
Disability Class: Ambulatory Difficulty
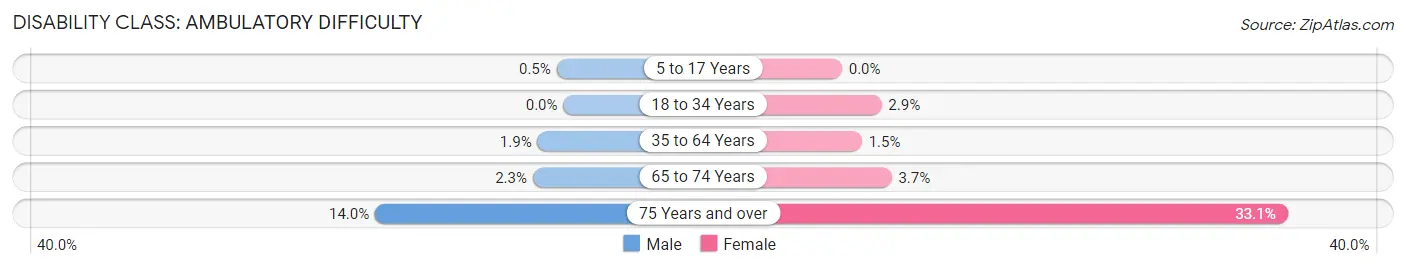
| Age Bracket | Male | Female |
| 5 to 17 Years | 6 (0.5%) | 0 (0.0%) |
| 18 to 34 Years | 0 (0.0%) | 35 (2.9%) |
| 35 to 64 Years | 57 (1.9%) | 39 (1.5%) |
| 65 to 74 Years | 11 (2.3%) | 22 (3.7%) |
| 75 Years and over | 45 (14.0%) | 135 (33.1%) |
Disability Class: Self-Care Difficulty
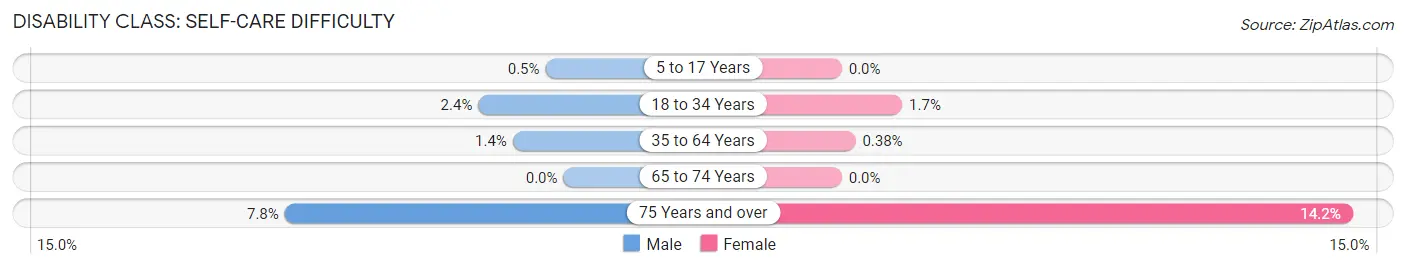
| Age Bracket | Male | Female |
| 5 to 17 Years | 6 (0.5%) | 0 (0.0%) |
| 18 to 34 Years | 25 (2.4%) | 20 (1.7%) |
| 35 to 64 Years | 42 (1.4%) | 10 (0.4%) |
| 65 to 74 Years | 0 (0.0%) | 0 (0.0%) |
| 75 Years and over | 25 (7.8%) | 58 (14.2%) |
Technology Access in Oakland borough
Computing Device Access in Oakland borough
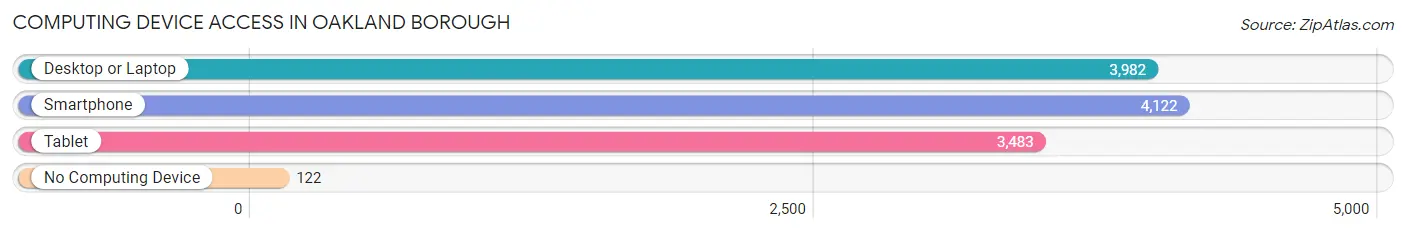
| Device Type | # Households | % Households |
| Desktop or Laptop | 3,982 | 90.9% |
| Smartphone | 4,122 | 94.1% |
| Tablet | 3,483 | 79.5% |
| No Computing Device | 122 | 2.8% |
| Total | 4,381 | 100.0% |
Internet Access in Oakland borough
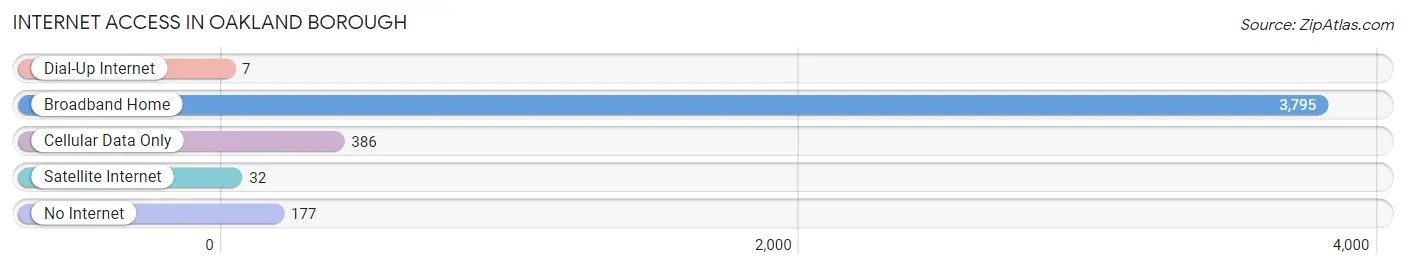
| Internet Type | # Households | % Households |
| Dial-Up Internet | 7 | 0.2% |
| Broadband Home | 3,795 | 86.6% |
| Cellular Data Only | 386 | 8.8% |
| Satellite Internet | 32 | 0.7% |
| No Internet | 177 | 4.0% |
| Total | 4,381 | 100.0% |
Oakland borough Summary
Oakland Borough is a small borough located in Bergen County, New Jersey. It is situated in the northern part of the state, just west of the Hudson River. The borough is bordered by the towns of Franklin Lakes, Wyckoff, Midland Park, and Mahwah. As of the 2010 United States Census, the borough had a total population of 11,619.
Geography
Oakland Borough is located at 40°57'N 74°10'W (40.95, -74.17). According to the United States Census Bureau, the borough has a total area of 4.3 square miles (11.2 km2), all of which is land.
The borough is located in the Ramapo Mountains, a range of the Appalachian Mountains. The borough is mostly hilly, with some flat areas in the northern and eastern parts. The highest point in the borough is the summit of the Ramapo Mountains, which is located in the western part of the borough and rises to an elevation of 1,067 feet (325 m).
Climate
Oakland Borough has a humid continental climate, with cold winters and hot, humid summers. The average annual temperature is 48°F (9°C), and the average annual precipitation is 44 inches (1,118 mm).
Demographics
As of the 2010 United States Census, there were 11,619 people, 4,072 households, and 3,072 families residing in the borough. The population density was 2,711.3 people per square mile (1,045.2/km2). There were 4,232 housing units at an average density of 990.2 per square mile (382.2/km2). The racial makeup of the borough was 87.2% White, 4.2% African American, 0.2% Native American, 5.3% Asian, 0.1% Pacific Islander, 1.3% from other races, and 1.7% from two or more races. Hispanic or Latino of any race were 6.7% of the population.
There were 4,072 households, out of which 37.2% had children under the age of 18 living with them, 63.2% were married couples living together, 8.7% had a female householder with no husband present, and 24.3% were non-families. 20.2% of all households were made up of individuals, and 8.7% had someone living alone who was 65 years of age or older. The average household size was 2.84 and the average family size was 3.33.
In the borough, the population was spread out, with 25.7% under the age of 18, 6.2% from 18 to 24, 25.2% from 25 to 44, 30.2% from 45 to 64, and 12.7% who were 65 years of age or older. The median age was 40 years. For every 100 females, there were 94.2 males. For every 100 females age 18 and over, there were 91.2 males.
The median income for a household in the borough was $90,945, and the median income for a family was $103,945. Males had a median income of $71,945 versus $50,945 for females. The per capita income for the borough was $37,945. About 1.7% of families and 2.7% of the population were below the poverty line, including 2.2% of those under age 18 and 3.2% of those age 65 or over.
Economy
Oakland Borough is home to a variety of businesses, including retail stores, restaurants, and professional services. The borough is also home to several corporate headquarters, including the headquarters of the pharmaceutical company Merck & Co. and the financial services company Prudential Financial.
The borough is served by the Oakland Public Library, which is part of the Bergen County Cooperative Library System. The library offers a variety of services, including books, magazines, newspapers, DVDs, and online resources.
The borough is also home to several parks and recreational facilities, including the Oakland Recreation Center, which offers a variety of activities for children and adults. The borough also has several public and private golf courses, including the Oakland Golf Club and the Oakland Country Club.
Conclusion
Oakland Borough is a small borough located in Bergen County, New Jersey. It is situated in the northern part of the state, just west of the Hudson River. The borough is bordered by the towns of Franklin Lakes, Wyckoff, Midland Park, and Mahwah. As of the 2010 United States Census, the borough had a total population of 11,619. The borough is mostly hilly, with some flat areas in the northern and eastern parts. The borough is home to a variety of businesses, including retail stores, restaurants, and professional services. The borough is also home to several parks and recreational facilities, including the Oakland Recreation Center. Oakland Borough is a great place to live, work, and play.
Common Questions
What is Per Capita Income in Oakland borough?
Per Capita income in Oakland borough is $62,874.
What is the Median Family Income in Oakland borough?
Median Family Income in Oakland borough is $175,242.
What is the Median Household income in Oakland borough?
Median Household Income in Oakland borough is $162,848.
What is Income or Wage Gap in Oakland borough?
Income or Wage Gap in Oakland borough is 35.6%.
Women in Oakland borough earn 64.4 cents for every dollar earned by a man.
What is Inequality or Gini Index in Oakland borough?
Inequality or Gini Index in Oakland borough is 0.36.
What is the Total Population of Oakland borough?
Total Population of Oakland borough is 12,734.
What is the Total Male Population of Oakland borough?
Total Male Population of Oakland borough is 6,497.
What is the Total Female Population of Oakland borough?
Total Female Population of Oakland borough is 6,237.
What is the Ratio of Males per 100 Females in Oakland borough?
There are 104.17 Males per 100 Females in Oakland borough.
What is the Ratio of Females per 100 Males in Oakland borough?
There are 96.00 Females per 100 Males in Oakland borough.
What is the Median Population Age in Oakland borough?
Median Population Age in Oakland borough is 41.9 Years.
What is the Average Family Size in Oakland borough
Average Family Size in Oakland borough is 3.2 People.
What is the Average Household Size in Oakland borough
Average Household Size in Oakland borough is 2.9 People.
How Large is the Labor Force in Oakland borough?
There are 7,281 People in the Labor Forcein in Oakland borough.
What is the Percentage of People in the Labor Force in Oakland borough?
70.3% of People are in the Labor Force in Oakland borough.
What is the Unemployment Rate in Oakland borough?
Unemployment Rate in Oakland borough is 5.3%.