Pompton Lakes borough, NJ Map & Demographics
Pompton Lakes borough Overview
$51,422
PER CAPITA INCOME
$132,281
AVG FAMILY INCOME
$113,781
AVG HOUSEHOLD INCOME
21.2%
WAGE / INCOME GAP [ % ]
78.8¢/ $1
WAGE / INCOME GAP [ $ ]
0.36
INEQUALITY / GINI INDEX
11,052
TOTAL POPULATION
5,470
MALE POPULATION
5,582
FEMALE POPULATION
97.99
MALES / 100 FEMALES
102.05
FEMALES / 100 MALES
39.1
MEDIAN AGE
3.1
AVG FAMILY SIZE
2.6
AVG HOUSEHOLD SIZE
6,530
LABOR FORCE [ PEOPLE ]
73.8%
PERCENT IN LABOR FORCE
3.8%
UNEMPLOYMENT RATE
Income in Pompton Lakes borough
Income Overview in Pompton Lakes borough
Per Capita Income in Pompton Lakes borough is $51,422, while median incomes of families and households are $132,281 and $113,781 respectively.
| Characteristic | Number | Measure |
| Per Capita Income | 11,052 | $51,422 |
| Median Family Income | 2,915 | $132,281 |
| Mean Family Income | 2,915 | $140,577 |
| Median Household Income | 4,227 | $113,781 |
| Mean Household Income | 4,227 | $133,163 |
| Income Deficit | 2,915 | $0 |
| Wage / Income Gap (%) | 11,052 | 21.20% |
| Wage / Income Gap ($) | 11,052 | 78.80¢ per $1 |
| Gini / Inequality Index | 11,052 | 0.36 |
Earnings by Sex in Pompton Lakes borough
Average Earnings in Pompton Lakes borough are $67,745, $74,583 for men and $58,772 for women, a difference of 21.2%.
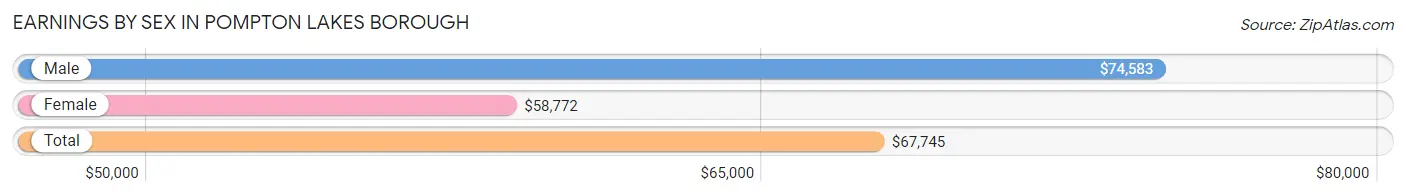
| Sex | Number | Average Earnings |
| Male | 3,409 (50.8%) | $74,583 |
| Female | 3,301 (49.2%) | $58,772 |
| Total | 6,710 (100.0%) | $67,745 |
Earnings by Sex by Income Bracket in Pompton Lakes borough
The most common earnings brackets in Pompton Lakes borough are $100,000+ for men (1,157 | 33.9%) and $75,000 to $99,999 for women (728 | 22.1%).
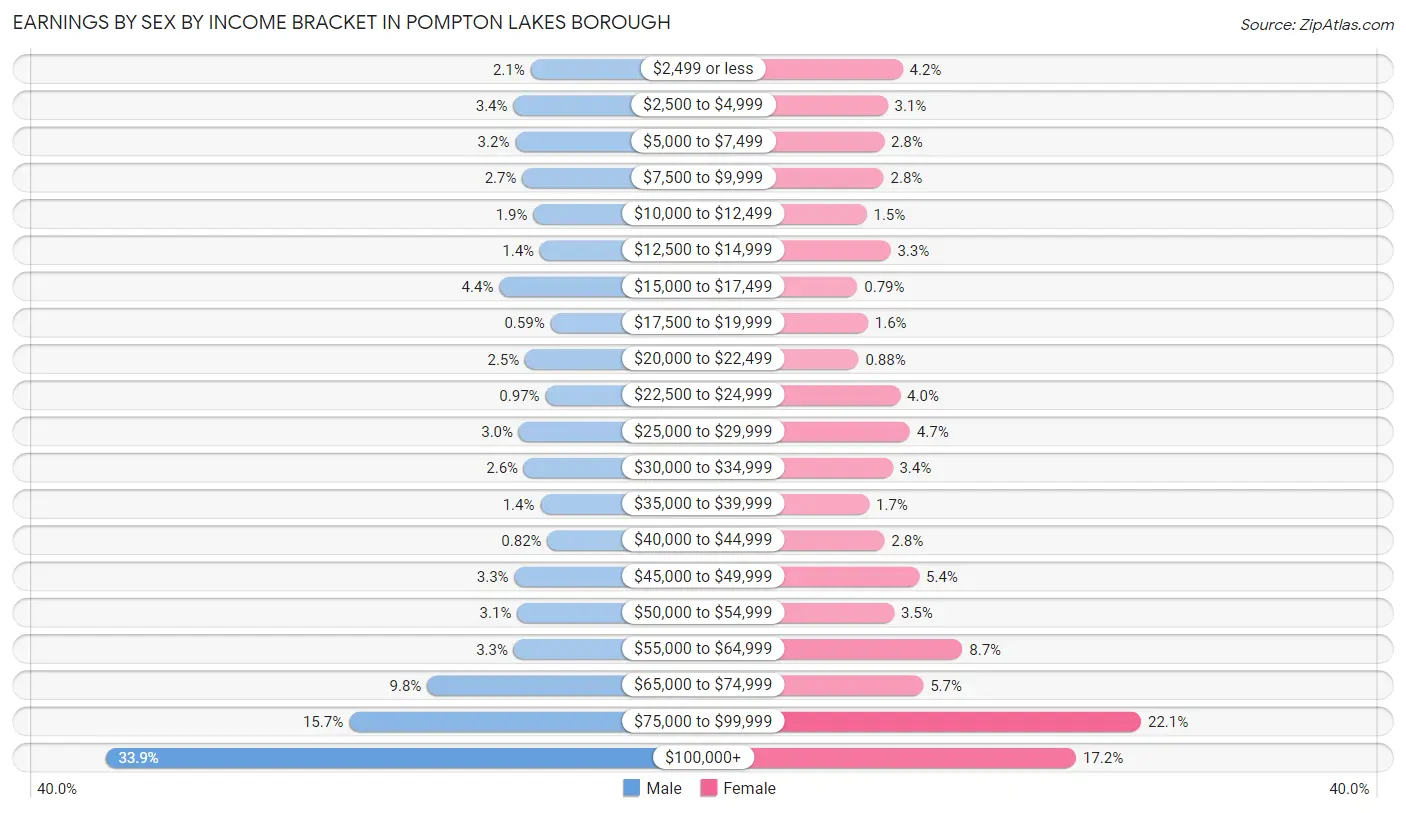
| Income | Male | Female |
| $2,499 or less | 71 (2.1%) | 138 (4.2%) |
| $2,500 to $4,999 | 115 (3.4%) | 101 (3.1%) |
| $5,000 to $7,499 | 110 (3.2%) | 92 (2.8%) |
| $7,500 to $9,999 | 92 (2.7%) | 91 (2.8%) |
| $10,000 to $12,499 | 64 (1.9%) | 49 (1.5%) |
| $12,500 to $14,999 | 47 (1.4%) | 108 (3.3%) |
| $15,000 to $17,499 | 151 (4.4%) | 26 (0.8%) |
| $17,500 to $19,999 | 20 (0.6%) | 52 (1.6%) |
| $20,000 to $22,499 | 85 (2.5%) | 29 (0.9%) |
| $22,500 to $24,999 | 33 (1.0%) | 132 (4.0%) |
| $25,000 to $29,999 | 101 (3.0%) | 156 (4.7%) |
| $30,000 to $34,999 | 88 (2.6%) | 113 (3.4%) |
| $35,000 to $39,999 | 46 (1.3%) | 55 (1.7%) |
| $40,000 to $44,999 | 28 (0.8%) | 93 (2.8%) |
| $45,000 to $49,999 | 112 (3.3%) | 179 (5.4%) |
| $50,000 to $54,999 | 105 (3.1%) | 117 (3.5%) |
| $55,000 to $64,999 | 114 (3.3%) | 286 (8.7%) |
| $65,000 to $74,999 | 335 (9.8%) | 189 (5.7%) |
| $75,000 to $99,999 | 535 (15.7%) | 728 (22.1%) |
| $100,000+ | 1,157 (33.9%) | 567 (17.2%) |
| Total | 3,409 (100.0%) | 3,301 (100.0%) |
Earnings by Sex by Educational Attainment in Pompton Lakes borough
Average earnings in Pompton Lakes borough are $85,537 for men and $68,395 for women, a difference of 20.0%. Men with an educational attainment of college or associate's degree enjoy the highest average annual earnings of $92,540, while those with high school diploma education earn the least with $69,688. Women with an educational attainment of graduate degree earn the most with the average annual earnings of $86,920, while those with less than high school education have the smallest earnings of $24,453.
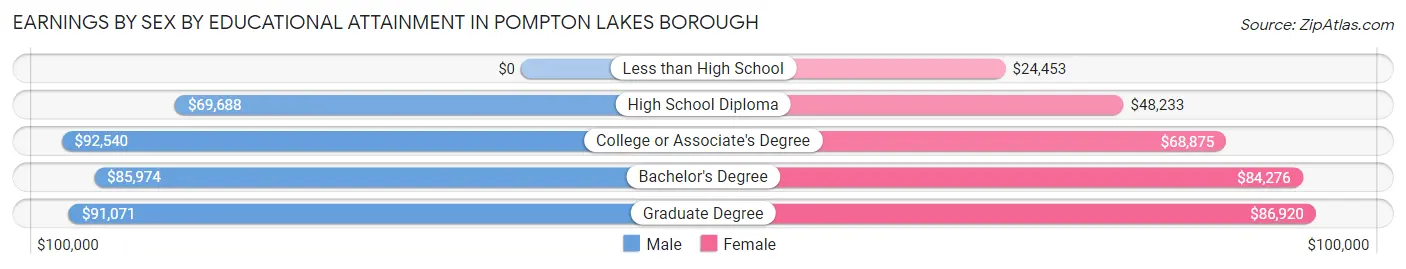
| Educational Attainment | Male Income | Female Income |
| Less than High School | - | - |
| High School Diploma | $69,688 | $48,233 |
| College or Associate's Degree | $92,540 | $68,875 |
| Bachelor's Degree | $85,974 | $84,276 |
| Graduate Degree | $91,071 | $86,920 |
| Total | $85,537 | $68,395 |
Family Income in Pompton Lakes borough
Family Income Brackets in Pompton Lakes borough
According to the Pompton Lakes borough family income data, there are 790 families falling into the $100,000 to $149,999 income range, which is the most common income bracket and makes up 27.1% of all families. Conversely, the $10,000 to $14,999 income bracket is the least frequent group with only 17 families (0.6%) belonging to this category.
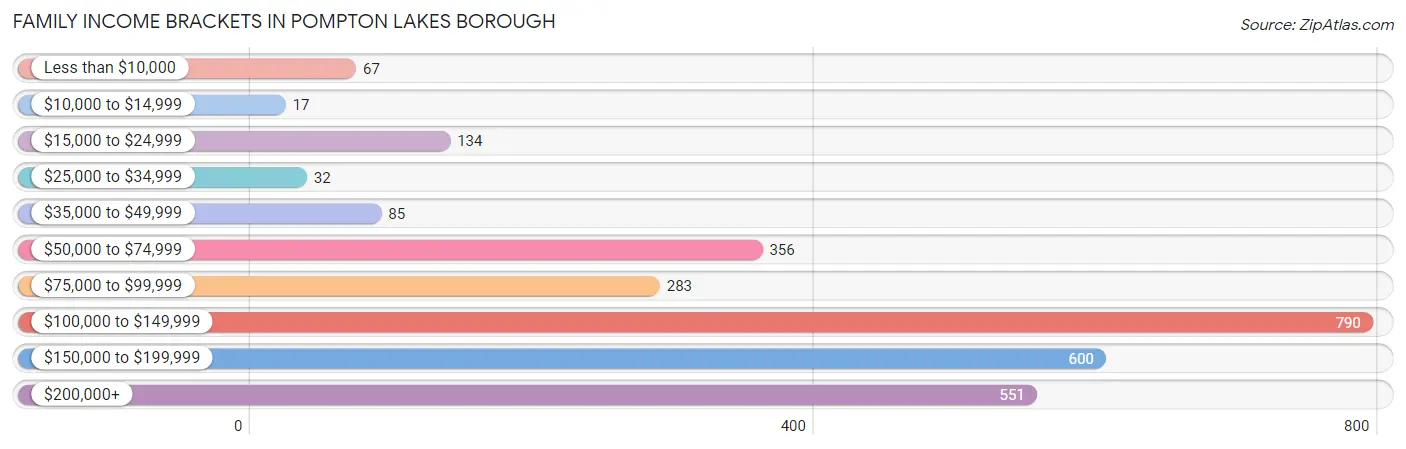
| Income Bracket | # Families | % Families |
| Less than $10,000 | 67 | 2.3% |
| $10,000 to $14,999 | 17 | 0.6% |
| $15,000 to $24,999 | 134 | 4.6% |
| $25,000 to $34,999 | 32 | 1.1% |
| $35,000 to $49,999 | 85 | 2.9% |
| $50,000 to $74,999 | 356 | 12.2% |
| $75,000 to $99,999 | 283 | 9.7% |
| $100,000 to $149,999 | 790 | 27.1% |
| $150,000 to $199,999 | 600 | 20.6% |
| $200,000+ | 551 | 18.9% |
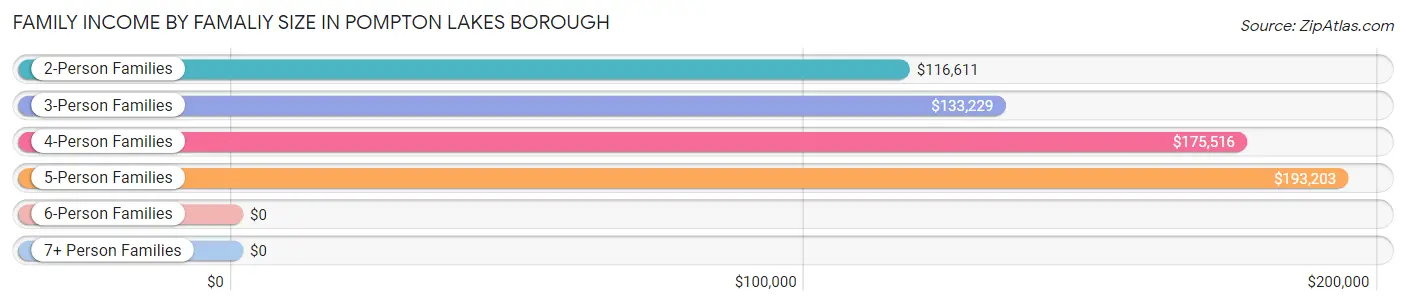
Family Income by Famaliy Size in Pompton Lakes borough
5-person families (129 | 4.4%) account for the highest median family income in Pompton Lakes borough with $193,203 per family, while 2-person families (1,091 | 37.4%) have the highest median income of $58,306 per family member.
| Income Bracket | # Families | Median Income |
| 2-Person Families | 1,091 (37.4%) | $116,611 |
| 3-Person Families | 828 (28.4%) | $133,229 |
| 4-Person Families | 791 (27.1%) | $175,516 |
| 5-Person Families | 129 (4.4%) | $193,203 |
| 6-Person Families | 76 (2.6%) | $0 |
| 7+ Person Families | 0 (0.0%) | $0 |
| Total | 2,915 (100.0%) | $132,281 |
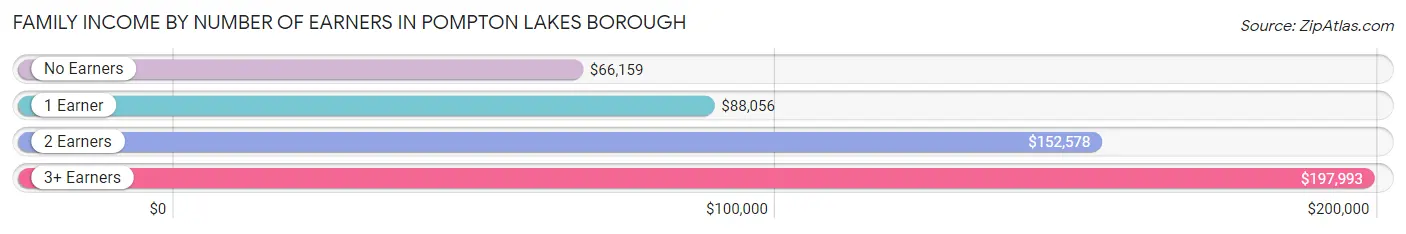
Family Income by Number of Earners in Pompton Lakes borough
The median family income in Pompton Lakes borough is $132,281, with families comprising 3+ earners (379) having the highest median family income of $197,993, while families with no earners (202) have the lowest median family income of $66,159, accounting for 13.0% and 6.9% of families, respectively.
| Number of Earners | # Families | Median Income |
| No Earners | 202 (6.9%) | $66,159 |
| 1 Earner | 786 (27.0%) | $88,056 |
| 2 Earners | 1,548 (53.1%) | $152,578 |
| 3+ Earners | 379 (13.0%) | $197,993 |
| Total | 2,915 (100.0%) | $132,281 |
Household Income in Pompton Lakes borough
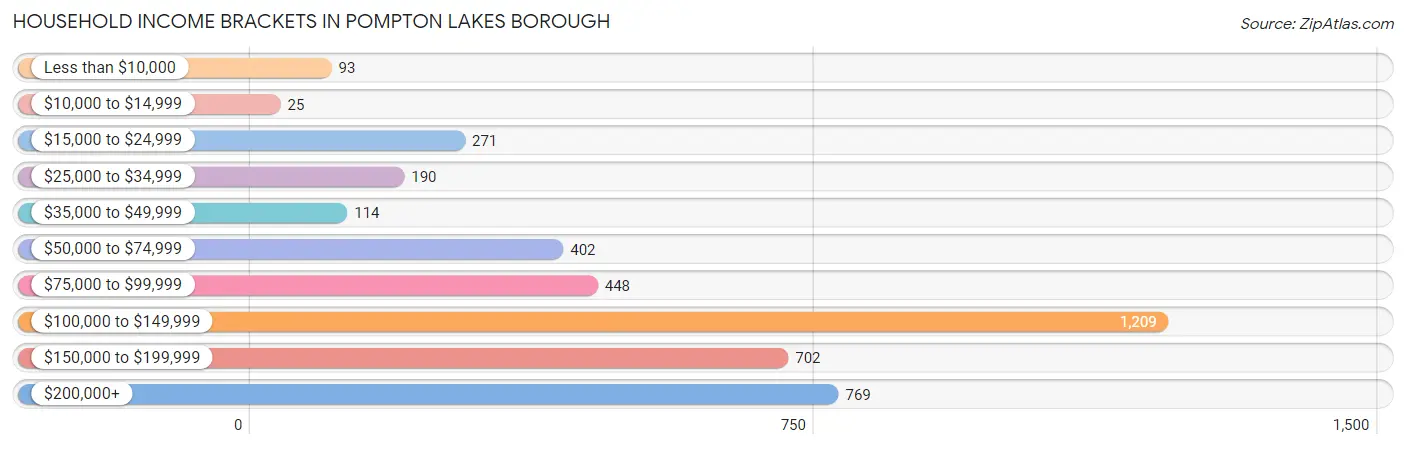
Household Income Brackets in Pompton Lakes borough
With 1,209 households falling in the category, the $100,000 to $149,999 income range is the most frequent in Pompton Lakes borough, accounting for 28.6% of all households. In contrast, only 25 households (0.6%) fall into the $10,000 to $14,999 income bracket, making it the least populous group.
| Income Bracket | # Households | % Households |
| Less than $10,000 | 93 | 2.2% |
| $10,000 to $14,999 | 25 | 0.6% |
| $15,000 to $24,999 | 271 | 6.4% |
| $25,000 to $34,999 | 190 | 4.5% |
| $35,000 to $49,999 | 114 | 2.7% |
| $50,000 to $74,999 | 402 | 9.5% |
| $75,000 to $99,999 | 448 | 10.6% |
| $100,000 to $149,999 | 1,209 | 28.6% |
| $150,000 to $199,999 | 702 | 16.6% |
| $200,000+ | 769 | 18.2% |
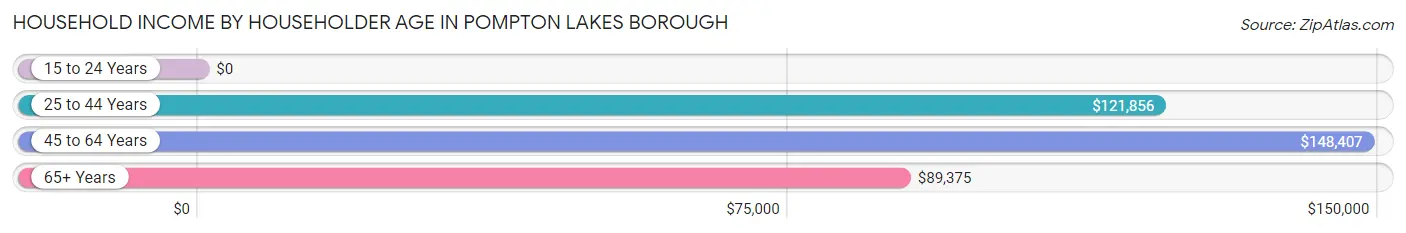
Household Income by Householder Age in Pompton Lakes borough
The median household income in Pompton Lakes borough is $113,781, with the highest median household income of $148,407 found in the 45 to 64 years age bracket for the primary householder. A total of 1,641 households (38.8%) fall into this category. Meanwhile, the 15 to 24 years age bracket for the primary householder has the lowest median household income of $0, with 21 households (0.5%) in this group.
| Income Bracket | # Households | Median Income |
| 15 to 24 Years | 21 (0.5%) | $0 |
| 25 to 44 Years | 1,361 (32.2%) | $121,856 |
| 45 to 64 Years | 1,641 (38.8%) | $148,407 |
| 65+ Years | 1,204 (28.5%) | $89,375 |
| Total | 4,227 (100.0%) | $113,781 |
Poverty in Pompton Lakes borough
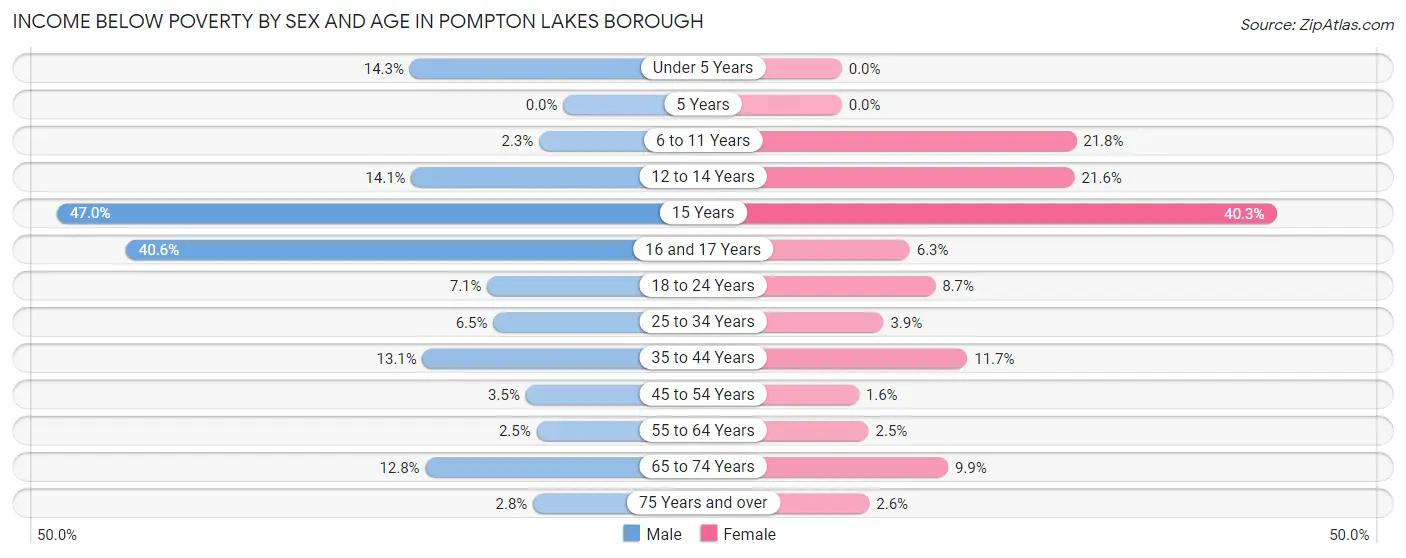
Income Below Poverty by Sex and Age in Pompton Lakes borough
With 9.3% poverty level for males and 8.2% for females among the residents of Pompton Lakes borough, 15 year old males and 15 year old females are the most vulnerable to poverty, with 39 males (47.0%) and 50 females (40.3%) in their respective age groups living below the poverty level.
| Age Bracket | Male | Female |
| Under 5 Years | 54 (14.2%) | 0 (0.0%) |
| 5 Years | 0 (0.0%) | 0 (0.0%) |
| 6 to 11 Years | 8 (2.2%) | 84 (21.8%) |
| 12 to 14 Years | 32 (14.1%) | 51 (21.6%) |
| 15 Years | 39 (47.0%) | 50 (40.3%) |
| 16 and 17 Years | 95 (40.6%) | 7 (6.3%) |
| 18 to 24 Years | 28 (7.0%) | 34 (8.7%) |
| 25 to 34 Years | 53 (6.5%) | 24 (3.9%) |
| 35 to 44 Years | 94 (13.1%) | 108 (11.7%) |
| 45 to 54 Years | 21 (3.5%) | 9 (1.6%) |
| 55 to 64 Years | 21 (2.5%) | 21 (2.5%) |
| 65 to 74 Years | 54 (12.8%) | 51 (9.9%) |
| 75 Years and over | 8 (2.8%) | 14 (2.6%) |
| Total | 507 (9.3%) | 453 (8.2%) |
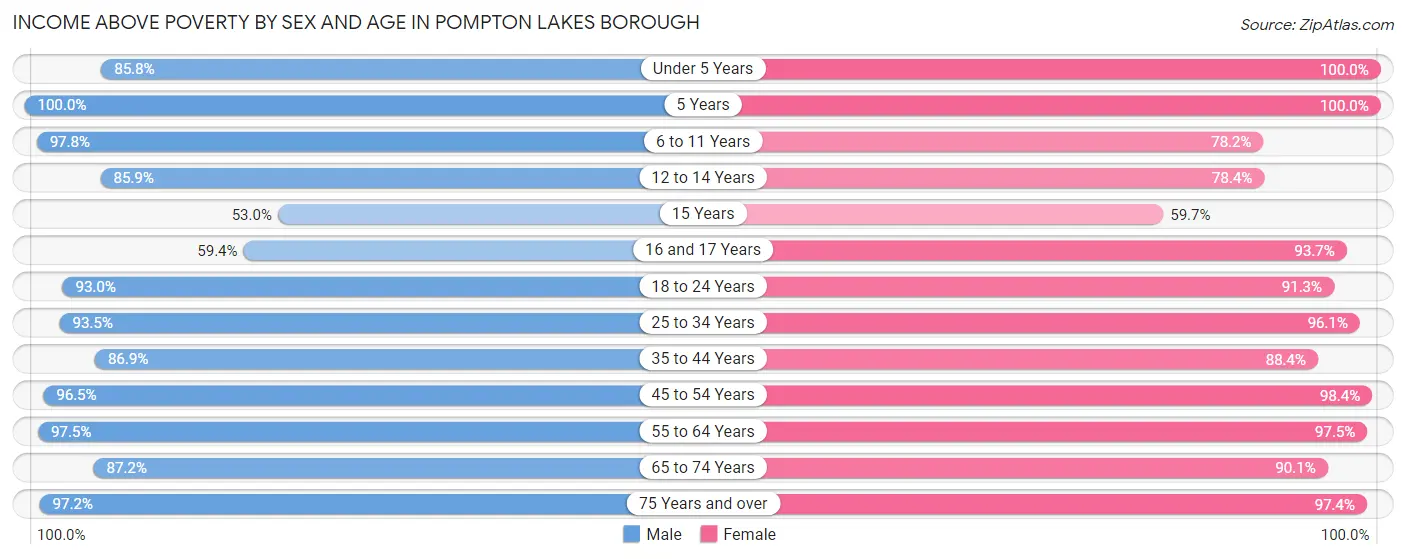
Income Above Poverty by Sex and Age in Pompton Lakes borough
According to the poverty statistics in Pompton Lakes borough, males aged 5 years and females aged under 5 years are the age groups that are most secure financially, with 100.0% of males and 100.0% of females in these age groups living above the poverty line.
| Age Bracket | Male | Female |
| Under 5 Years | 325 (85.8%) | 186 (100.0%) |
| 5 Years | 59 (100.0%) | 75 (100.0%) |
| 6 to 11 Years | 348 (97.8%) | 302 (78.2%) |
| 12 to 14 Years | 195 (85.9%) | 185 (78.4%) |
| 15 Years | 44 (53.0%) | 74 (59.7%) |
| 16 and 17 Years | 139 (59.4%) | 104 (93.7%) |
| 18 to 24 Years | 369 (92.9%) | 358 (91.3%) |
| 25 to 34 Years | 763 (93.5%) | 596 (96.1%) |
| 35 to 44 Years | 625 (86.9%) | 819 (88.3%) |
| 45 to 54 Years | 581 (96.5%) | 562 (98.4%) |
| 55 to 64 Years | 823 (97.5%) | 823 (97.5%) |
| 65 to 74 Years | 368 (87.2%) | 466 (90.1%) |
| 75 Years and over | 278 (97.2%) | 532 (97.4%) |
| Total | 4,917 (90.6%) | 5,082 (91.8%) |
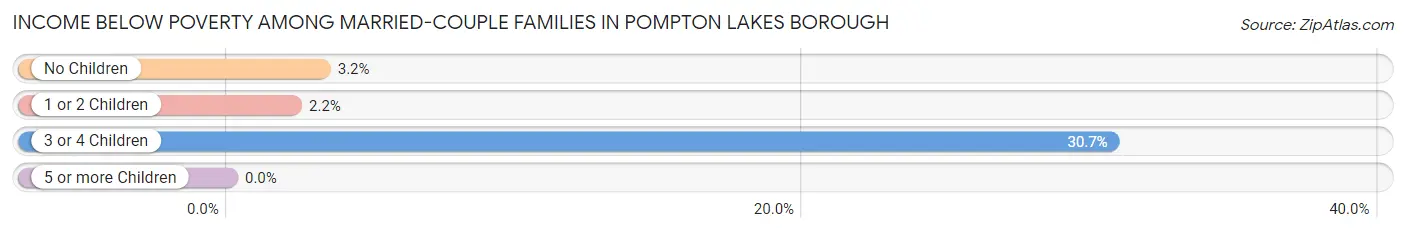
Income Below Poverty Among Married-Couple Families in Pompton Lakes borough
The poverty statistics for married-couple families in Pompton Lakes borough show that 4.0% or 94 of the total 2,342 families live below the poverty line. Families with 3 or 4 children have the highest poverty rate of 30.7%, comprising of 31 families. On the other hand, families with 1 or 2 children have the lowest poverty rate of 2.2%, which includes 21 families.
| Children | Above Poverty | Below Poverty |
| No Children | 1,259 (96.8%) | 42 (3.2%) |
| 1 or 2 Children | 919 (97.8%) | 21 (2.2%) |
| 3 or 4 Children | 70 (69.3%) | 31 (30.7%) |
| 5 or more Children | 0 (0.0%) | 0 (0.0%) |
| Total | 2,248 (96.0%) | 94 (4.0%) |
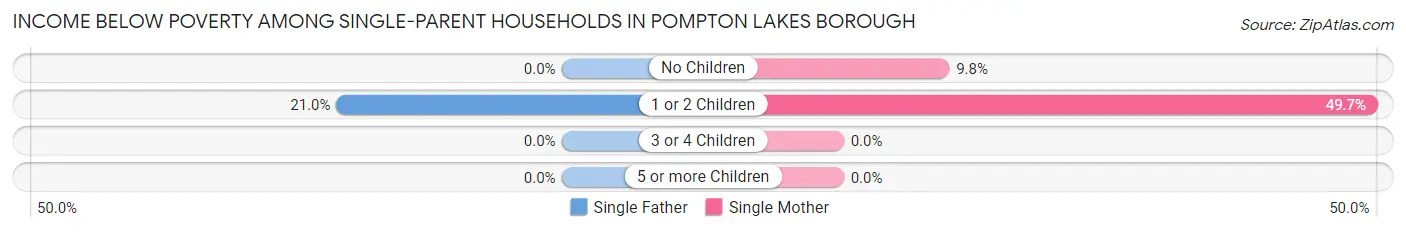
Income Below Poverty Among Single-Parent Households in Pompton Lakes borough
According to the poverty data in Pompton Lakes borough, 6.5% or 13 single-father households and 29.8% or 111 single-mother households are living below the poverty line. Among single-father households, those with 1 or 2 children have the highest poverty rate, with 13 households (21.0%) experiencing poverty. Likewise, among single-mother households, those with 1 or 2 children have the highest poverty rate, with 94 households (49.7%) falling below the poverty line.
| Children | Single Father | Single Mother |
| No Children | 0 (0.0%) | 17 (9.8%) |
| 1 or 2 Children | 13 (21.0%) | 94 (49.7%) |
| 3 or 4 Children | 0 (0.0%) | 0 (0.0%) |
| 5 or more Children | 0 (0.0%) | 0 (0.0%) |
| Total | 13 (6.5%) | 111 (29.8%) |
Income Below Poverty Among Married-Couple vs Single-Parent Households in Pompton Lakes borough
The poverty data for Pompton Lakes borough shows that 94 of the married-couple family households (4.0%) and 124 of the single-parent households (21.6%) are living below the poverty level. Within the married-couple family households, those with 3 or 4 children have the highest poverty rate, with 31 households (30.7%) falling below the poverty line. Among the single-parent households, those with 1 or 2 children have the highest poverty rate, with 107 household (42.6%) living below poverty.
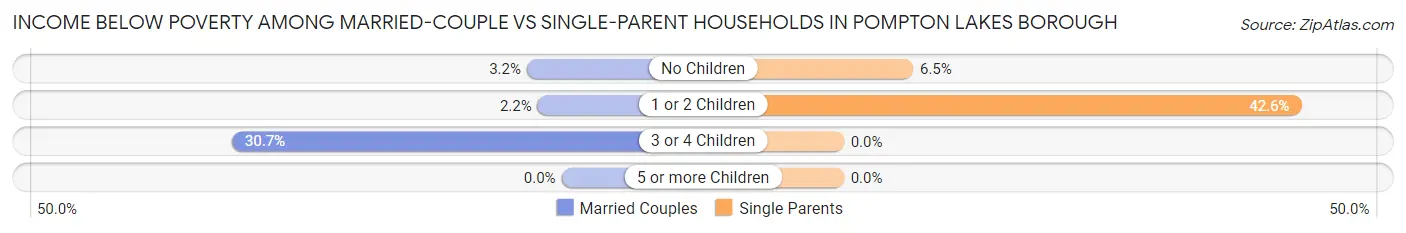
| Children | Married-Couple Families | Single-Parent Households |
| No Children | 42 (3.2%) | 17 (6.5%) |
| 1 or 2 Children | 21 (2.2%) | 107 (42.6%) |
| 3 or 4 Children | 31 (30.7%) | 0 (0.0%) |
| 5 or more Children | 0 (0.0%) | 0 (0.0%) |
| Total | 94 (4.0%) | 124 (21.6%) |
Race in Pompton Lakes borough
The most populous races in Pompton Lakes borough are White / Caucasian (9,234 | 83.6%), Hispanic or Latino (1,859 | 16.8%), and Two or more Races (879 | 8.0%).
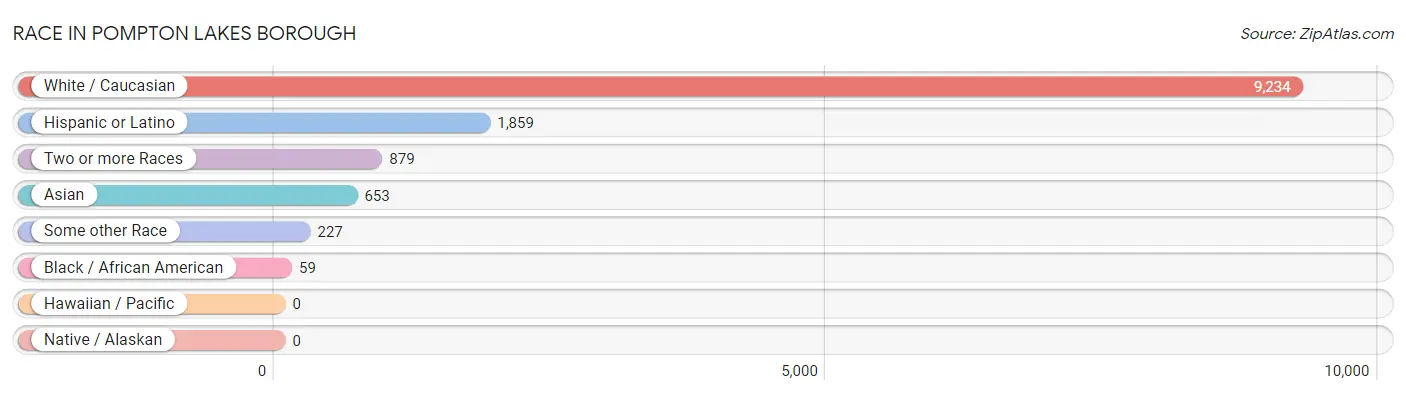
| Race | # Population | % Population |
| Asian | 653 | 5.9% |
| Black / African American | 59 | 0.5% |
| Hawaiian / Pacific | 0 | 0.0% |
| Hispanic or Latino | 1,859 | 16.8% |
| Native / Alaskan | 0 | 0.0% |
| White / Caucasian | 9,234 | 83.6% |
| Two or more Races | 879 | 8.0% |
| Some other Race | 227 | 2.1% |
| Total | 11,052 | 100.0% |
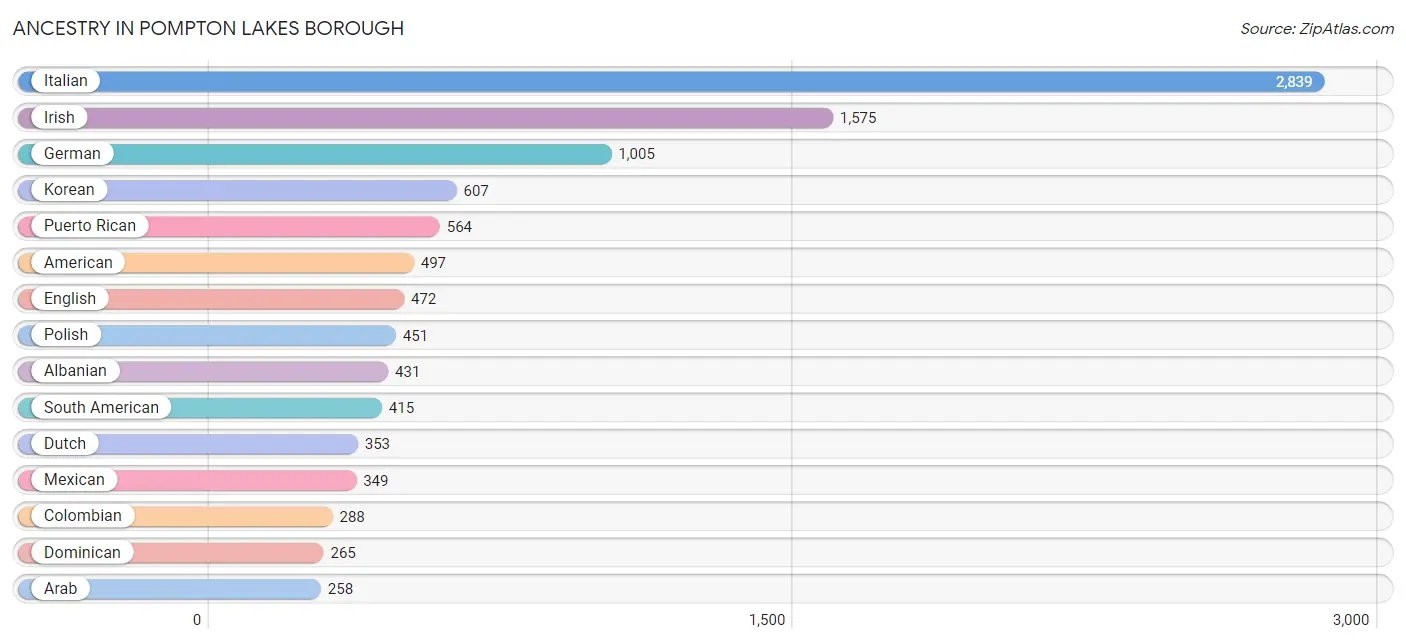
Ancestry in Pompton Lakes borough
The most populous ancestries reported in Pompton Lakes borough are Italian (2,839 | 25.7%), Irish (1,575 | 14.2%), German (1,005 | 9.1%), Korean (607 | 5.5%), and Puerto Rican (564 | 5.1%), together accounting for 59.6% of all Pompton Lakes borough residents.
| Ancestry | # Population | % Population |
| Albanian | 431 | 3.9% |
| American | 497 | 4.5% |
| Arab | 258 | 2.3% |
| Argentinean | 9 | 0.1% |
| Armenian | 73 | 0.7% |
| Austrian | 32 | 0.3% |
| Brazilian | 21 | 0.2% |
| British | 61 | 0.5% |
| Bulgarian | 52 | 0.5% |
| Burmese | 23 | 0.2% |
| Celtic | 10 | 0.1% |
| Central American | 48 | 0.4% |
| Cherokee | 37 | 0.3% |
| Chilean | 40 | 0.4% |
| Colombian | 288 | 2.6% |
| Cuban | 55 | 0.5% |
| Czech | 7 | 0.1% |
| Czechoslovakian | 7 | 0.1% |
| Danish | 24 | 0.2% |
| Dominican | 265 | 2.4% |
| Dutch | 353 | 3.2% |
| Eastern European | 40 | 0.4% |
| Ecuadorian | 31 | 0.3% |
| Egyptian | 64 | 0.6% |
| English | 472 | 4.3% |
| European | 54 | 0.5% |
| Finnish | 18 | 0.2% |
| French | 171 | 1.5% |
| French Canadian | 106 | 1.0% |
| German | 1,005 | 9.1% |
| Greek | 142 | 1.3% |
| Guyanese | 16 | 0.1% |
| Haitian | 47 | 0.4% |
| Honduran | 30 | 0.3% |
| Hungarian | 195 | 1.8% |
| Indian (Asian) | 36 | 0.3% |
| Irish | 1,575 | 14.2% |
| Italian | 2,839 | 25.7% |
| Jamaican | 22 | 0.2% |
| Korean | 607 | 5.5% |
| Laotian | 52 | 0.5% |
| Lithuanian | 29 | 0.3% |
| Macedonian | 15 | 0.1% |
| Mexican | 349 | 3.2% |
| Nigerian | 21 | 0.2% |
| Northern European | 10 | 0.1% |
| Norwegian | 40 | 0.4% |
| Palestinian | 182 | 1.7% |
| Pennsylvania German | 11 | 0.1% |
| Peruvian | 43 | 0.4% |
| Polish | 451 | 4.1% |
| Portuguese | 43 | 0.4% |
| Puerto Rican | 564 | 5.1% |
| Romanian | 43 | 0.4% |
| Russian | 76 | 0.7% |
| Salvadoran | 18 | 0.2% |
| Scotch-Irish | 14 | 0.1% |
| Scottish | 154 | 1.4% |
| Sioux | 37 | 0.3% |
| Slovak | 17 | 0.2% |
| South African | 21 | 0.2% |
| South American | 415 | 3.7% |
| Spaniard | 8 | 0.1% |
| Spanish | 81 | 0.7% |
| Subsaharan African | 21 | 0.2% |
| Swedish | 61 | 0.5% |
| Swiss | 26 | 0.2% |
| Syrian | 12 | 0.1% |
| Thai | 48 | 0.4% |
| Turkish | 52 | 0.5% |
| Ukrainian | 35 | 0.3% |
| Venezuelan | 4 | 0.0% |
| Welsh | 11 | 0.1% | View All 73 Rows |
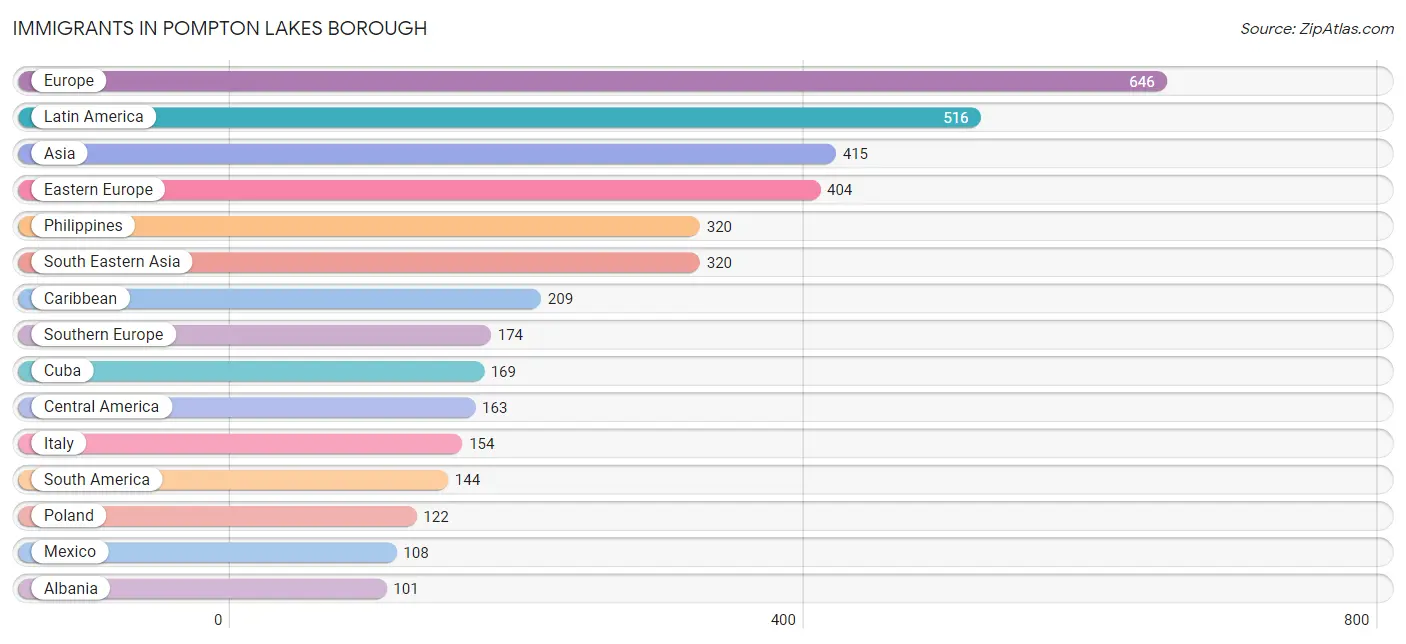
Immigrants in Pompton Lakes borough
The most numerous immigrant groups reported in Pompton Lakes borough came from Europe (646 | 5.9%), Latin America (516 | 4.7%), Asia (415 | 3.7%), Eastern Europe (404 | 3.7%), and Philippines (320 | 2.9%), together accounting for 20.8% of all Pompton Lakes borough residents.
| Immigration Origin | # Population | % Population |
| Africa | 42 | 0.4% |
| Albania | 101 | 0.9% |
| Asia | 415 | 3.7% |
| Bulgaria | 52 | 0.5% |
| Caribbean | 209 | 1.9% |
| Central America | 163 | 1.5% |
| Colombia | 67 | 0.6% |
| Cuba | 169 | 1.5% |
| Dominican Republic | 35 | 0.3% |
| Eastern Asia | 23 | 0.2% |
| Eastern Europe | 404 | 3.7% |
| Ecuador | 12 | 0.1% |
| Egypt | 42 | 0.4% |
| England | 19 | 0.2% |
| Europe | 646 | 5.9% |
| France | 13 | 0.1% |
| Germany | 25 | 0.2% |
| Greece | 10 | 0.1% |
| Guatemala | 40 | 0.4% |
| Guyana | 16 | 0.1% |
| Haiti | 5 | 0.1% |
| Honduras | 15 | 0.1% |
| Hungary | 8 | 0.1% |
| India | 22 | 0.2% |
| Ireland | 11 | 0.1% |
| Italy | 154 | 1.4% |
| Korea | 23 | 0.2% |
| Latin America | 516 | 4.7% |
| Mexico | 108 | 1.0% |
| North Macedonia | 31 | 0.3% |
| Northern Africa | 42 | 0.4% |
| Northern Europe | 30 | 0.3% |
| Peru | 47 | 0.4% |
| Philippines | 320 | 2.9% |
| Poland | 122 | 1.1% |
| Portugal | 10 | 0.1% |
| Russia | 10 | 0.1% |
| South America | 144 | 1.3% |
| South Central Asia | 22 | 0.2% |
| South Eastern Asia | 320 | 2.9% |
| Southern Europe | 174 | 1.6% |
| Syria | 37 | 0.3% |
| Turkey | 13 | 0.1% |
| Ukraine | 55 | 0.5% |
| Venezuela | 2 | 0.0% |
| Western Asia | 50 | 0.4% |
| Western Europe | 38 | 0.3% | View All 47 Rows |
Sex and Age in Pompton Lakes borough
Sex and Age in Pompton Lakes borough
The most populous age groups in Pompton Lakes borough are 55 to 59 Years (548 | 10.0%) for men and 40 to 44 Years (500 | 9.0%) for women.
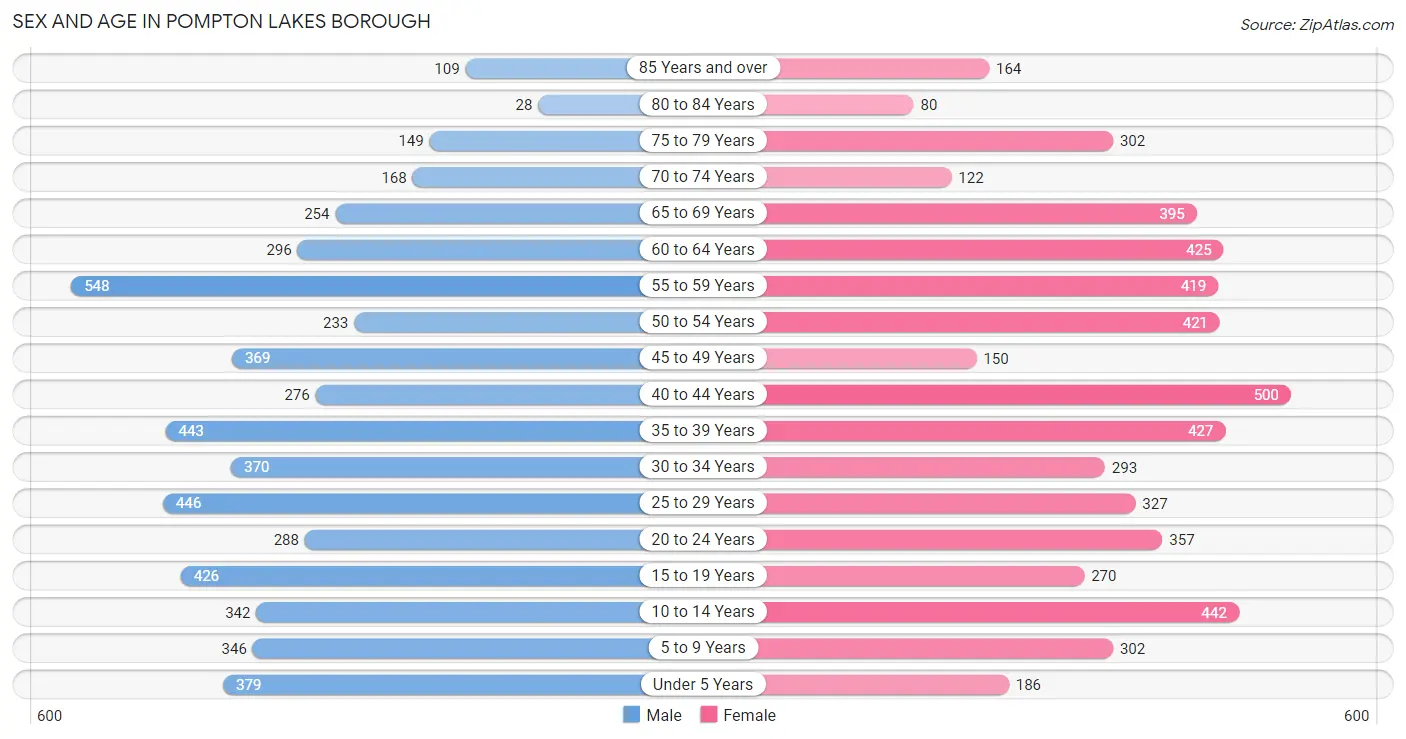
| Age Bracket | Male | Female |
| Under 5 Years | 379 (6.9%) | 186 (3.3%) |
| 5 to 9 Years | 346 (6.3%) | 302 (5.4%) |
| 10 to 14 Years | 342 (6.2%) | 442 (7.9%) |
| 15 to 19 Years | 426 (7.8%) | 270 (4.8%) |
| 20 to 24 Years | 288 (5.3%) | 357 (6.4%) |
| 25 to 29 Years | 446 (8.2%) | 327 (5.9%) |
| 30 to 34 Years | 370 (6.8%) | 293 (5.2%) |
| 35 to 39 Years | 443 (8.1%) | 427 (7.6%) |
| 40 to 44 Years | 276 (5.1%) | 500 (9.0%) |
| 45 to 49 Years | 369 (6.8%) | 150 (2.7%) |
| 50 to 54 Years | 233 (4.3%) | 421 (7.5%) |
| 55 to 59 Years | 548 (10.0%) | 419 (7.5%) |
| 60 to 64 Years | 296 (5.4%) | 425 (7.6%) |
| 65 to 69 Years | 254 (4.6%) | 395 (7.1%) |
| 70 to 74 Years | 168 (3.1%) | 122 (2.2%) |
| 75 to 79 Years | 149 (2.7%) | 302 (5.4%) |
| 80 to 84 Years | 28 (0.5%) | 80 (1.4%) |
| 85 Years and over | 109 (2.0%) | 164 (2.9%) |
| Total | 5,470 (100.0%) | 5,582 (100.0%) |
Families and Households in Pompton Lakes borough
Median Family Size in Pompton Lakes borough
The median family size in Pompton Lakes borough is 3.15 persons per family, with married-couple families (2,342 | 80.3%) accounting for the largest median family size of 3.22 persons per family. On the other hand, single male/father families (201 | 6.9%) represent the smallest median family size with 2.53 persons per family.
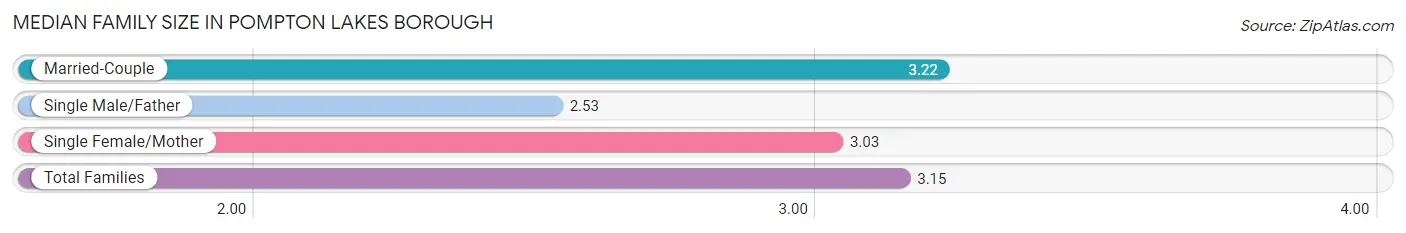
| Family Type | # Families | Family Size |
| Married-Couple | 2,342 (80.3%) | 3.22 |
| Single Male/Father | 201 (6.9%) | 2.53 |
| Single Female/Mother | 372 (12.8%) | 3.03 |
| Total Families | 2,915 (100.0%) | 3.15 |
Median Household Size in Pompton Lakes borough
The median household size in Pompton Lakes borough is 2.61 persons per household, with single male/father households (201 | 4.8%) accounting for the largest median household size of 3.45 persons per household. non-family households (1,312 | 31.0%) represent the smallest median household size with 1.25 persons per household.
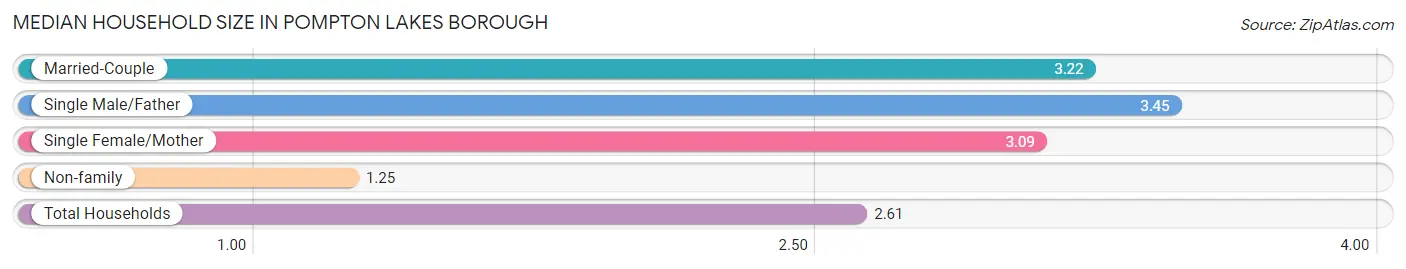
| Household Type | # Households | Household Size |
| Married-Couple | 2,342 (55.4%) | 3.22 |
| Single Male/Father | 201 (4.8%) | 3.45 |
| Single Female/Mother | 372 (8.8%) | 3.09 |
| Non-family | 1,312 (31.0%) | 1.25 |
| Total Households | 4,227 (100.0%) | 2.61 |
Household Size by Marriage Status in Pompton Lakes borough
Out of a total of 4,227 households in Pompton Lakes borough, 2,915 (69.0%) are family households, while 1,312 (31.0%) are nonfamily households. The most numerous type of family households are 2-person households, comprising 1,024, and the most common type of nonfamily households are 1-person households, comprising 1,105.
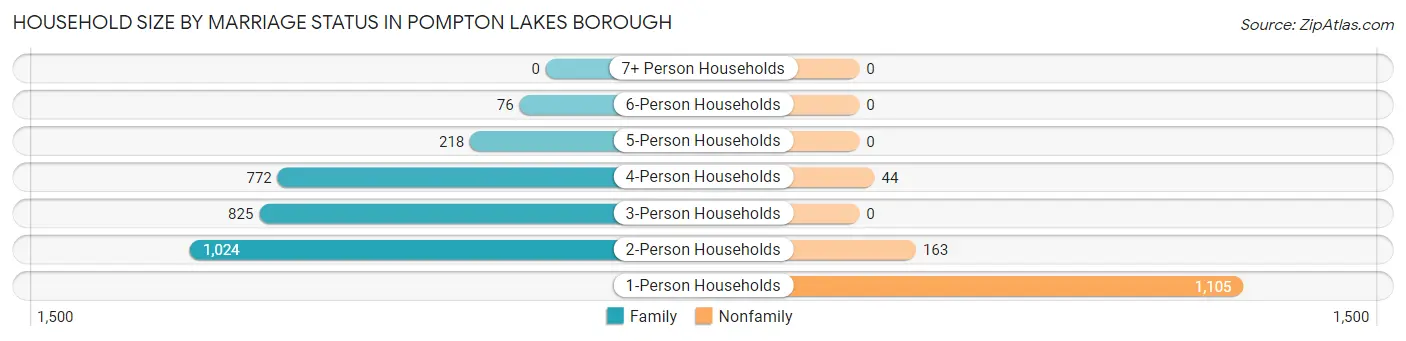
| Household Size | Family Households | Nonfamily Households |
| 1-Person Households | - | 1,105 (26.1%) |
| 2-Person Households | 1,024 (24.2%) | 163 (3.9%) |
| 3-Person Households | 825 (19.5%) | 0 (0.0%) |
| 4-Person Households | 772 (18.3%) | 44 (1.0%) |
| 5-Person Households | 218 (5.2%) | 0 (0.0%) |
| 6-Person Households | 76 (1.8%) | 0 (0.0%) |
| 7+ Person Households | 0 (0.0%) | 0 (0.0%) |
| Total | 2,915 (69.0%) | 1,312 (31.0%) |
Female Fertility in Pompton Lakes borough
Fertility by Age in Pompton Lakes borough
Average fertility rate in Pompton Lakes borough is 18.0 births per 1,000 women. Women in the age bracket of 20 to 34 years have the highest fertility rate with 26.0 births per 1,000 women. Women in the age bracket of 20 to 34 years acount for 58.1% of all women with births.
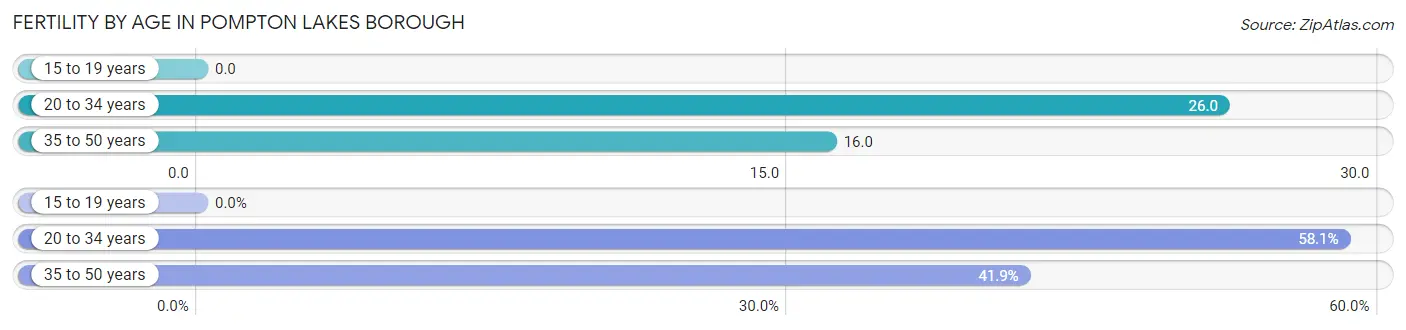
| Age Bracket | Women with Births | Births / 1,000 Women |
| 15 to 19 years | 0 (0.0%) | 0.0 |
| 20 to 34 years | 25 (58.1%) | 26.0 |
| 35 to 50 years | 18 (41.9%) | 16.0 |
| Total | 43 (100.0%) | 18.0 |
Fertility by Age by Marriage Status in Pompton Lakes borough
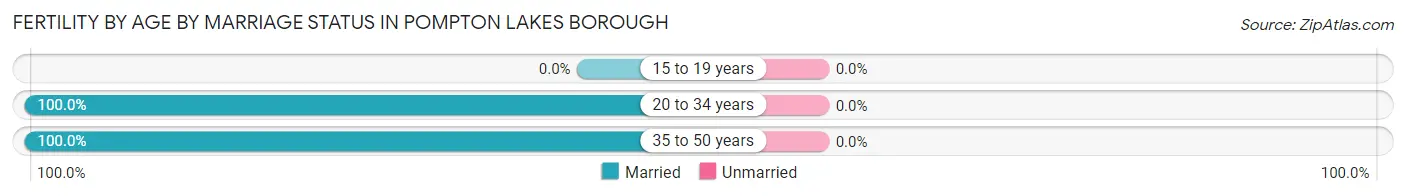
| Age Bracket | Married | Unmarried |
| 15 to 19 years | 0 (0.0%) | 0 (0.0%) |
| 20 to 34 years | 25 (100.0%) | 0 (0.0%) |
| 35 to 50 years | 18 (100.0%) | 0 (0.0%) |
| Total | 43 (100.0%) | 0 (0.0%) |
Fertility by Education in Pompton Lakes borough
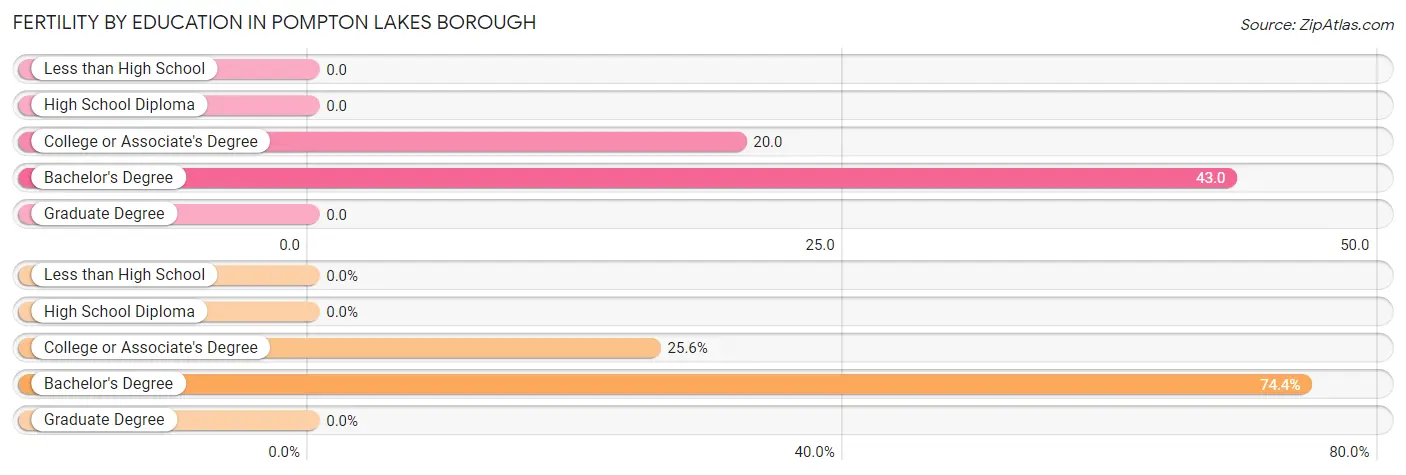
| Educational Attainment | Women with Births | Births / 1,000 Women |
| Less than High School | 0 (0.0%) | 0.0 |
| High School Diploma | 0 (0.0%) | 0.0 |
| College or Associate's Degree | 11 (25.6%) | 20.0 |
| Bachelor's Degree | 32 (74.4%) | 43.0 |
| Graduate Degree | 0 (0.0%) | 0.0 |
| Total | 43 (100.0%) | 18.0 |
Fertility by Education by Marriage Status in Pompton Lakes borough
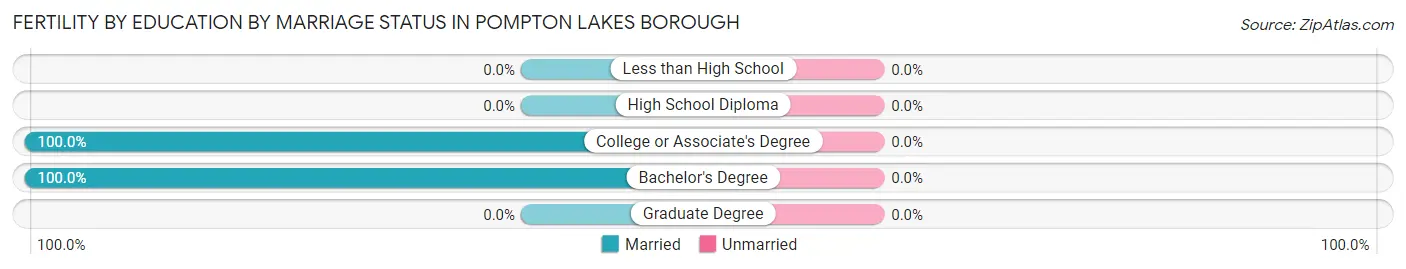
| Educational Attainment | Married | Unmarried |
| Less than High School | 0 (0.0%) | 0 (0.0%) |
| High School Diploma | 0 (0.0%) | 0 (0.0%) |
| College or Associate's Degree | 11 (100.0%) | 0 (0.0%) |
| Bachelor's Degree | 32 (100.0%) | 0 (0.0%) |
| Graduate Degree | 0 (0.0%) | 0 (0.0%) |
| Total | 43 (100.0%) | 0 (0.0%) |
Employment Characteristics in Pompton Lakes borough
Employment by Class of Employer in Pompton Lakes borough
Among the 6,041 employed individuals in Pompton Lakes borough, private company employees (4,028 | 66.7%), local government employees (679 | 11.2%), and not-for-profit organizations (488 | 8.1%) make up the most common classes of employment.
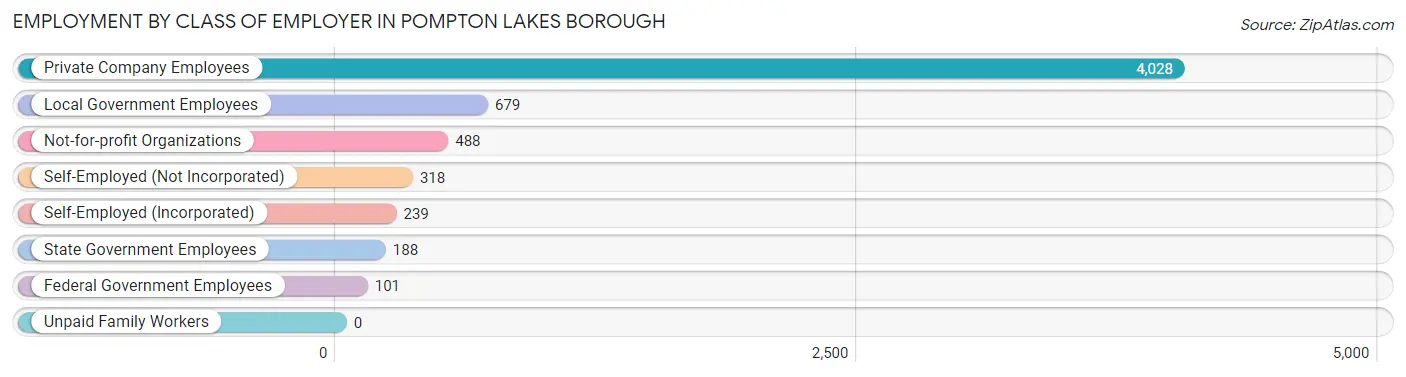
| Employer Class | # Employees | % Employees |
| Private Company Employees | 4,028 | 66.7% |
| Self-Employed (Incorporated) | 239 | 4.0% |
| Self-Employed (Not Incorporated) | 318 | 5.3% |
| Not-for-profit Organizations | 488 | 8.1% |
| Local Government Employees | 679 | 11.2% |
| State Government Employees | 188 | 3.1% |
| Federal Government Employees | 101 | 1.7% |
| Unpaid Family Workers | 0 | 0.0% |
| Total | 6,041 | 100.0% |
Employment Status by Age in Pompton Lakes borough
According to the labor force statistics for Pompton Lakes borough, out of the total population over 16 years of age (8,848), 73.8% or 6,530 individuals are in the labor force, with 3.8% or 248 of them unemployed. The age group with the highest labor force participation rate is 30 to 34 years, with 91.3% or 605 individuals in the labor force. Within the labor force, the 16 to 19 years age range has the highest percentage of unemployed individuals, with 39.4% or 87 of them being unemployed.
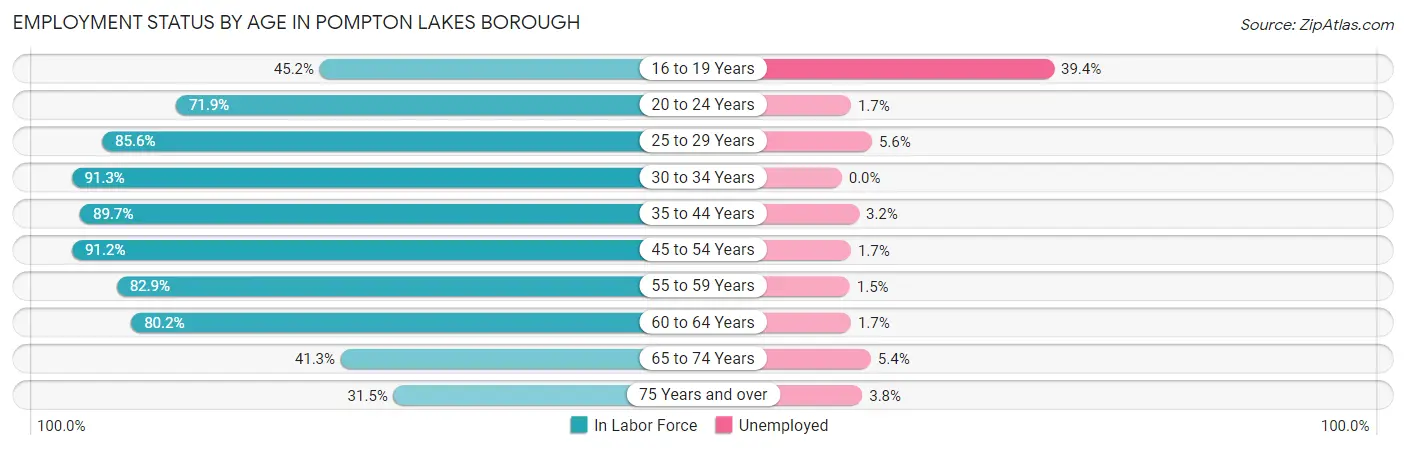
| Age Bracket | In Labor Force | Unemployed |
| 16 to 19 Years | 221 (45.2%) | 87 (39.4%) |
| 20 to 24 Years | 464 (71.9%) | 8 (1.7%) |
| 25 to 29 Years | 662 (85.6%) | 37 (5.6%) |
| 30 to 34 Years | 605 (91.3%) | 0 (0.0%) |
| 35 to 44 Years | 1,476 (89.7%) | 47 (3.2%) |
| 45 to 54 Years | 1,070 (91.2%) | 18 (1.7%) |
| 55 to 59 Years | 802 (82.9%) | 12 (1.5%) |
| 60 to 64 Years | 578 (80.2%) | 10 (1.7%) |
| 65 to 74 Years | 388 (41.3%) | 21 (5.4%) |
| 75 Years and over | 262 (31.5%) | 10 (3.8%) |
| Total | 6,530 (73.8%) | 248 (3.8%) |
Employment Status by Educational Attainment in Pompton Lakes borough
According to labor force statistics for Pompton Lakes borough, 87.4% of individuals (5,194) out of the total population between 25 and 64 years of age (5,943) are in the labor force, with 2.4% or 125 of them being unemployed. The group with the highest labor force participation rate are those with the educational attainment of bachelor's degree or higher, with 93.5% or 2,459 individuals in the labor force. Within the labor force, individuals with high school diploma education have the highest percentage of unemployment, with 3.9% or 53 of them being unemployed.
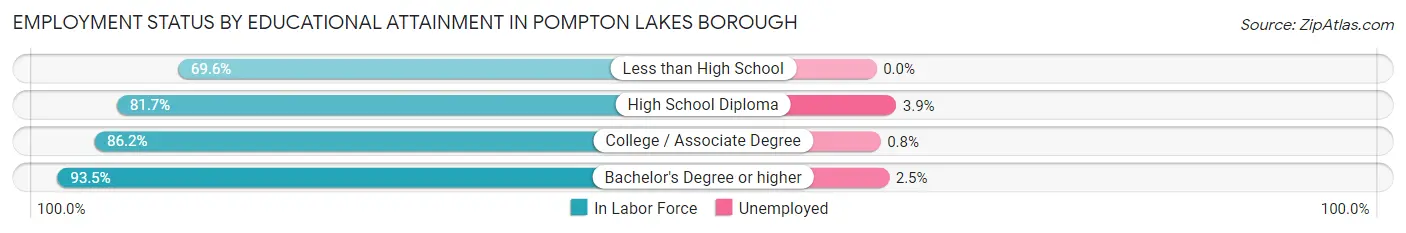
| Educational Attainment | In Labor Force | Unemployed |
| Less than High School | 190 (69.6%) | 0 (0.0%) |
| High School Diploma | 1,347 (81.7%) | 64 (3.9%) |
| College / Associate Degree | 1,199 (86.2%) | 11 (0.8%) |
| Bachelor's Degree or higher | 2,459 (93.5%) | 66 (2.5%) |
| Total | 5,194 (87.4%) | 143 (2.4%) |
Employment Occupations by Sex in Pompton Lakes borough
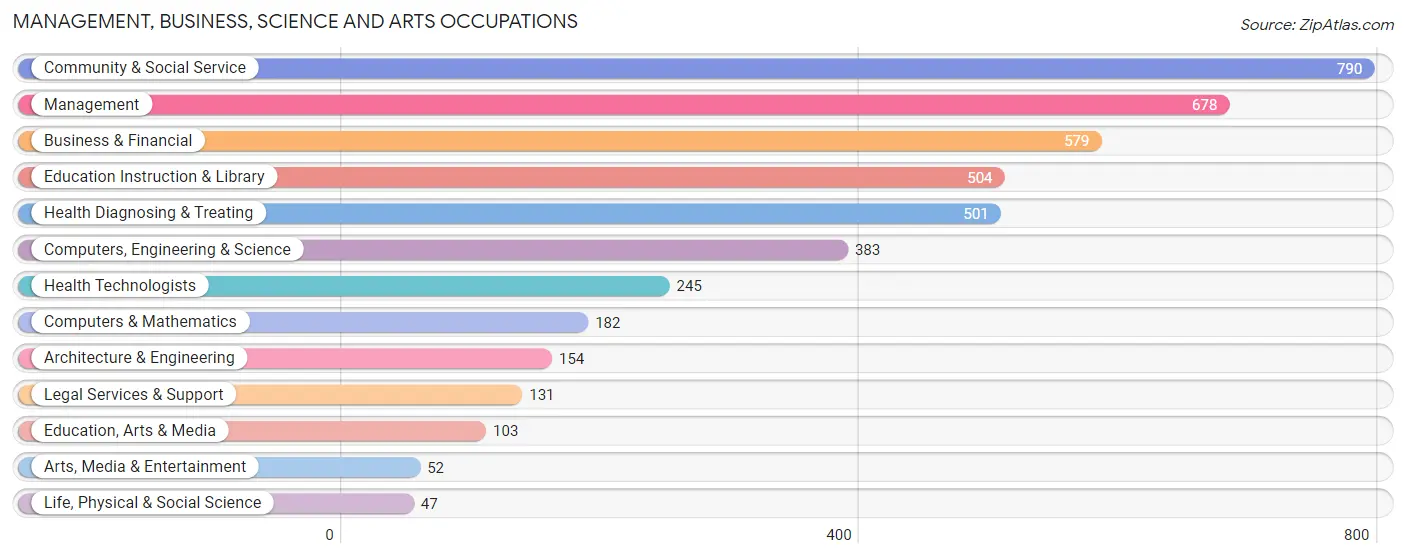
Management, Business, Science and Arts Occupations
The most common Management, Business, Science and Arts occupations in Pompton Lakes borough are Community & Social Service (790 | 12.6%), Management (678 | 10.8%), Business & Financial (579 | 9.2%), Education Instruction & Library (504 | 8.0%), and Health Diagnosing & Treating (501 | 8.0%).
Management, Business, Science and Arts Occupations by Sex
Within the Management, Business, Science and Arts occupations in Pompton Lakes borough, the most male-oriented occupations are Architecture & Engineering (100.0%), Computers, Engineering & Science (88.8%), and Computers & Mathematics (86.3%), while the most female-oriented occupations are Health Diagnosing & Treating (96.6%), Health Technologists (93.1%), and Education, Arts & Media (90.3%).
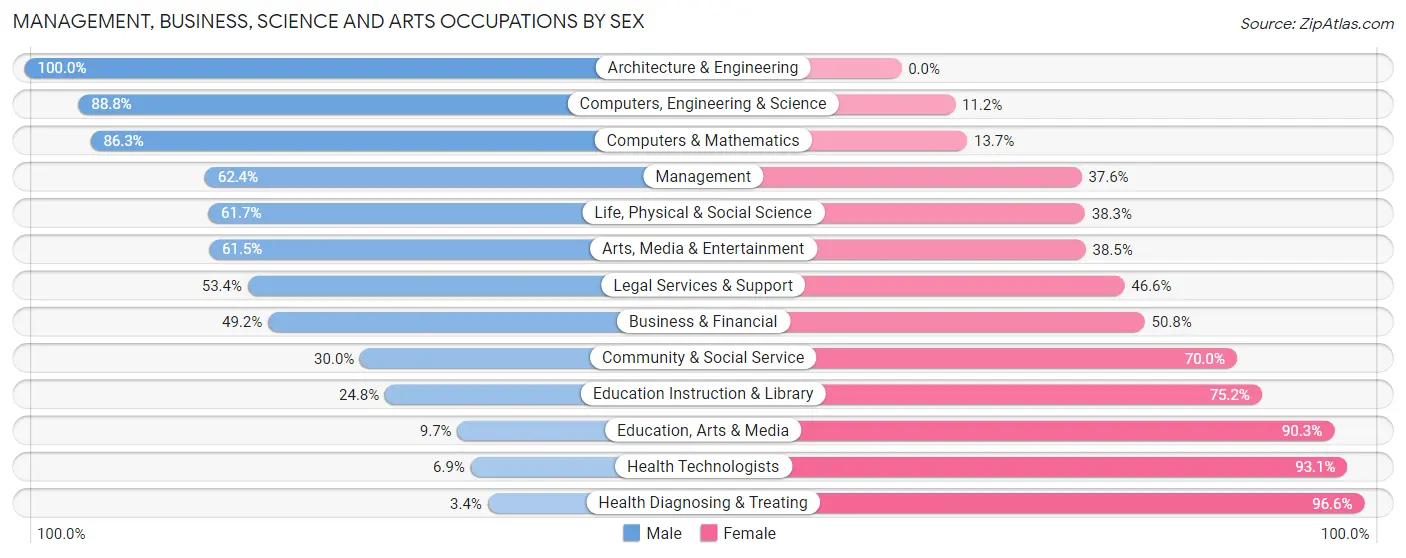
| Occupation | Male | Female |
| Management | 423 (62.4%) | 255 (37.6%) |
| Business & Financial | 285 (49.2%) | 294 (50.8%) |
| Computers, Engineering & Science | 340 (88.8%) | 43 (11.2%) |
| Computers & Mathematics | 157 (86.3%) | 25 (13.7%) |
| Architecture & Engineering | 154 (100.0%) | 0 (0.0%) |
| Life, Physical & Social Science | 29 (61.7%) | 18 (38.3%) |
| Community & Social Service | 237 (30.0%) | 553 (70.0%) |
| Education, Arts & Media | 10 (9.7%) | 93 (90.3%) |
| Legal Services & Support | 70 (53.4%) | 61 (46.6%) |
| Education Instruction & Library | 125 (24.8%) | 379 (75.2%) |
| Arts, Media & Entertainment | 32 (61.5%) | 20 (38.5%) |
| Health Diagnosing & Treating | 17 (3.4%) | 484 (96.6%) |
| Health Technologists | 17 (6.9%) | 228 (93.1%) |
| Total (Category) | 1,302 (44.4%) | 1,629 (55.6%) |
| Total (Overall) | 3,198 (50.9%) | 3,080 (49.1%) |
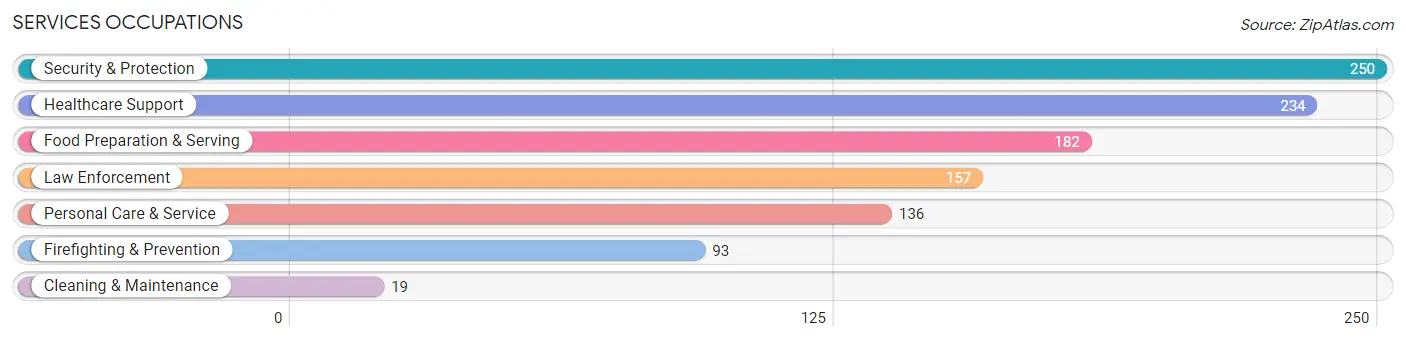
Services Occupations
The most common Services occupations in Pompton Lakes borough are Security & Protection (250 | 4.0%), Healthcare Support (234 | 3.7%), Food Preparation & Serving (182 | 2.9%), Law Enforcement (157 | 2.5%), and Personal Care & Service (136 | 2.2%).
Services Occupations by Sex
Within the Services occupations in Pompton Lakes borough, the most male-oriented occupations are Cleaning & Maintenance (100.0%), Law Enforcement (68.8%), and Security & Protection (59.6%), while the most female-oriented occupations are Personal Care & Service (100.0%), Healthcare Support (58.6%), and Firefighting & Prevention (55.9%).
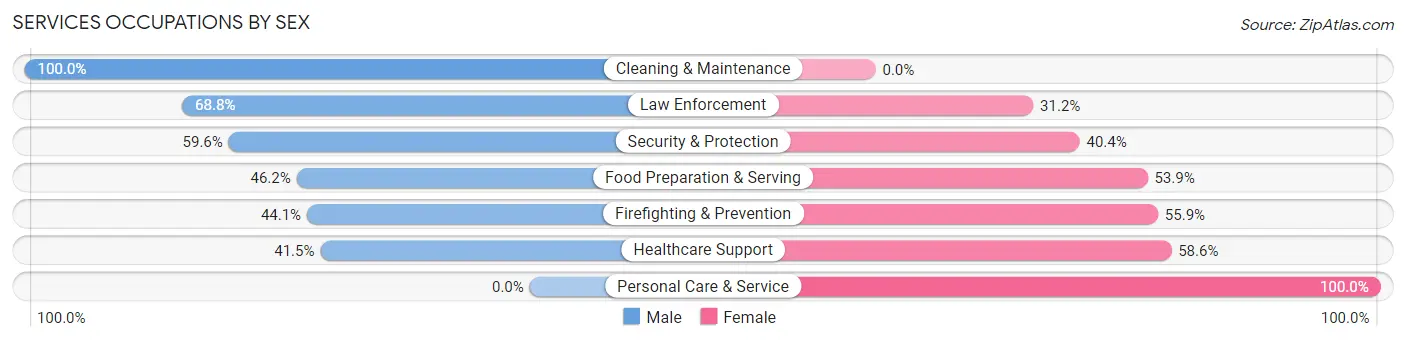
| Occupation | Male | Female |
| Healthcare Support | 97 (41.4%) | 137 (58.6%) |
| Security & Protection | 149 (59.6%) | 101 (40.4%) |
| Firefighting & Prevention | 41 (44.1%) | 52 (55.9%) |
| Law Enforcement | 108 (68.8%) | 49 (31.2%) |
| Food Preparation & Serving | 84 (46.2%) | 98 (53.8%) |
| Cleaning & Maintenance | 19 (100.0%) | 0 (0.0%) |
| Personal Care & Service | 0 (0.0%) | 136 (100.0%) |
| Total (Category) | 349 (42.5%) | 472 (57.5%) |
| Total (Overall) | 3,198 (50.9%) | 3,080 (49.1%) |
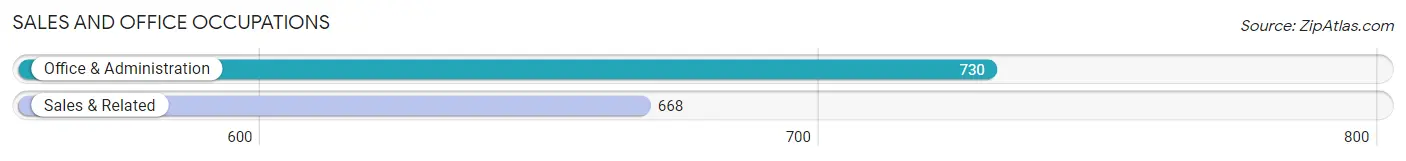
Sales and Office Occupations
The most common Sales and Office occupations in Pompton Lakes borough are Office & Administration (730 | 11.6%), and Sales & Related (668 | 10.6%).
Sales and Office Occupations by Sex
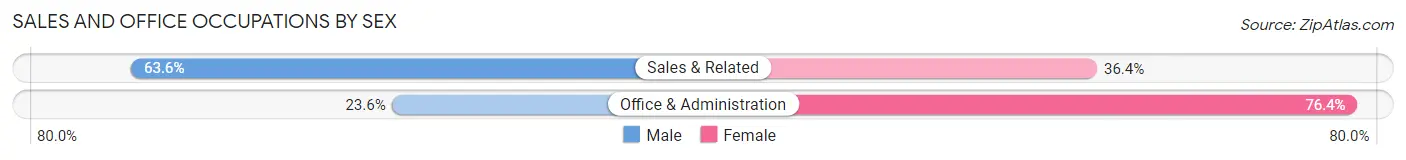
| Occupation | Male | Female |
| Sales & Related | 425 (63.6%) | 243 (36.4%) |
| Office & Administration | 172 (23.6%) | 558 (76.4%) |
| Total (Category) | 597 (42.7%) | 801 (57.3%) |
| Total (Overall) | 3,198 (50.9%) | 3,080 (49.1%) |
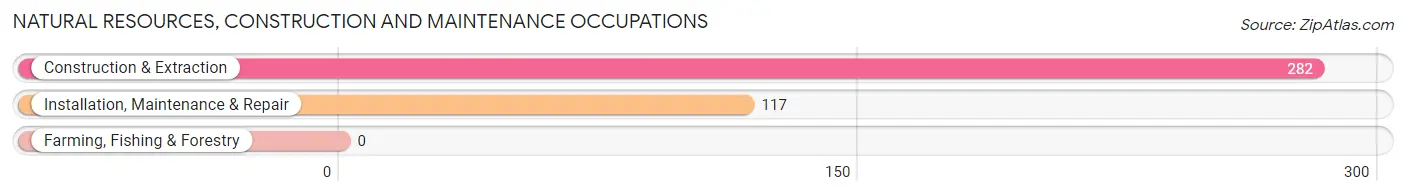
Natural Resources, Construction and Maintenance Occupations
The most common Natural Resources, Construction and Maintenance occupations in Pompton Lakes borough are Construction & Extraction (282 | 4.5%), and Installation, Maintenance & Repair (117 | 1.9%).
Natural Resources, Construction and Maintenance Occupations by Sex
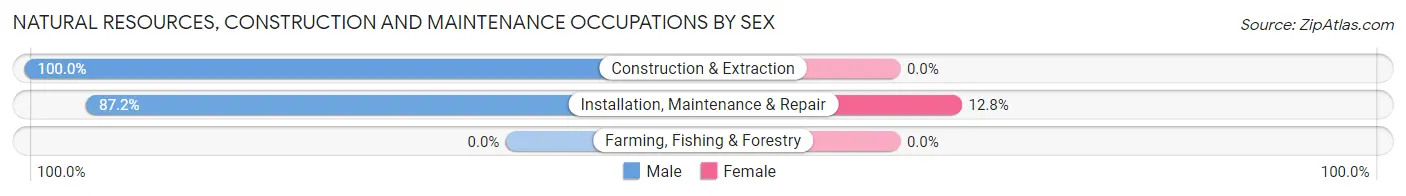
| Occupation | Male | Female |
| Farming, Fishing & Forestry | 0 (0.0%) | 0 (0.0%) |
| Construction & Extraction | 282 (100.0%) | 0 (0.0%) |
| Installation, Maintenance & Repair | 102 (87.2%) | 15 (12.8%) |
| Total (Category) | 384 (96.2%) | 15 (3.8%) |
| Total (Overall) | 3,198 (50.9%) | 3,080 (49.1%) |
Production, Transportation and Moving Occupations
The most common Production, Transportation and Moving occupations in Pompton Lakes borough are Material Moving (278 | 4.4%), Transportation (274 | 4.4%), and Production (177 | 2.8%).
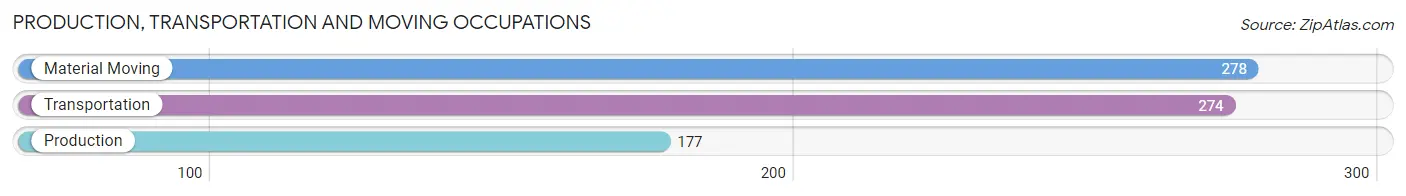
Production, Transportation and Moving Occupations by Sex
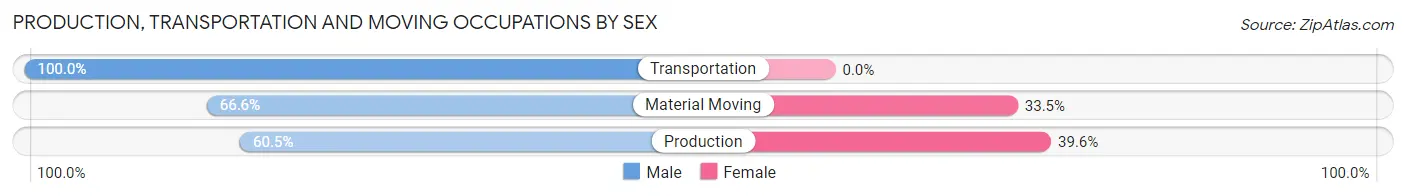
| Occupation | Male | Female |
| Production | 107 (60.5%) | 70 (39.6%) |
| Transportation | 274 (100.0%) | 0 (0.0%) |
| Material Moving | 185 (66.5%) | 93 (33.5%) |
| Total (Category) | 566 (77.6%) | 163 (22.4%) |
| Total (Overall) | 3,198 (50.9%) | 3,080 (49.1%) |
Employment Industries by Sex in Pompton Lakes borough
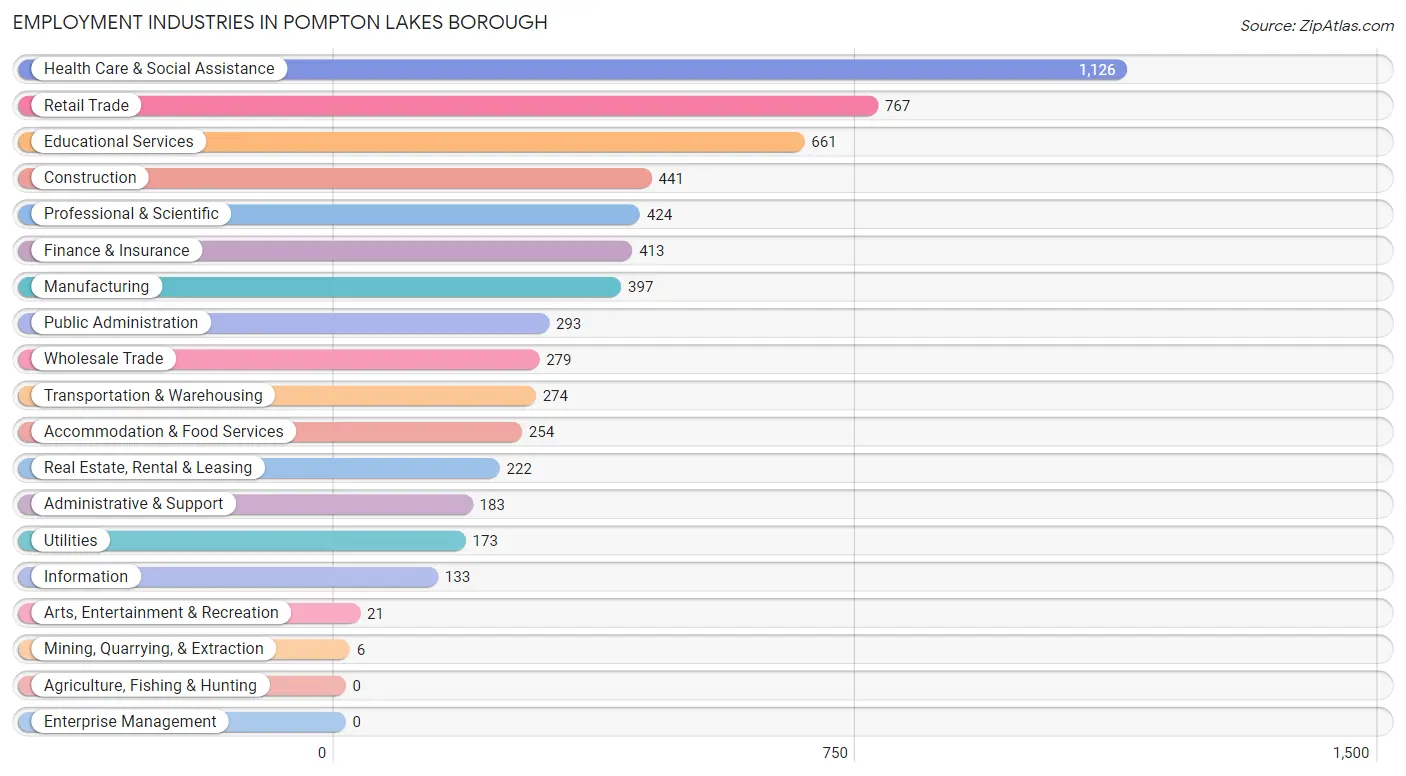
Employment Industries in Pompton Lakes borough
The major employment industries in Pompton Lakes borough include Health Care & Social Assistance (1,126 | 17.9%), Retail Trade (767 | 12.2%), Educational Services (661 | 10.5%), Construction (441 | 7.0%), and Professional & Scientific (424 | 6.8%).
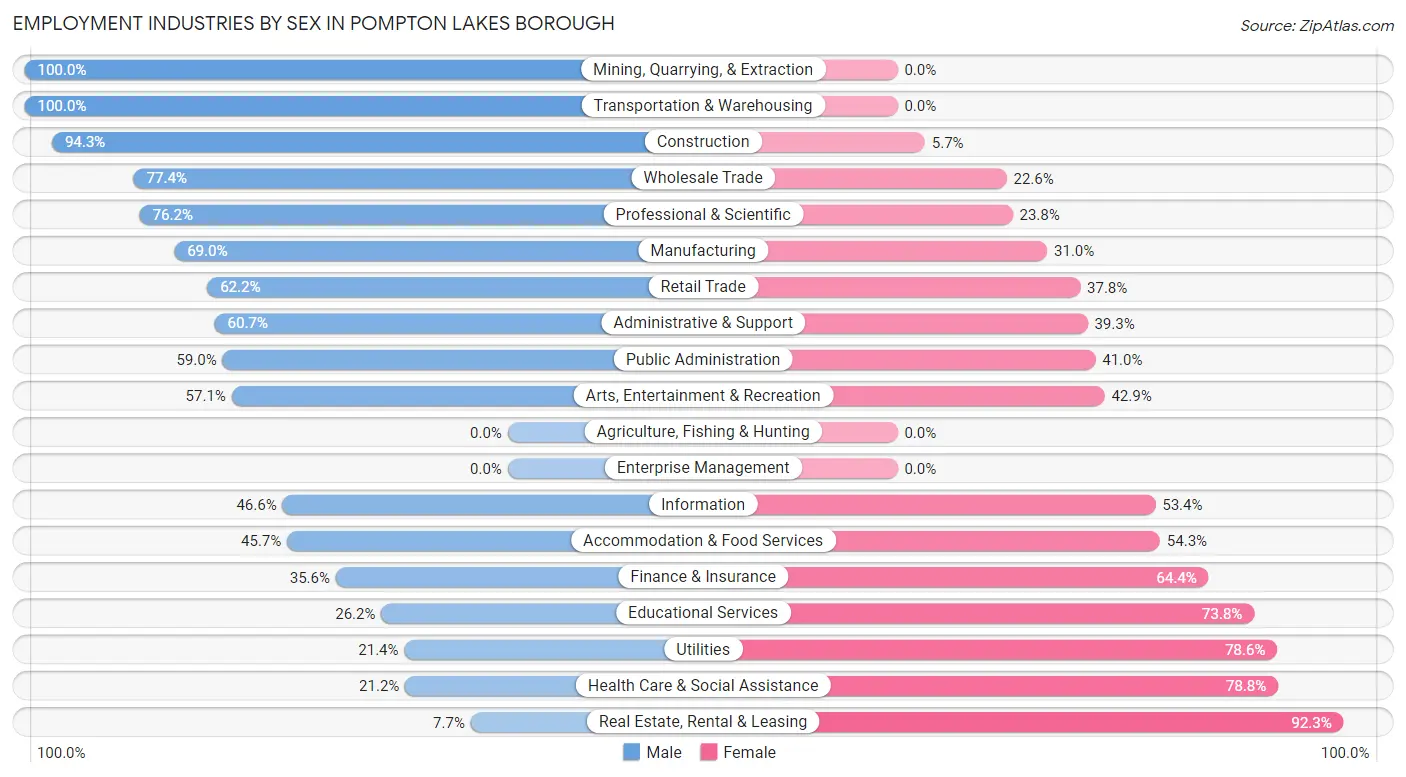
Employment Industries by Sex in Pompton Lakes borough
The Pompton Lakes borough industries that see more men than women are Mining, Quarrying, & Extraction (100.0%), Transportation & Warehousing (100.0%), and Construction (94.3%), whereas the industries that tend to have a higher number of women are Real Estate, Rental & Leasing (92.3%), Health Care & Social Assistance (78.8%), and Utilities (78.6%).
| Industry | Male | Female |
| Agriculture, Fishing & Hunting | 0 (0.0%) | 0 (0.0%) |
| Mining, Quarrying, & Extraction | 6 (100.0%) | 0 (0.0%) |
| Construction | 416 (94.3%) | 25 (5.7%) |
| Manufacturing | 274 (69.0%) | 123 (31.0%) |
| Wholesale Trade | 216 (77.4%) | 63 (22.6%) |
| Retail Trade | 477 (62.2%) | 290 (37.8%) |
| Transportation & Warehousing | 274 (100.0%) | 0 (0.0%) |
| Utilities | 37 (21.4%) | 136 (78.6%) |
| Information | 62 (46.6%) | 71 (53.4%) |
| Finance & Insurance | 147 (35.6%) | 266 (64.4%) |
| Real Estate, Rental & Leasing | 17 (7.7%) | 205 (92.3%) |
| Professional & Scientific | 323 (76.2%) | 101 (23.8%) |
| Enterprise Management | 0 (0.0%) | 0 (0.0%) |
| Administrative & Support | 111 (60.7%) | 72 (39.3%) |
| Educational Services | 173 (26.2%) | 488 (73.8%) |
| Health Care & Social Assistance | 239 (21.2%) | 887 (78.8%) |
| Arts, Entertainment & Recreation | 12 (57.1%) | 9 (42.9%) |
| Accommodation & Food Services | 116 (45.7%) | 138 (54.3%) |
| Public Administration | 173 (59.0%) | 120 (41.0%) |
| Total | 3,198 (50.9%) | 3,080 (49.1%) |
Education in Pompton Lakes borough
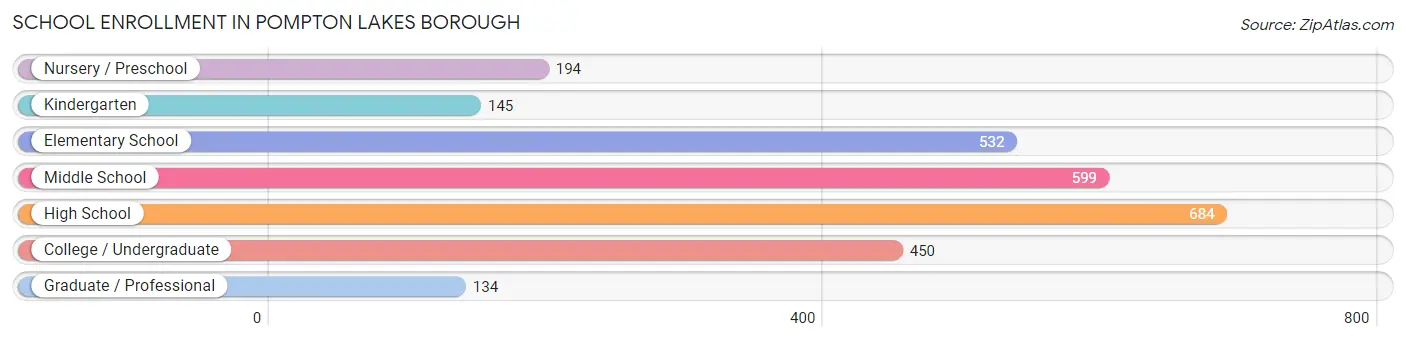
School Enrollment in Pompton Lakes borough
The most common levels of schooling among the 2,738 students in Pompton Lakes borough are high school (684 | 25.0%), middle school (599 | 21.9%), and elementary school (532 | 19.4%).
| School Level | # Students | % Students |
| Nursery / Preschool | 194 | 7.1% |
| Kindergarten | 145 | 5.3% |
| Elementary School | 532 | 19.4% |
| Middle School | 599 | 21.9% |
| High School | 684 | 25.0% |
| College / Undergraduate | 450 | 16.4% |
| Graduate / Professional | 134 | 4.9% |
| Total | 2,738 | 100.0% |
School Enrollment by Age by Funding Source in Pompton Lakes borough
Out of a total of 2,738 students who are enrolled in schools in Pompton Lakes borough, 298 (10.9%) attend a private institution, while the remaining 2,440 (89.1%) are enrolled in public schools. The age group of 3 to 4 year olds has the highest likelihood of being enrolled in private schools, with 86 (54.8% in the age bracket) enrolled. Conversely, the age group of 15 to 17 year olds has the lowest likelihood of being enrolled in a private school, with 552 (100.0% in the age bracket) attending a public institution.
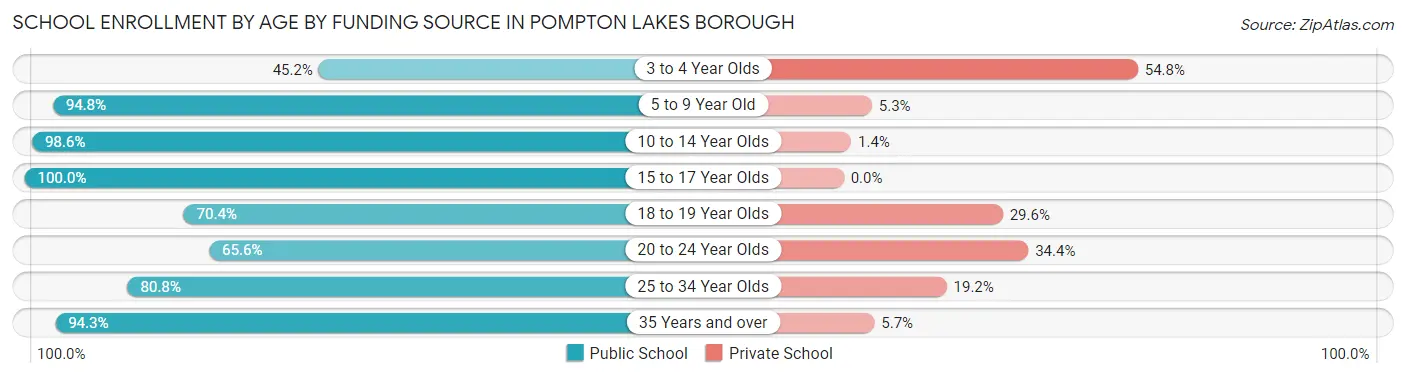
| Age Bracket | Public School | Private School |
| 3 to 4 Year Olds | 71 (45.2%) | 86 (54.8%) |
| 5 to 9 Year Old | 614 (94.8%) | 34 (5.2%) |
| 10 to 14 Year Olds | 717 (98.6%) | 10 (1.4%) |
| 15 to 17 Year Olds | 552 (100.0%) | 0 (0.0%) |
| 18 to 19 Year Olds | 95 (70.4%) | 40 (29.6%) |
| 20 to 24 Year Olds | 168 (65.6%) | 88 (34.4%) |
| 25 to 34 Year Olds | 156 (80.8%) | 37 (19.2%) |
| 35 Years and over | 66 (94.3%) | 4 (5.7%) |
| Total | 2,440 (89.1%) | 298 (10.9%) |
Educational Attainment by Field of Study in Pompton Lakes borough
Business (732 | 21.2%), social sciences (379 | 11.0%), bio, nature & agricultural (361 | 10.5%), education (350 | 10.2%), and science & technology (240 | 7.0%) are the most common fields of study among 3,445 individuals in Pompton Lakes borough who have obtained a bachelor's degree or higher.
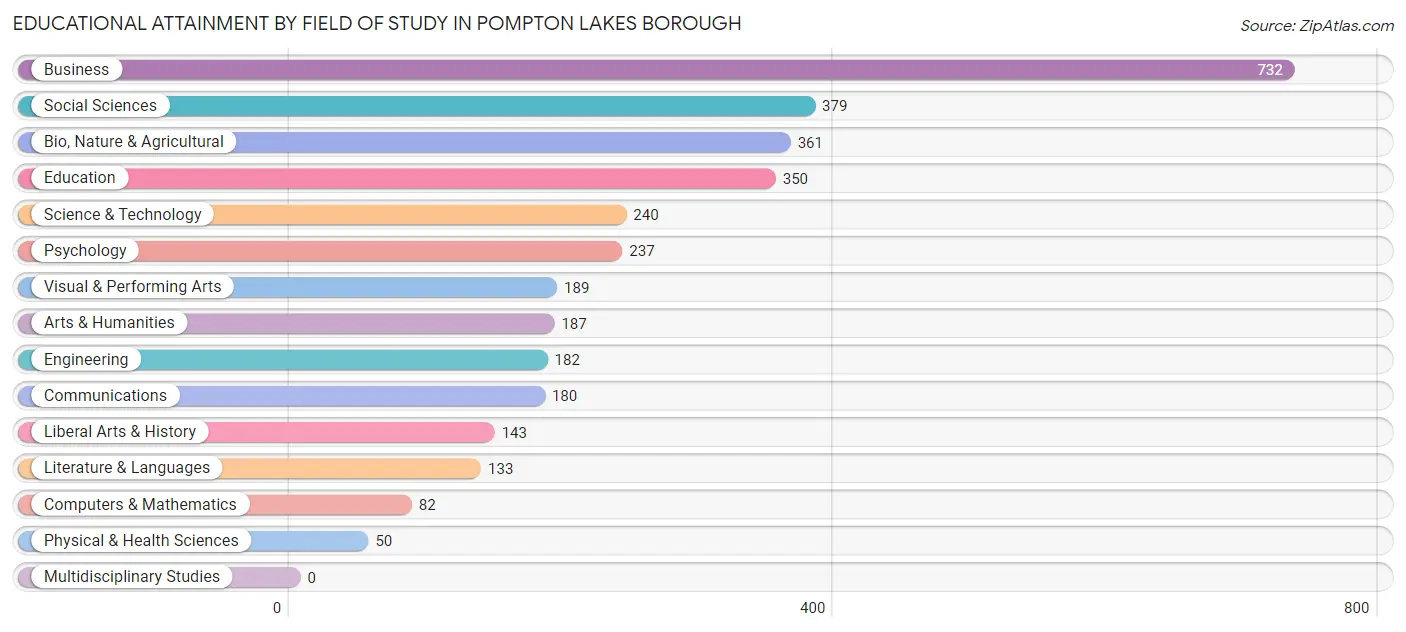
| Field of Study | # Graduates | % Graduates |
| Computers & Mathematics | 82 | 2.4% |
| Bio, Nature & Agricultural | 361 | 10.5% |
| Physical & Health Sciences | 50 | 1.5% |
| Psychology | 237 | 6.9% |
| Social Sciences | 379 | 11.0% |
| Engineering | 182 | 5.3% |
| Multidisciplinary Studies | 0 | 0.0% |
| Science & Technology | 240 | 7.0% |
| Business | 732 | 21.2% |
| Education | 350 | 10.2% |
| Literature & Languages | 133 | 3.9% |
| Liberal Arts & History | 143 | 4.2% |
| Visual & Performing Arts | 189 | 5.5% |
| Communications | 180 | 5.2% |
| Arts & Humanities | 187 | 5.4% |
| Total | 3,445 | 100.0% |
Transportation & Commute in Pompton Lakes borough
Vehicle Availability by Sex in Pompton Lakes borough
The most prevalent vehicle ownership categories in Pompton Lakes borough are males with 2 vehicles (1,458, accounting for 47.3%) and females with 2 vehicles (1,330, making up 49.2%).
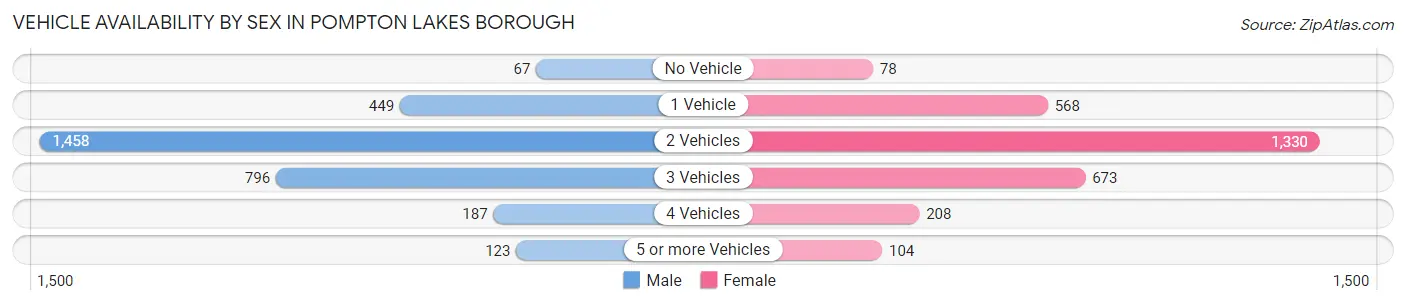
| Vehicles Available | Male | Female |
| No Vehicle | 67 (2.2%) | 78 (2.6%) |
| 1 Vehicle | 449 (14.6%) | 568 (19.2%) |
| 2 Vehicles | 1,458 (47.3%) | 1,330 (44.9%) |
| 3 Vehicles | 796 (25.8%) | 673 (22.7%) |
| 4 Vehicles | 187 (6.1%) | 208 (7.0%) |
| 5 or more Vehicles | 123 (4.0%) | 104 (3.5%) |
| Total | 3,080 (100.0%) | 2,961 (100.0%) |
Commute Time in Pompton Lakes borough
The most frequently occuring commute durations in Pompton Lakes borough are 30 to 34 minutes (1,167 commuters, 21.0%), 20 to 24 minutes (663 commuters, 11.9%), and 45 to 59 minutes (566 commuters, 10.2%).
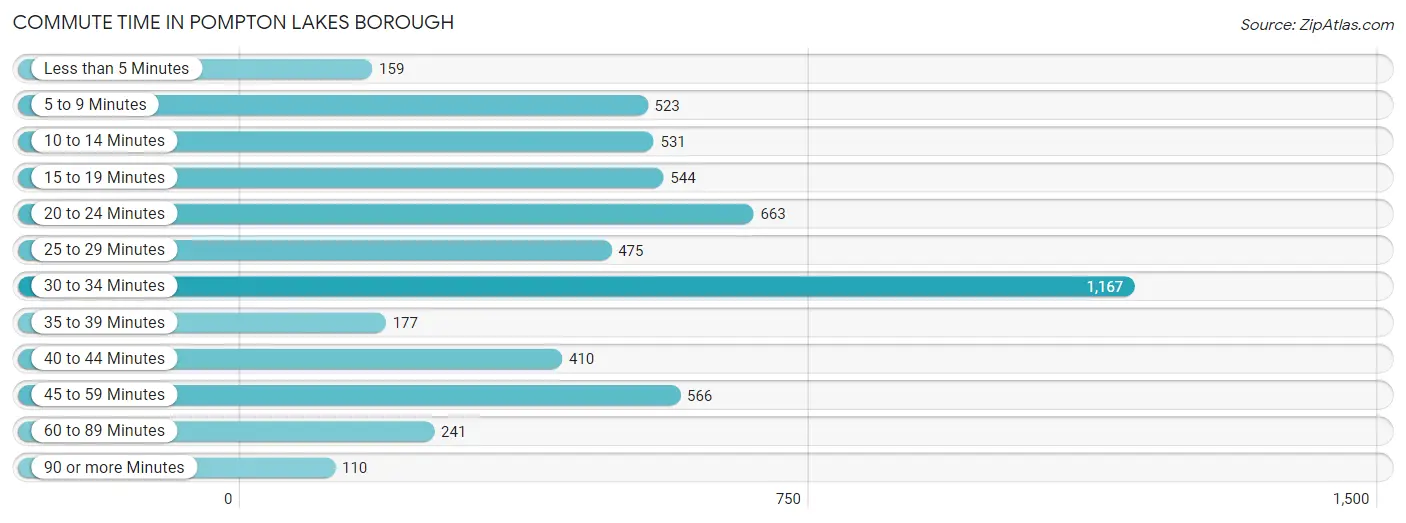
| Commute Time | # Commuters | % Commuters |
| Less than 5 Minutes | 159 | 2.9% |
| 5 to 9 Minutes | 523 | 9.4% |
| 10 to 14 Minutes | 531 | 9.5% |
| 15 to 19 Minutes | 544 | 9.8% |
| 20 to 24 Minutes | 663 | 11.9% |
| 25 to 29 Minutes | 475 | 8.5% |
| 30 to 34 Minutes | 1,167 | 21.0% |
| 35 to 39 Minutes | 177 | 3.2% |
| 40 to 44 Minutes | 410 | 7.4% |
| 45 to 59 Minutes | 566 | 10.2% |
| 60 to 89 Minutes | 241 | 4.3% |
| 90 or more Minutes | 110 | 2.0% |
Commute Time by Sex in Pompton Lakes borough
The most common commute times in Pompton Lakes borough are 30 to 34 minutes (495 commuters, 17.4%) for males and 30 to 34 minutes (672 commuters, 24.6%) for females.
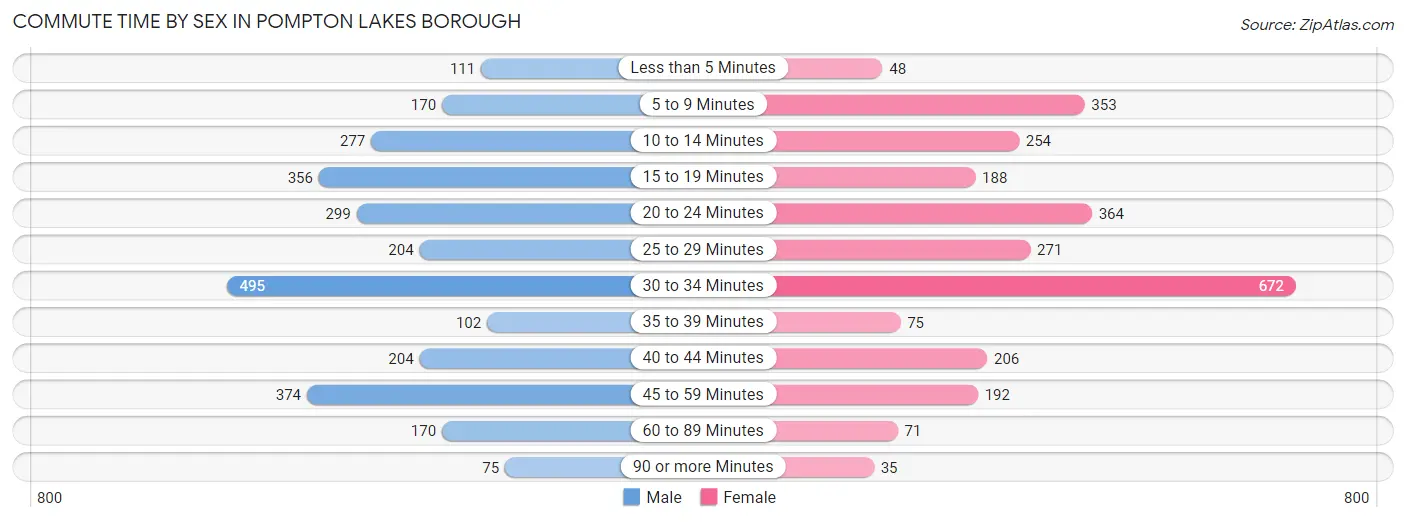
| Commute Time | Male | Female |
| Less than 5 Minutes | 111 (3.9%) | 48 (1.8%) |
| 5 to 9 Minutes | 170 (6.0%) | 353 (12.9%) |
| 10 to 14 Minutes | 277 (9.8%) | 254 (9.3%) |
| 15 to 19 Minutes | 356 (12.6%) | 188 (6.9%) |
| 20 to 24 Minutes | 299 (10.5%) | 364 (13.3%) |
| 25 to 29 Minutes | 204 (7.2%) | 271 (9.9%) |
| 30 to 34 Minutes | 495 (17.4%) | 672 (24.6%) |
| 35 to 39 Minutes | 102 (3.6%) | 75 (2.8%) |
| 40 to 44 Minutes | 204 (7.2%) | 206 (7.5%) |
| 45 to 59 Minutes | 374 (13.2%) | 192 (7.0%) |
| 60 to 89 Minutes | 170 (6.0%) | 71 (2.6%) |
| 90 or more Minutes | 75 (2.6%) | 35 (1.3%) |
Time of Departure to Work by Sex in Pompton Lakes borough
The most frequent times of departure to work in Pompton Lakes borough are 7:00 AM to 7:29 AM (461, 16.3%) for males and 7:30 AM to 7:59 AM (500, 18.3%) for females.
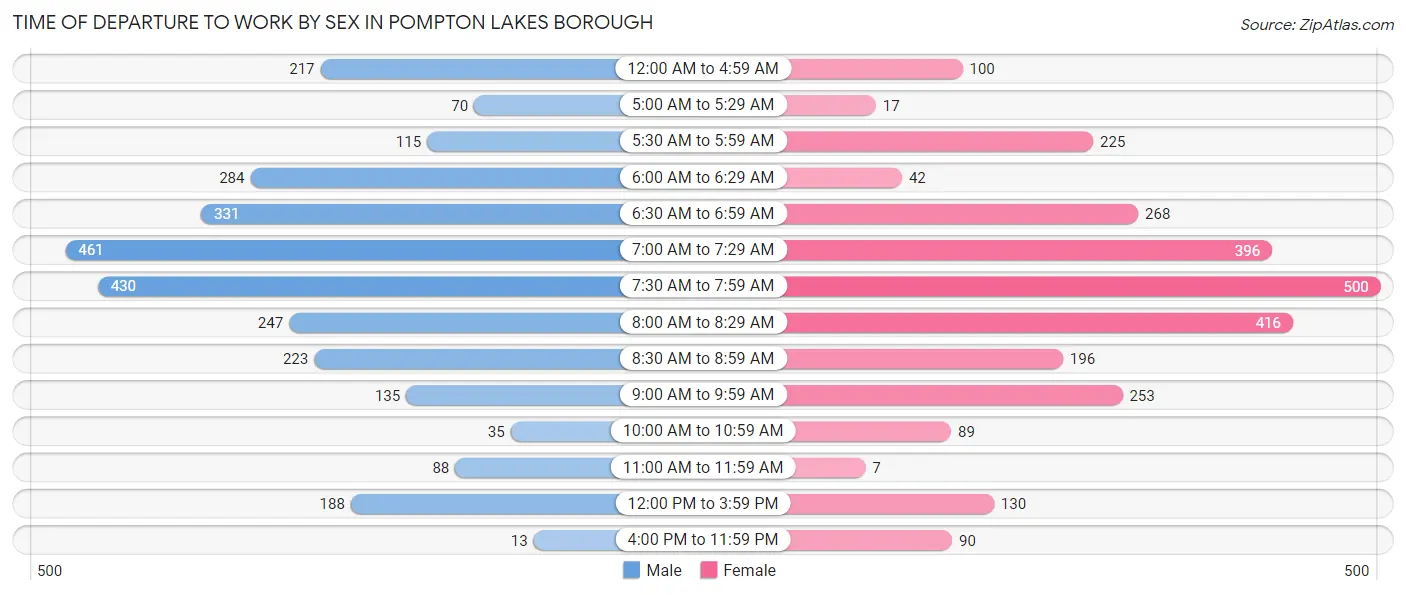
| Time of Departure | Male | Female |
| 12:00 AM to 4:59 AM | 217 (7.6%) | 100 (3.7%) |
| 5:00 AM to 5:29 AM | 70 (2.5%) | 17 (0.6%) |
| 5:30 AM to 5:59 AM | 115 (4.1%) | 225 (8.2%) |
| 6:00 AM to 6:29 AM | 284 (10.0%) | 42 (1.5%) |
| 6:30 AM to 6:59 AM | 331 (11.7%) | 268 (9.8%) |
| 7:00 AM to 7:29 AM | 461 (16.3%) | 396 (14.5%) |
| 7:30 AM to 7:59 AM | 430 (15.2%) | 500 (18.3%) |
| 8:00 AM to 8:29 AM | 247 (8.7%) | 416 (15.2%) |
| 8:30 AM to 8:59 AM | 223 (7.9%) | 196 (7.2%) |
| 9:00 AM to 9:59 AM | 135 (4.8%) | 253 (9.3%) |
| 10:00 AM to 10:59 AM | 35 (1.2%) | 89 (3.3%) |
| 11:00 AM to 11:59 AM | 88 (3.1%) | 7 (0.3%) |
| 12:00 PM to 3:59 PM | 188 (6.6%) | 130 (4.8%) |
| 4:00 PM to 11:59 PM | 13 (0.5%) | 90 (3.3%) |
| Total | 2,837 (100.0%) | 2,729 (100.0%) |
Housing Occupancy in Pompton Lakes borough
Occupancy by Ownership in Pompton Lakes borough
Of the total 4,227 dwellings in Pompton Lakes borough, owner-occupied units account for 3,301 (78.1%), while renter-occupied units make up 926 (21.9%).
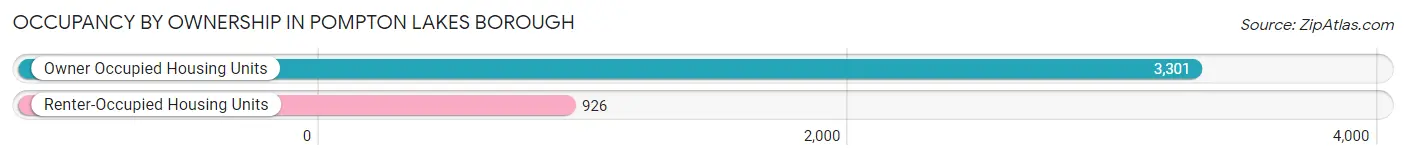
| Occupancy | # Housing Units | % Housing Units |
| Owner Occupied Housing Units | 3,301 | 78.1% |
| Renter-Occupied Housing Units | 926 | 21.9% |
| Total Occupied Housing Units | 4,227 | 100.0% |
Occupancy by Household Size in Pompton Lakes borough
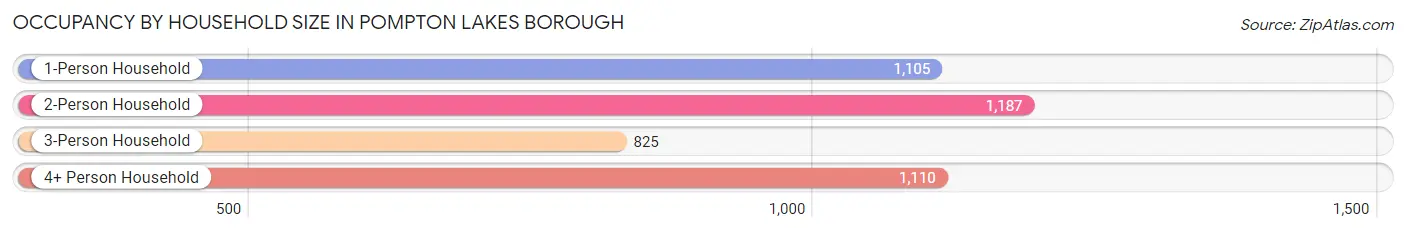
| Household Size | # Housing Units | % Housing Units |
| 1-Person Household | 1,105 | 26.1% |
| 2-Person Household | 1,187 | 28.1% |
| 3-Person Household | 825 | 19.5% |
| 4+ Person Household | 1,110 | 26.3% |
| Total Housing Units | 4,227 | 100.0% |
Occupancy by Ownership by Household Size in Pompton Lakes borough
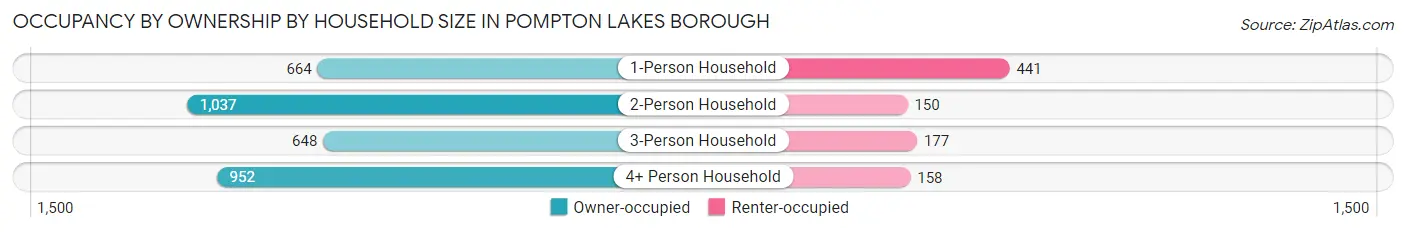
| Household Size | Owner-occupied | Renter-occupied |
| 1-Person Household | 664 (60.1%) | 441 (39.9%) |
| 2-Person Household | 1,037 (87.4%) | 150 (12.6%) |
| 3-Person Household | 648 (78.5%) | 177 (21.4%) |
| 4+ Person Household | 952 (85.8%) | 158 (14.2%) |
| Total Housing Units | 3,301 (78.1%) | 926 (21.9%) |
Occupancy by Educational Attainment in Pompton Lakes borough
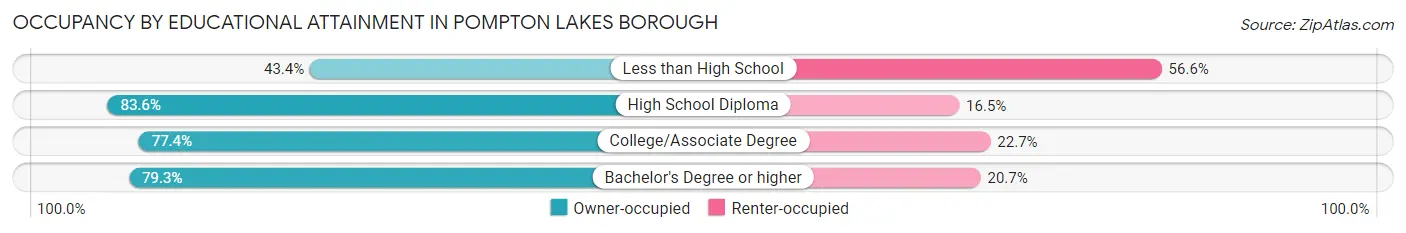
| Household Size | Owner-occupied | Renter-occupied |
| Less than High School | 92 (43.4%) | 120 (56.6%) |
| High School Diploma | 889 (83.6%) | 175 (16.5%) |
| College/Associate Degree | 799 (77.3%) | 234 (22.7%) |
| Bachelor's Degree or higher | 1,521 (79.3%) | 397 (20.7%) |
Occupancy by Age of Householder in Pompton Lakes borough
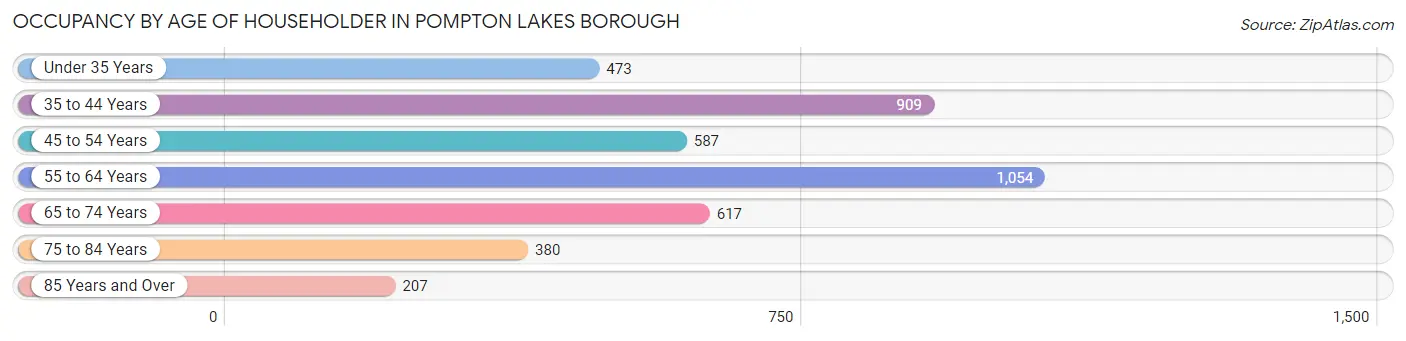
| Age Bracket | # Households | % Households |
| Under 35 Years | 473 | 11.2% |
| 35 to 44 Years | 909 | 21.5% |
| 45 to 54 Years | 587 | 13.9% |
| 55 to 64 Years | 1,054 | 24.9% |
| 65 to 74 Years | 617 | 14.6% |
| 75 to 84 Years | 380 | 9.0% |
| 85 Years and Over | 207 | 4.9% |
| Total | 4,227 | 100.0% |
Housing Finances in Pompton Lakes borough
Median Income by Occupancy in Pompton Lakes borough
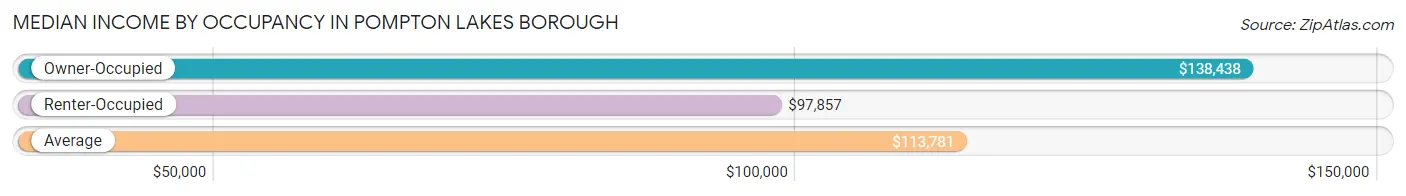
| Occupancy Type | # Households | Median Income |
| Owner-Occupied | 3,301 (78.1%) | $138,438 |
| Renter-Occupied | 926 (21.9%) | $97,857 |
| Average | 4,227 (100.0%) | $113,781 |
Occupancy by Householder Income Bracket in Pompton Lakes borough
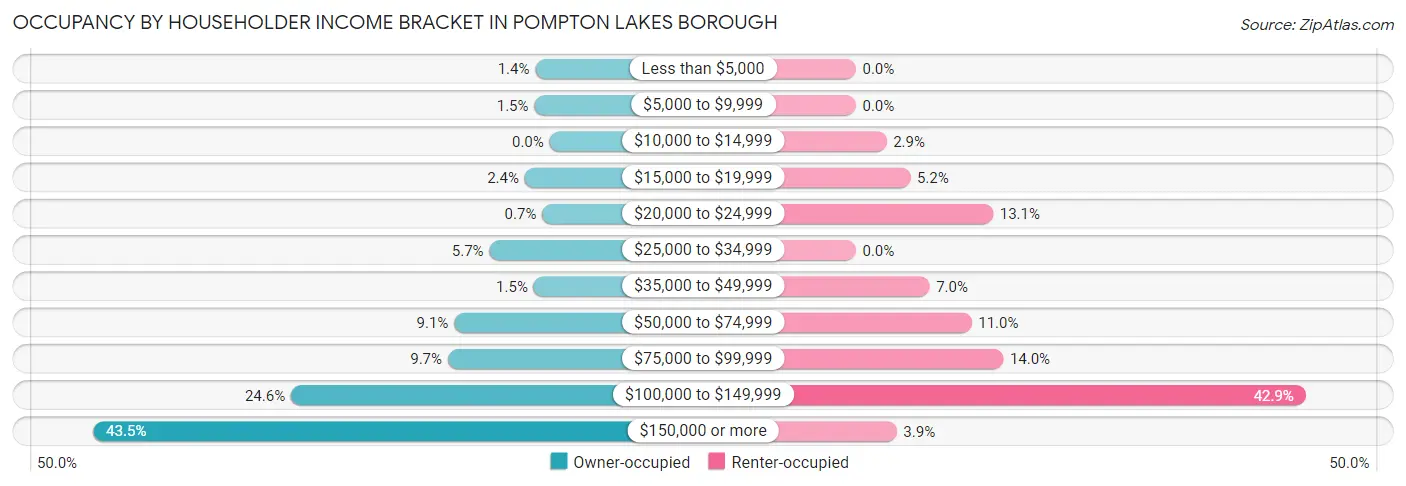
| Income Bracket | Owner-occupied | Renter-occupied |
| Less than $5,000 | 45 (1.4%) | 0 (0.0%) |
| $5,000 to $9,999 | 48 (1.5%) | 0 (0.0%) |
| $10,000 to $14,999 | 0 (0.0%) | 27 (2.9%) |
| $15,000 to $19,999 | 78 (2.4%) | 48 (5.2%) |
| $20,000 to $24,999 | 23 (0.7%) | 121 (13.1%) |
| $25,000 to $34,999 | 189 (5.7%) | 0 (0.0%) |
| $35,000 to $49,999 | 50 (1.5%) | 65 (7.0%) |
| $50,000 to $74,999 | 300 (9.1%) | 102 (11.0%) |
| $75,000 to $99,999 | 320 (9.7%) | 130 (14.0%) |
| $100,000 to $149,999 | 813 (24.6%) | 397 (42.9%) |
| $150,000 or more | 1,435 (43.5%) | 36 (3.9%) |
| Total | 3,301 (100.0%) | 926 (100.0%) |
Monthly Housing Cost Tiers in Pompton Lakes borough
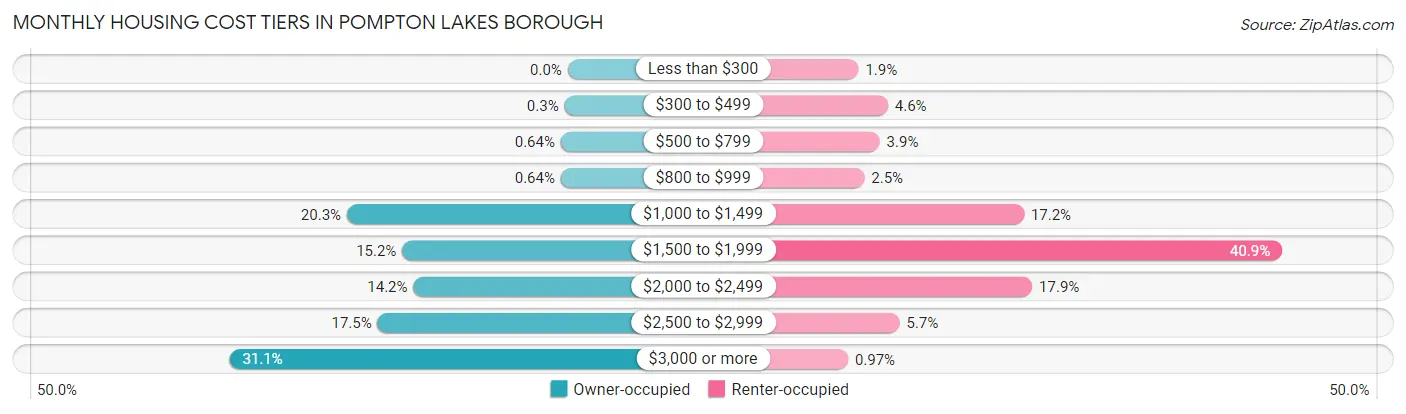
| Monthly Cost | Owner-occupied | Renter-occupied |
| Less than $300 | 0 (0.0%) | 18 (1.9%) |
| $300 to $499 | 10 (0.3%) | 43 (4.6%) |
| $500 to $799 | 21 (0.6%) | 36 (3.9%) |
| $800 to $999 | 21 (0.6%) | 23 (2.5%) |
| $1,000 to $1,499 | 671 (20.3%) | 159 (17.2%) |
| $1,500 to $1,999 | 503 (15.2%) | 379 (40.9%) |
| $2,000 to $2,499 | 469 (14.2%) | 166 (17.9%) |
| $2,500 to $2,999 | 578 (17.5%) | 53 (5.7%) |
| $3,000 or more | 1,028 (31.1%) | 9 (1.0%) |
| Total | 3,301 (100.0%) | 926 (100.0%) |
Physical Housing Characteristics in Pompton Lakes borough
Housing Structures in Pompton Lakes borough
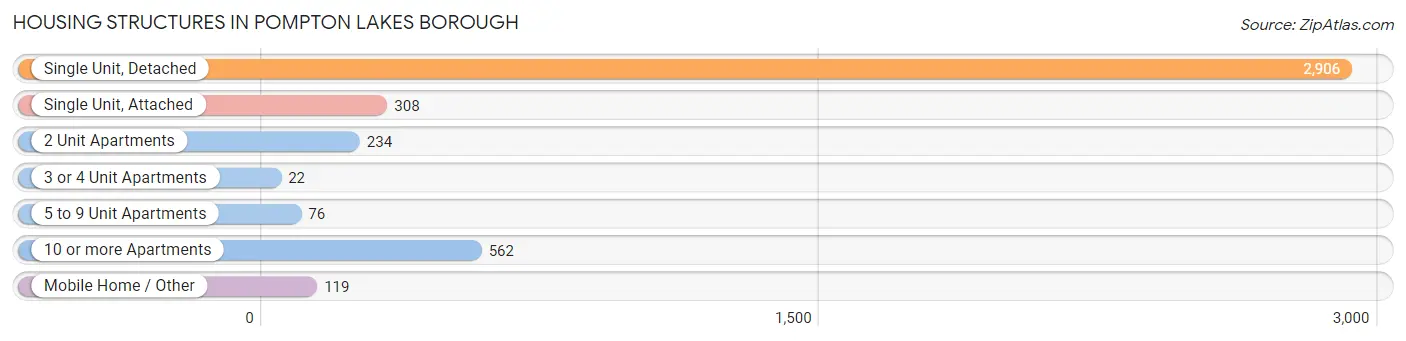
| Structure Type | # Housing Units | % Housing Units |
| Single Unit, Detached | 2,906 | 68.8% |
| Single Unit, Attached | 308 | 7.3% |
| 2 Unit Apartments | 234 | 5.5% |
| 3 or 4 Unit Apartments | 22 | 0.5% |
| 5 to 9 Unit Apartments | 76 | 1.8% |
| 10 or more Apartments | 562 | 13.3% |
| Mobile Home / Other | 119 | 2.8% |
| Total | 4,227 | 100.0% |
Housing Structures by Occupancy in Pompton Lakes borough
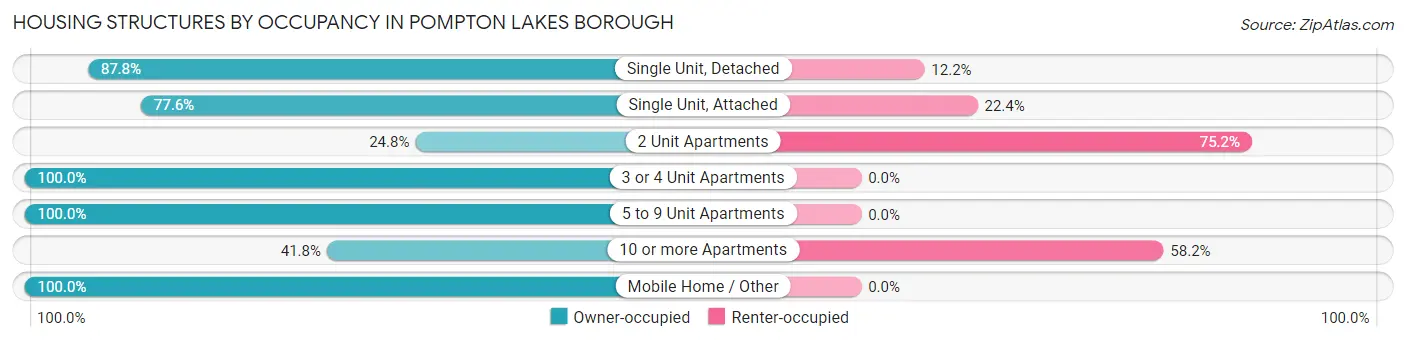
| Structure Type | Owner-occupied | Renter-occupied |
| Single Unit, Detached | 2,552 (87.8%) | 354 (12.2%) |
| Single Unit, Attached | 239 (77.6%) | 69 (22.4%) |
| 2 Unit Apartments | 58 (24.8%) | 176 (75.2%) |
| 3 or 4 Unit Apartments | 22 (100.0%) | 0 (0.0%) |
| 5 to 9 Unit Apartments | 76 (100.0%) | 0 (0.0%) |
| 10 or more Apartments | 235 (41.8%) | 327 (58.2%) |
| Mobile Home / Other | 119 (100.0%) | 0 (0.0%) |
| Total | 3,301 (78.1%) | 926 (21.9%) |
Housing Structures by Number of Rooms in Pompton Lakes borough
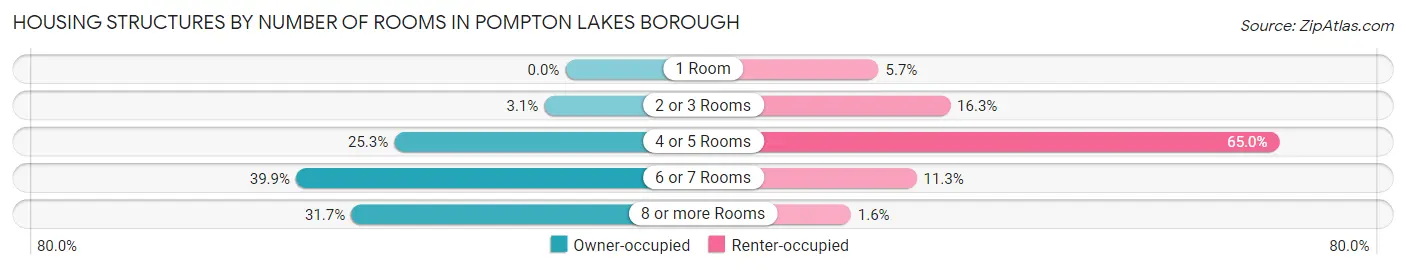
| Number of Rooms | Owner-occupied | Renter-occupied |
| 1 Room | 0 (0.0%) | 53 (5.7%) |
| 2 or 3 Rooms | 103 (3.1%) | 151 (16.3%) |
| 4 or 5 Rooms | 836 (25.3%) | 602 (65.0%) |
| 6 or 7 Rooms | 1,316 (39.9%) | 105 (11.3%) |
| 8 or more Rooms | 1,046 (31.7%) | 15 (1.6%) |
| Total | 3,301 (100.0%) | 926 (100.0%) |
Housing Structure by Heating Type in Pompton Lakes borough
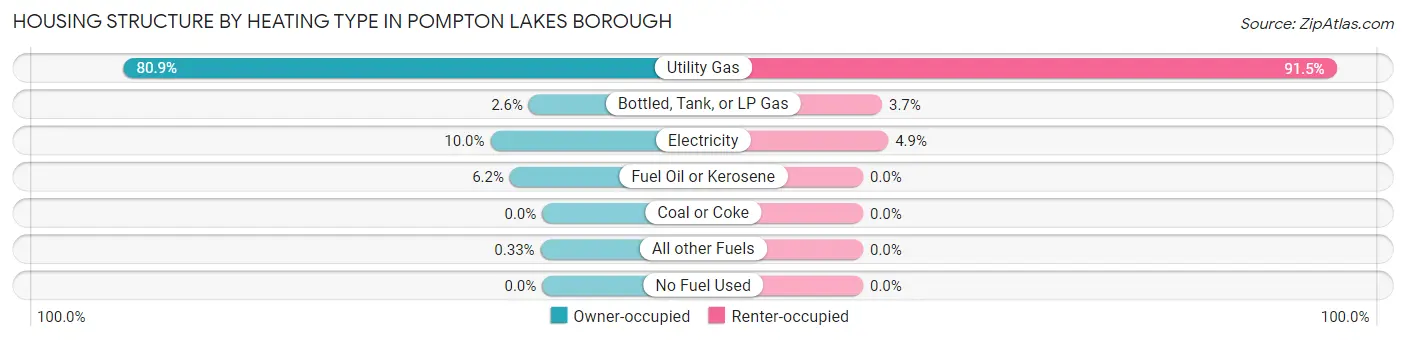
| Heating Type | Owner-occupied | Renter-occupied |
| Utility Gas | 2,669 (80.8%) | 847 (91.5%) |
| Bottled, Tank, or LP Gas | 85 (2.6%) | 34 (3.7%) |
| Electricity | 330 (10.0%) | 45 (4.9%) |
| Fuel Oil or Kerosene | 206 (6.2%) | 0 (0.0%) |
| Coal or Coke | 0 (0.0%) | 0 (0.0%) |
| All other Fuels | 11 (0.3%) | 0 (0.0%) |
| No Fuel Used | 0 (0.0%) | 0 (0.0%) |
| Total | 3,301 (100.0%) | 926 (100.0%) |
Household Vehicle Usage in Pompton Lakes borough
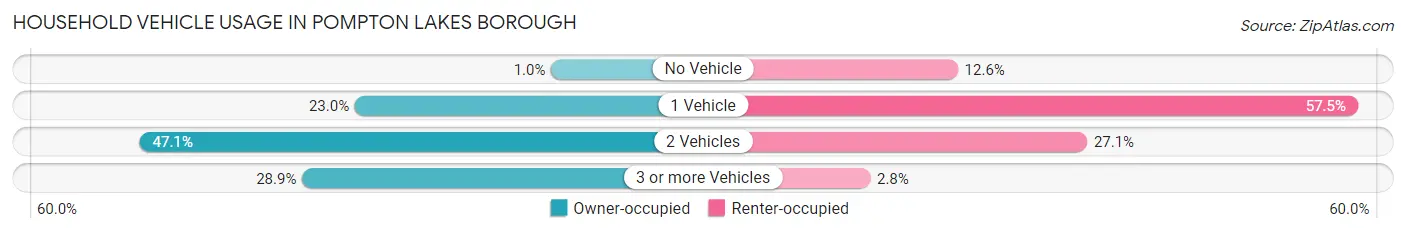
| Vehicles per Household | Owner-occupied | Renter-occupied |
| No Vehicle | 33 (1.0%) | 117 (12.6%) |
| 1 Vehicle | 759 (23.0%) | 532 (57.5%) |
| 2 Vehicles | 1,555 (47.1%) | 251 (27.1%) |
| 3 or more Vehicles | 954 (28.9%) | 26 (2.8%) |
| Total | 3,301 (100.0%) | 926 (100.0%) |
Real Estate & Mortgages in Pompton Lakes borough
Real Estate and Mortgage Overview in Pompton Lakes borough
| Characteristic | Without Mortgage | With Mortgage |
| Housing Units | 874 | 2,427 |
| Median Property Value | $373,700 | $373,900 |
| Median Household Income | $118,182 | $1,246 |
| Monthly Housing Costs | $1,341 | $1,028 |
| Real Estate Taxes | $10,001 | $0 |
Property Value by Mortgage Status in Pompton Lakes borough
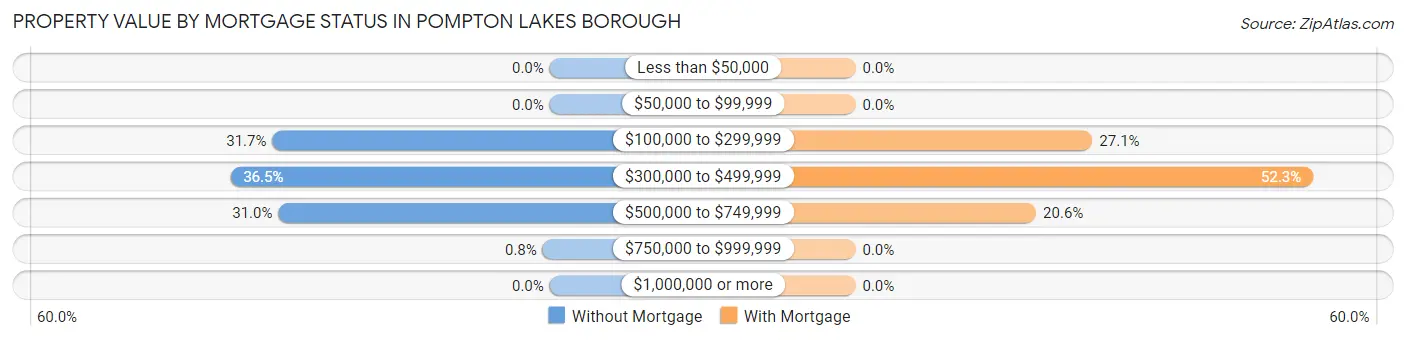
| Property Value | Without Mortgage | With Mortgage |
| Less than $50,000 | 0 (0.0%) | 0 (0.0%) |
| $50,000 to $99,999 | 0 (0.0%) | 0 (0.0%) |
| $100,000 to $299,999 | 277 (31.7%) | 657 (27.1%) |
| $300,000 to $499,999 | 319 (36.5%) | 1,269 (52.3%) |
| $500,000 to $749,999 | 271 (31.0%) | 501 (20.6%) |
| $750,000 to $999,999 | 7 (0.8%) | 0 (0.0%) |
| $1,000,000 or more | 0 (0.0%) | 0 (0.0%) |
| Total | 874 (100.0%) | 2,427 (100.0%) |
Household Income by Mortgage Status in Pompton Lakes borough
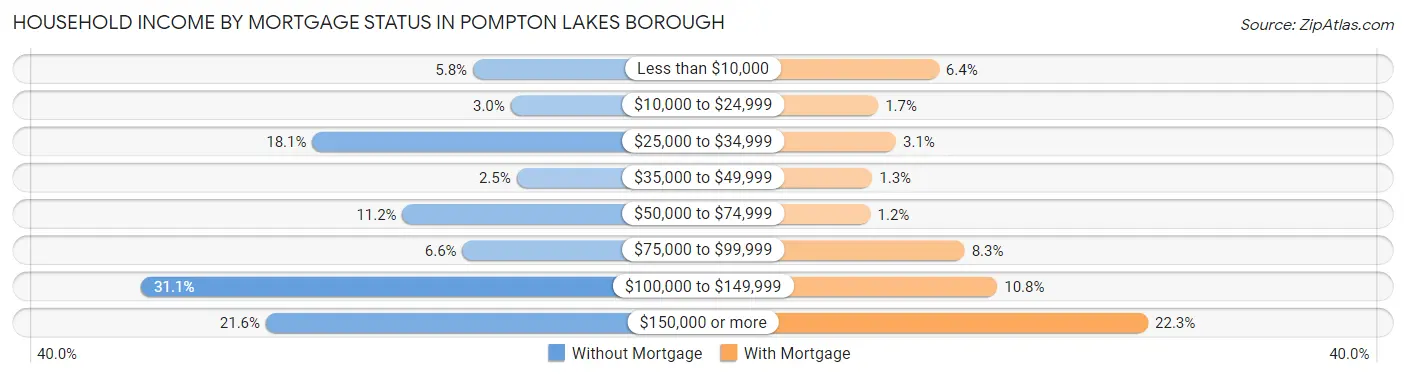
| Household Income | Without Mortgage | With Mortgage |
| Less than $10,000 | 51 (5.8%) | 154 (6.4%) |
| $10,000 to $24,999 | 26 (3.0%) | 42 (1.7%) |
| $25,000 to $34,999 | 158 (18.1%) | 75 (3.1%) |
| $35,000 to $49,999 | 22 (2.5%) | 31 (1.3%) |
| $50,000 to $74,999 | 98 (11.2%) | 28 (1.1%) |
| $75,000 to $99,999 | 58 (6.6%) | 202 (8.3%) |
| $100,000 to $149,999 | 272 (31.1%) | 262 (10.8%) |
| $150,000 or more | 189 (21.6%) | 541 (22.3%) |
| Total | 874 (100.0%) | 2,427 (100.0%) |
Property Value to Household Income Ratio in Pompton Lakes borough
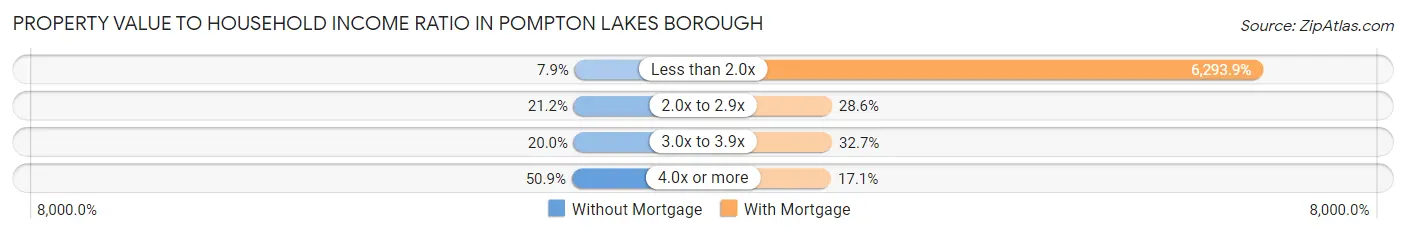
| Value-to-Income Ratio | Without Mortgage | With Mortgage |
| Less than 2.0x | 69 (7.9%) | 152,753 (6,293.9%) |
| 2.0x to 2.9x | 185 (21.2%) | 694 (28.6%) |
| 3.0x to 3.9x | 175 (20.0%) | 794 (32.7%) |
| 4.0x or more | 445 (50.9%) | 416 (17.1%) |
| Total | 874 (100.0%) | 2,427 (100.0%) |
Real Estate Taxes by Mortgage Status in Pompton Lakes borough
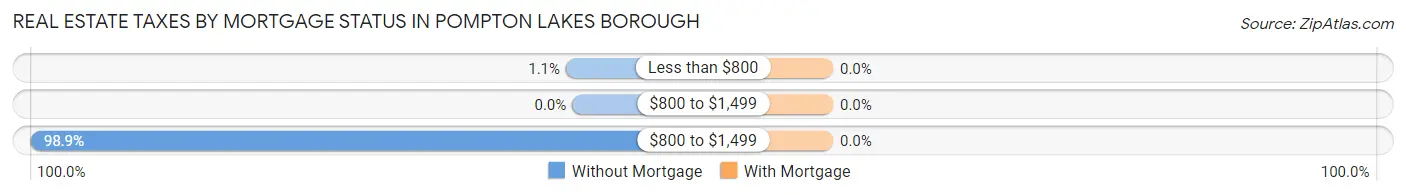
| Property Taxes | Without Mortgage | With Mortgage |
| Less than $800 | 10 (1.1%) | 0 (0.0%) |
| $800 to $1,499 | 0 (0.0%) | 0 (0.0%) |
| $800 to $1,499 | 864 (98.9%) | 0 (0.0%) |
| Total | 874 (100.0%) | 2,427 (100.0%) |
Health & Disability in Pompton Lakes borough
Health Insurance Coverage by Age in Pompton Lakes borough
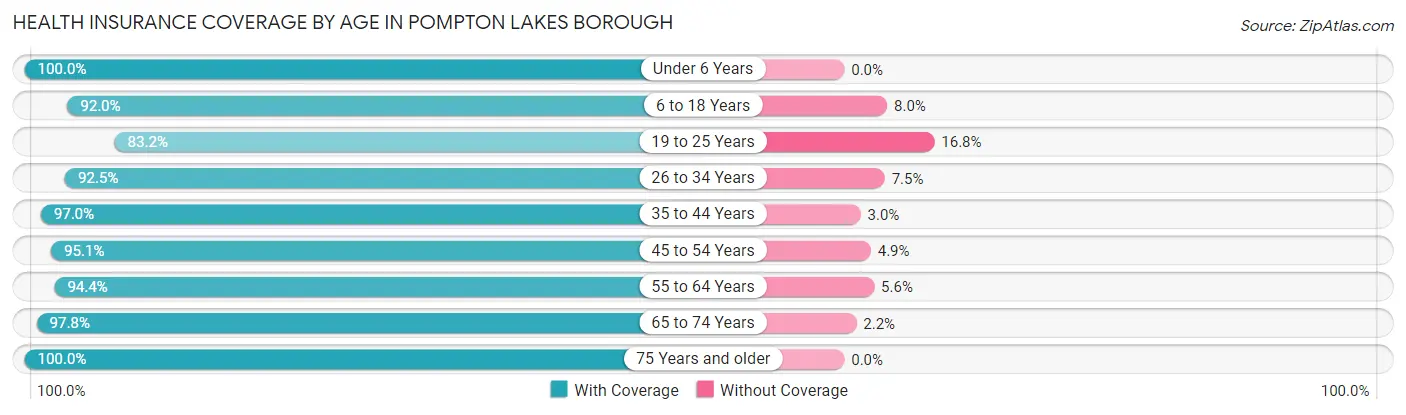
| Age Bracket | With Coverage | Without Coverage |
| Under 6 Years | 699 (100.0%) | 0 (0.0%) |
| 6 to 18 Years | 1,776 (92.0%) | 154 (8.0%) |
| 19 to 25 Years | 703 (83.2%) | 142 (16.8%) |
| 26 to 34 Years | 1,202 (92.5%) | 98 (7.5%) |
| 35 to 44 Years | 1,596 (97.0%) | 50 (3.0%) |
| 45 to 54 Years | 1,115 (95.1%) | 58 (4.9%) |
| 55 to 64 Years | 1,594 (94.4%) | 94 (5.6%) |
| 65 to 74 Years | 918 (97.8%) | 21 (2.2%) |
| 75 Years and older | 832 (100.0%) | 0 (0.0%) |
| Total | 10,435 (94.4%) | 617 (5.6%) |
Health Insurance Coverage by Citizenship Status in Pompton Lakes borough
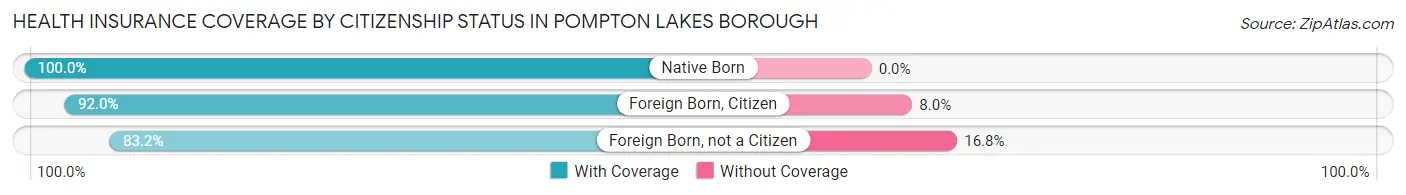
| Citizenship Status | With Coverage | Without Coverage |
| Native Born | 699 (100.0%) | 0 (0.0%) |
| Foreign Born, Citizen | 1,776 (92.0%) | 154 (8.0%) |
| Foreign Born, not a Citizen | 703 (83.2%) | 142 (16.8%) |
Health Insurance Coverage by Household Income in Pompton Lakes borough
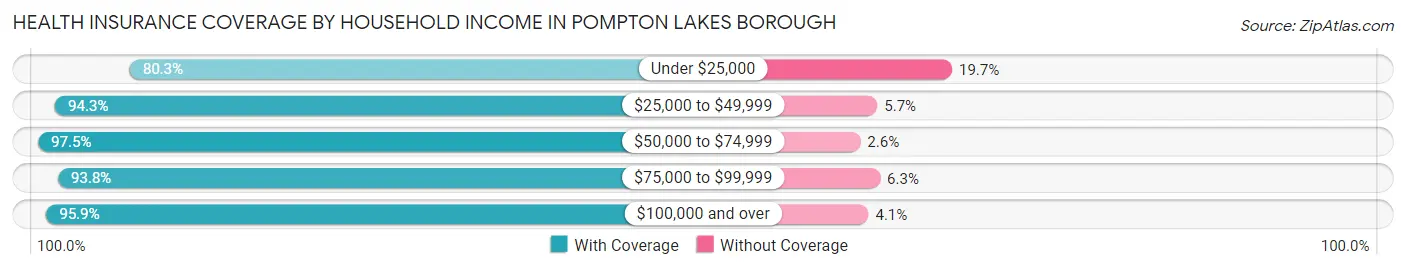
| Household Income | With Coverage | Without Coverage |
| Under $25,000 | 790 (80.3%) | 194 (19.7%) |
| $25,000 to $49,999 | 478 (94.3%) | 29 (5.7%) |
| $50,000 to $74,999 | 993 (97.5%) | 26 (2.5%) |
| $75,000 to $99,999 | 915 (93.8%) | 61 (6.2%) |
| $100,000 and over | 7,234 (95.9%) | 307 (4.1%) |
Public vs Private Health Insurance Coverage by Age in Pompton Lakes borough
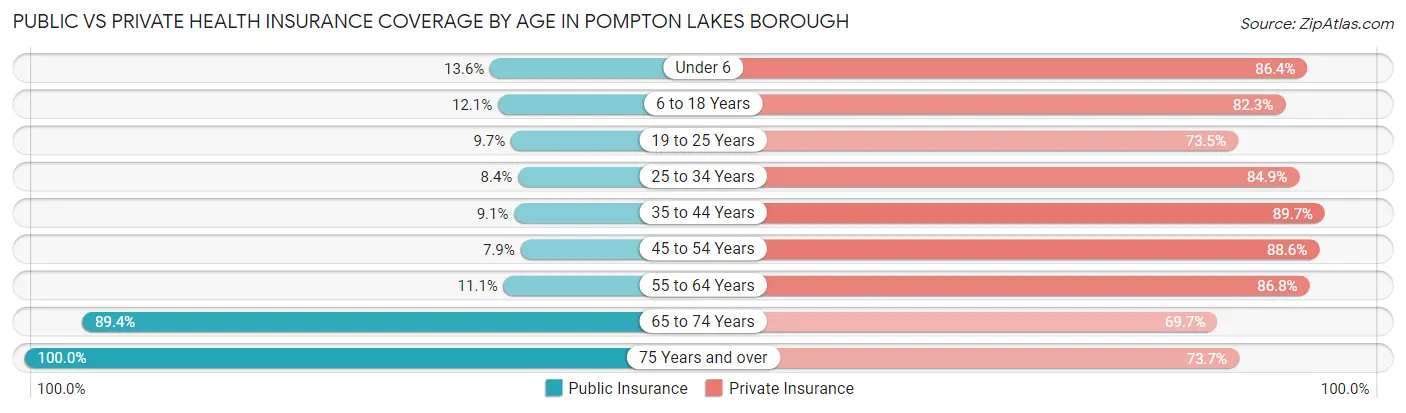
| Age Bracket | Public Insurance | Private Insurance |
| Under 6 | 95 (13.6%) | 604 (86.4%) |
| 6 to 18 Years | 234 (12.1%) | 1,588 (82.3%) |
| 19 to 25 Years | 82 (9.7%) | 621 (73.5%) |
| 25 to 34 Years | 109 (8.4%) | 1,103 (84.9%) |
| 35 to 44 Years | 150 (9.1%) | 1,476 (89.7%) |
| 45 to 54 Years | 93 (7.9%) | 1,039 (88.6%) |
| 55 to 64 Years | 187 (11.1%) | 1,465 (86.8%) |
| 65 to 74 Years | 839 (89.3%) | 654 (69.7%) |
| 75 Years and over | 832 (100.0%) | 613 (73.7%) |
| Total | 2,621 (23.7%) | 9,163 (82.9%) |
Disability Status by Sex by Age in Pompton Lakes borough
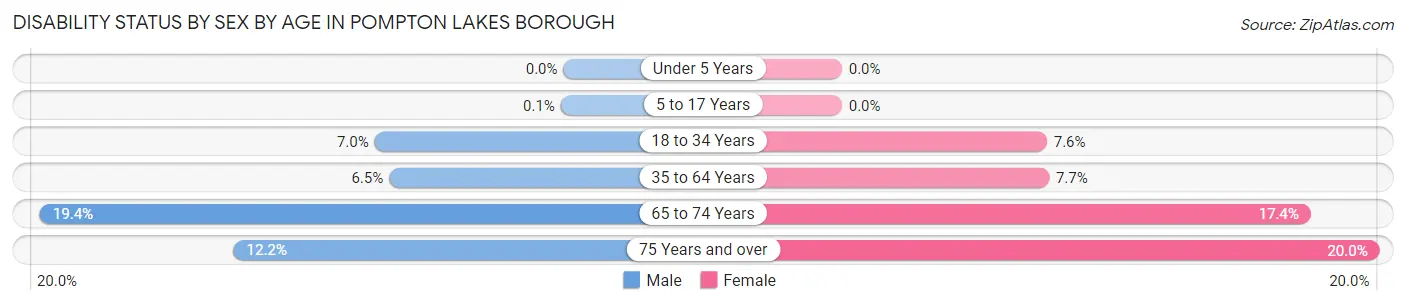
| Age Bracket | Male | Female |
| Under 5 Years | 0 (0.0%) | 0 (0.0%) |
| 5 to 17 Years | 1 (0.1%) | 0 (0.0%) |
| 18 to 34 Years | 85 (7.0%) | 77 (7.6%) |
| 35 to 64 Years | 140 (6.5%) | 180 (7.7%) |
| 65 to 74 Years | 82 (19.4%) | 90 (17.4%) |
| 75 Years and over | 35 (12.2%) | 109 (20.0%) |
Disability Class by Sex by Age in Pompton Lakes borough
Disability Class: Hearing Difficulty
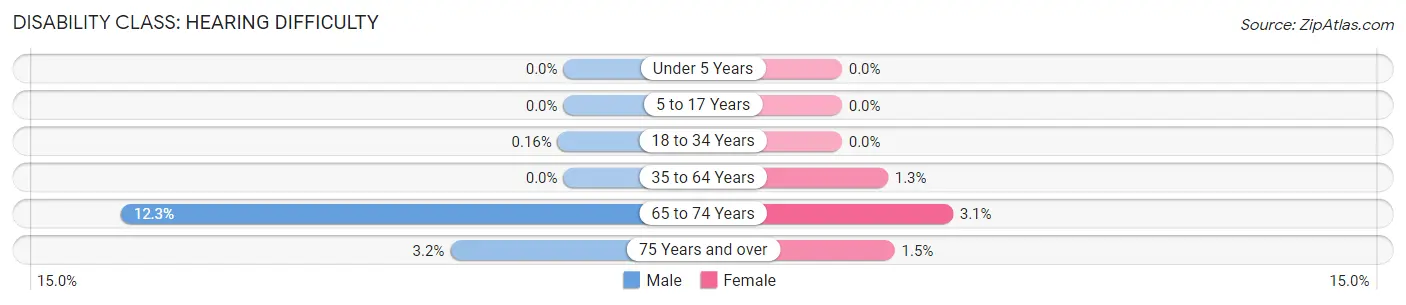
| Age Bracket | Male | Female |
| Under 5 Years | 0 (0.0%) | 0 (0.0%) |
| 5 to 17 Years | 0 (0.0%) | 0 (0.0%) |
| 18 to 34 Years | 2 (0.2%) | 0 (0.0%) |
| 35 to 64 Years | 0 (0.0%) | 30 (1.3%) |
| 65 to 74 Years | 52 (12.3%) | 16 (3.1%) |
| 75 Years and over | 9 (3.2%) | 8 (1.5%) |
Disability Class: Vision Difficulty
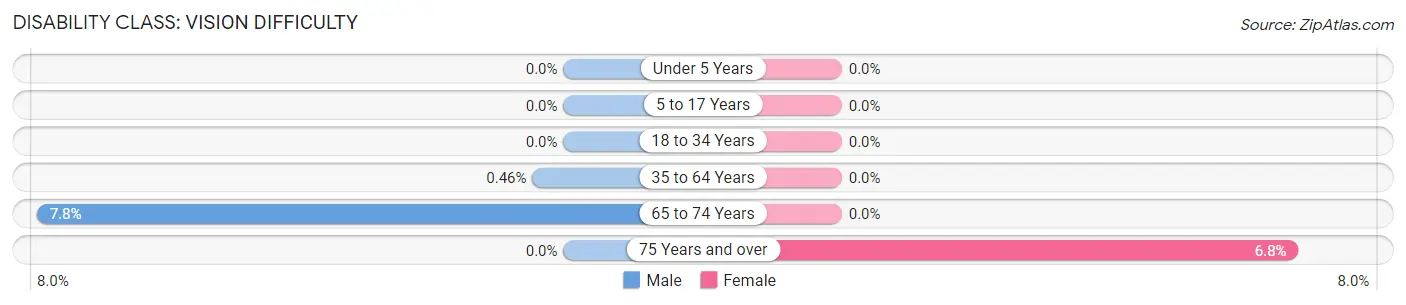
| Age Bracket | Male | Female |
| Under 5 Years | 0 (0.0%) | 0 (0.0%) |
| 5 to 17 Years | 0 (0.0%) | 0 (0.0%) |
| 18 to 34 Years | 0 (0.0%) | 0 (0.0%) |
| 35 to 64 Years | 10 (0.5%) | 0 (0.0%) |
| 65 to 74 Years | 33 (7.8%) | 0 (0.0%) |
| 75 Years and over | 0 (0.0%) | 37 (6.8%) |
Disability Class: Cognitive Difficulty
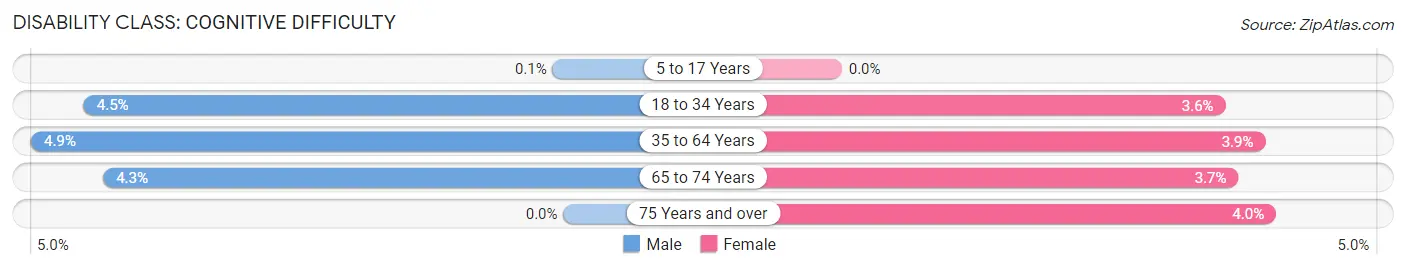
| Age Bracket | Male | Female |
| 5 to 17 Years | 1 (0.1%) | 0 (0.0%) |
| 18 to 34 Years | 54 (4.4%) | 36 (3.6%) |
| 35 to 64 Years | 107 (4.9%) | 92 (3.9%) |
| 65 to 74 Years | 18 (4.3%) | 19 (3.7%) |
| 75 Years and over | 0 (0.0%) | 22 (4.0%) |
Disability Class: Ambulatory Difficulty
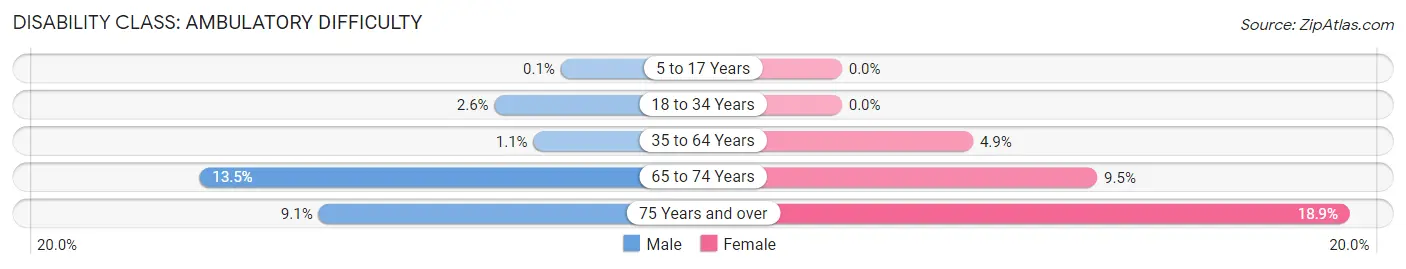
| Age Bracket | Male | Female |
| 5 to 17 Years | 1 (0.1%) | 0 (0.0%) |
| 18 to 34 Years | 31 (2.6%) | 0 (0.0%) |
| 35 to 64 Years | 24 (1.1%) | 114 (4.9%) |
| 65 to 74 Years | 57 (13.5%) | 49 (9.5%) |
| 75 Years and over | 26 (9.1%) | 103 (18.9%) |
Disability Class: Self-Care Difficulty
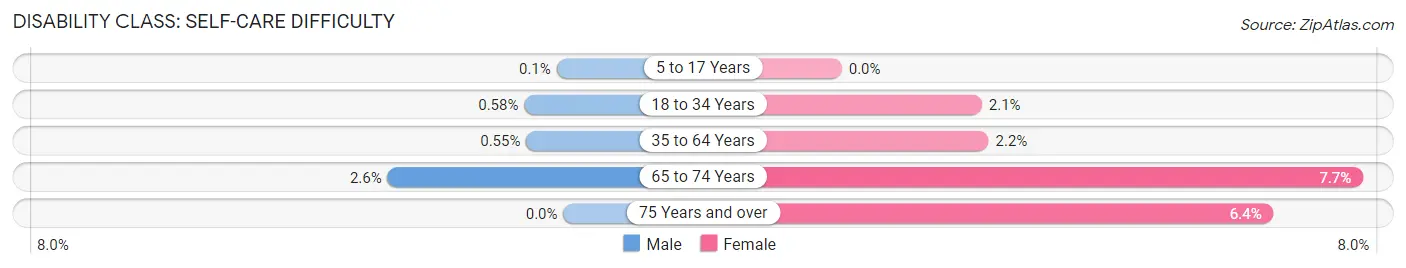
| Age Bracket | Male | Female |
| 5 to 17 Years | 1 (0.1%) | 0 (0.0%) |
| 18 to 34 Years | 7 (0.6%) | 21 (2.1%) |
| 35 to 64 Years | 12 (0.5%) | 51 (2.2%) |
| 65 to 74 Years | 11 (2.6%) | 40 (7.7%) |
| 75 Years and over | 0 (0.0%) | 35 (6.4%) |
Technology Access in Pompton Lakes borough
Computing Device Access in Pompton Lakes borough
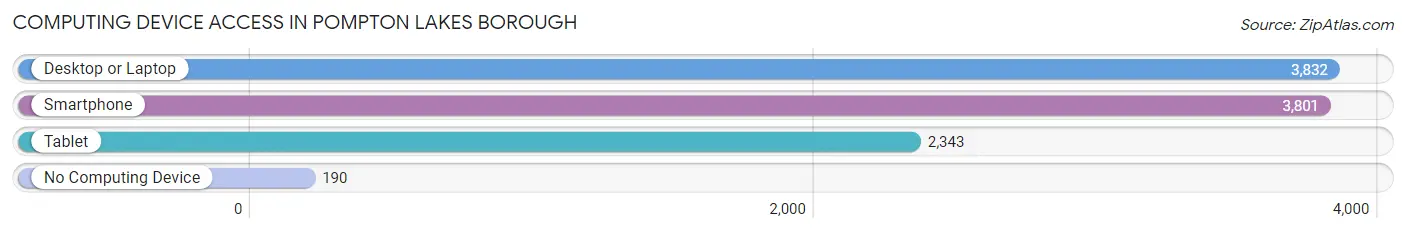
| Device Type | # Households | % Households |
| Desktop or Laptop | 3,832 | 90.7% |
| Smartphone | 3,801 | 89.9% |
| Tablet | 2,343 | 55.4% |
| No Computing Device | 190 | 4.5% |
| Total | 4,227 | 100.0% |
Internet Access in Pompton Lakes borough
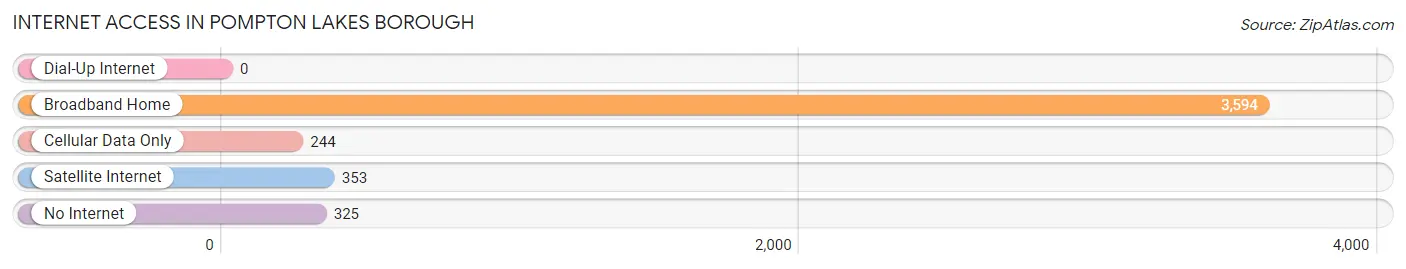
| Internet Type | # Households | % Households |
| Dial-Up Internet | 0 | 0.0% |
| Broadband Home | 3,594 | 85.0% |
| Cellular Data Only | 244 | 5.8% |
| Satellite Internet | 353 | 8.4% |
| No Internet | 325 | 7.7% |
| Total | 4,227 | 100.0% |
Pompton Lakes borough Summary
Pompton Lakes Borough is a small borough located in Passaic County, New Jersey. It is situated in the Ramapo Mountains and is part of the New York metropolitan area. The borough is bordered by the towns of Wanaque, Ringwood, and Wayne. The population of Pompton Lakes was 11,097 as of the 2010 census.
History
The area that is now Pompton Lakes was originally inhabited by the Lenape Native Americans. The first European settlers arrived in the area in the late 17th century. The area was part of the Ramapo Patent, which was granted to the Dutch in 1693. The area was then part of the Township of Pompton, which was established in 1797. In 1895, the Borough of Pompton Lakes was incorporated from portions of the Township of Pompton.
Geography
Pompton Lakes is located at 40°55'N 74°17'W (40.917, -74.283). The borough is situated in the Ramapo Mountains and is part of the New York metropolitan area. The borough is bordered by the towns of Wanaque, Ringwood, and Wayne. According to the United States Census Bureau, the borough has a total area of 3.2 square miles (8.3 km2), all of which is land.
Economy
Pompton Lakes is a small borough with a population of 11,097 as of the 2010 census. The borough is home to a variety of businesses, including retail stores, restaurants, and professional services. The borough is also home to several manufacturing companies, including a paper mill and a chemical plant.
Demographics
As of the 2010 census, there were 11,097 people, 4,072 households, and 2,845 families residing in the borough. The population density was 3,457.2 people per square mile (1,339.2/km2). The racial makeup of the borough was 87.2% White, 4.2% African American, 0.2% Native American, 4.3% Asian, 0.1% Pacific Islander, 1.7% from other races, and 2.3% from two or more races. Hispanic or Latino of any race were 8.2% of the population.
The median income for a household in the borough was $76,945, and the median income for a family was $90,945. Males had a median income of $60,945 versus $45,945 for females. The per capita income for the borough was $31,945. About 2.3% of families and 3.2% of the population were below the poverty line, including 4.2% of those under age 18 and 2.3% of those age 65 or over.
Common Questions
What is Per Capita Income in Pompton Lakes borough?
Per Capita income in Pompton Lakes borough is $51,422.
What is the Median Family Income in Pompton Lakes borough?
Median Family Income in Pompton Lakes borough is $132,281.
What is the Median Household income in Pompton Lakes borough?
Median Household Income in Pompton Lakes borough is $113,781.
What is Income or Wage Gap in Pompton Lakes borough?
Income or Wage Gap in Pompton Lakes borough is 21.2%.
Women in Pompton Lakes borough earn 78.8 cents for every dollar earned by a man.
What is Inequality or Gini Index in Pompton Lakes borough?
Inequality or Gini Index in Pompton Lakes borough is 0.36.
What is the Total Population of Pompton Lakes borough?
Total Population of Pompton Lakes borough is 11,052.
What is the Total Male Population of Pompton Lakes borough?
Total Male Population of Pompton Lakes borough is 5,470.
What is the Total Female Population of Pompton Lakes borough?
Total Female Population of Pompton Lakes borough is 5,582.
What is the Ratio of Males per 100 Females in Pompton Lakes borough?
There are 97.99 Males per 100 Females in Pompton Lakes borough.
What is the Ratio of Females per 100 Males in Pompton Lakes borough?
There are 102.05 Females per 100 Males in Pompton Lakes borough.
What is the Median Population Age in Pompton Lakes borough?
Median Population Age in Pompton Lakes borough is 39.1 Years.
What is the Average Family Size in Pompton Lakes borough
Average Family Size in Pompton Lakes borough is 3.1 People.
What is the Average Household Size in Pompton Lakes borough
Average Household Size in Pompton Lakes borough is 2.6 People.
How Large is the Labor Force in Pompton Lakes borough?
There are 6,530 People in the Labor Forcein in Pompton Lakes borough.
What is the Percentage of People in the Labor Force in Pompton Lakes borough?
73.8% of People are in the Labor Force in Pompton Lakes borough.
What is the Unemployment Rate in Pompton Lakes borough?
Unemployment Rate in Pompton Lakes borough is 3.8%.