Pitman borough, NJ Map & Demographics
Pitman borough Overview
$44,092
PER CAPITA INCOME
$116,302
AVG FAMILY INCOME
$91,566
AVG HOUSEHOLD INCOME
46.1%
WAGE / INCOME GAP [ % ]
53.9¢/ $1
WAGE / INCOME GAP [ $ ]
0.36
INEQUALITY / GINI INDEX
8,805
TOTAL POPULATION
4,075
MALE POPULATION
4,730
FEMALE POPULATION
86.15
MALES / 100 FEMALES
116.07
FEMALES / 100 MALES
43.4
MEDIAN AGE
3.0
AVG FAMILY SIZE
2.4
AVG HOUSEHOLD SIZE
4,927
LABOR FORCE [ PEOPLE ]
66.8%
PERCENT IN LABOR FORCE
6.6%
UNEMPLOYMENT RATE
Income in Pitman borough
Income Overview in Pitman borough
Per Capita Income in Pitman borough is $44,092, while median incomes of families and households are $116,302 and $91,566 respectively.
| Characteristic | Number | Measure |
| Per Capita Income | 8,805 | $44,092 |
| Median Family Income | 2,298 | $116,302 |
| Mean Family Income | 2,298 | $125,418 |
| Median Household Income | 3,670 | $91,566 |
| Mean Household Income | 3,670 | $102,328 |
| Income Deficit | 2,298 | $0 |
| Wage / Income Gap (%) | 8,805 | 46.13% |
| Wage / Income Gap ($) | 8,805 | 53.87¢ per $1 |
| Gini / Inequality Index | 8,805 | 0.36 |
Earnings by Sex in Pitman borough
Average Earnings in Pitman borough are $50,253, $63,804 for men and $34,369 for women, a difference of 46.1%.
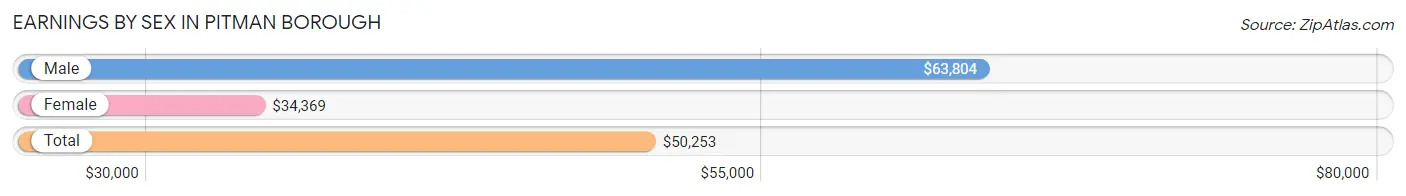
| Sex | Number | Average Earnings |
| Male | 2,296 (45.8%) | $63,804 |
| Female | 2,720 (54.2%) | $34,369 |
| Total | 5,016 (100.0%) | $50,253 |
Earnings by Sex by Income Bracket in Pitman borough
The most common earnings brackets in Pitman borough are $100,000+ for men (509 | 22.2%) and $30,000 to $34,999 for women (292 | 10.7%).
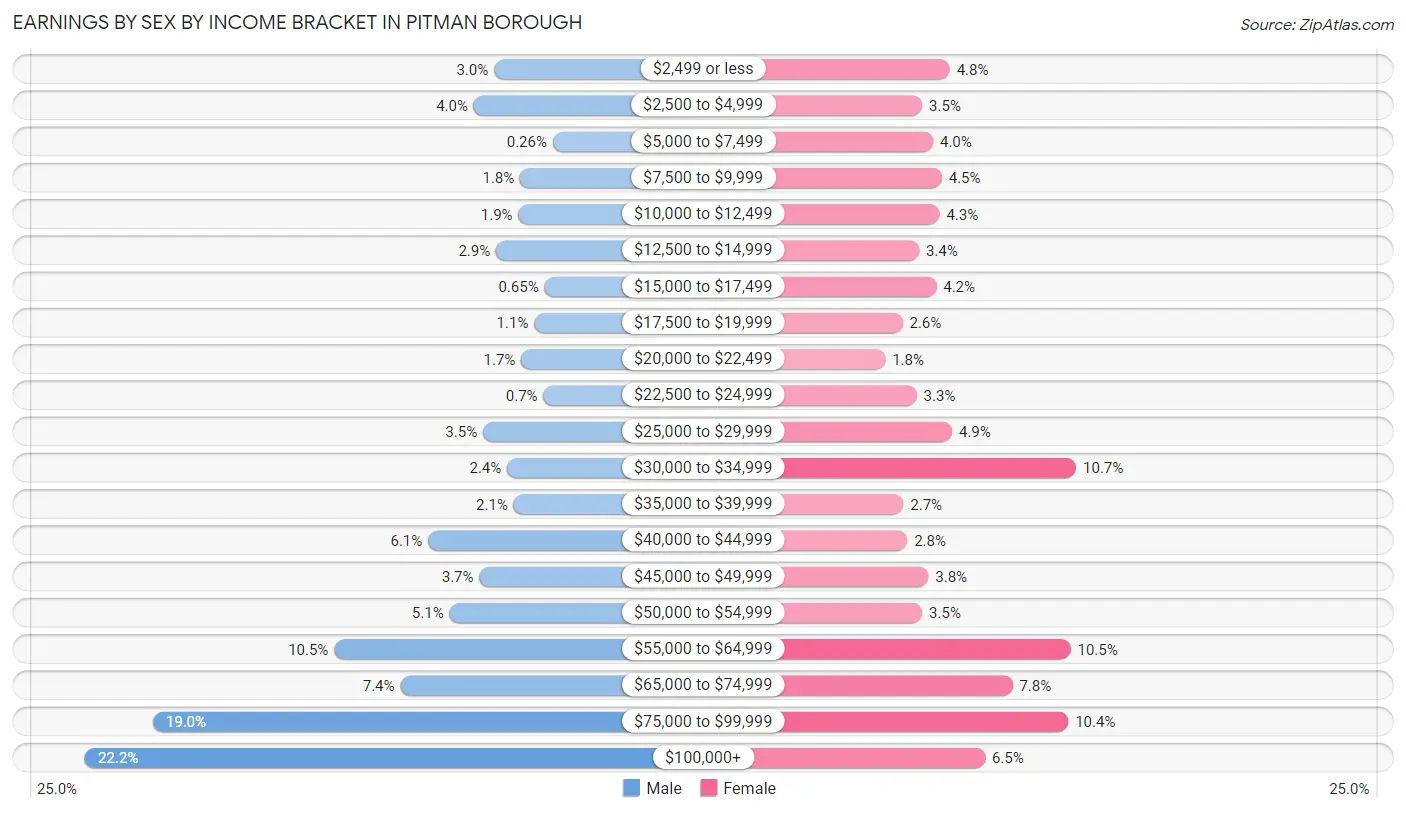
| Income | Male | Female |
| $2,499 or less | 69 (3.0%) | 131 (4.8%) |
| $2,500 to $4,999 | 91 (4.0%) | 96 (3.5%) |
| $5,000 to $7,499 | 6 (0.3%) | 110 (4.0%) |
| $7,500 to $9,999 | 41 (1.8%) | 121 (4.4%) |
| $10,000 to $12,499 | 43 (1.9%) | 118 (4.3%) |
| $12,500 to $14,999 | 67 (2.9%) | 92 (3.4%) |
| $15,000 to $17,499 | 15 (0.6%) | 114 (4.2%) |
| $17,500 to $19,999 | 26 (1.1%) | 71 (2.6%) |
| $20,000 to $22,499 | 40 (1.7%) | 49 (1.8%) |
| $22,500 to $24,999 | 16 (0.7%) | 89 (3.3%) |
| $25,000 to $29,999 | 81 (3.5%) | 134 (4.9%) |
| $30,000 to $34,999 | 55 (2.4%) | 292 (10.7%) |
| $35,000 to $39,999 | 48 (2.1%) | 72 (2.6%) |
| $40,000 to $44,999 | 140 (6.1%) | 77 (2.8%) |
| $45,000 to $49,999 | 85 (3.7%) | 104 (3.8%) |
| $50,000 to $54,999 | 117 (5.1%) | 96 (3.5%) |
| $55,000 to $64,999 | 241 (10.5%) | 285 (10.5%) |
| $65,000 to $74,999 | 170 (7.4%) | 211 (7.8%) |
| $75,000 to $99,999 | 436 (19.0%) | 282 (10.4%) |
| $100,000+ | 509 (22.2%) | 176 (6.5%) |
| Total | 2,296 (100.0%) | 2,720 (100.0%) |
Earnings by Sex by Educational Attainment in Pitman borough
Average earnings in Pitman borough are $70,813 for men and $43,277 for women, a difference of 38.9%. Men with an educational attainment of bachelor's degree enjoy the highest average annual earnings of $88,854, while those with less than high school education earn the least with $35,625. Women with an educational attainment of graduate degree earn the most with the average annual earnings of $70,536, while those with less than high school education have the smallest earnings of $11,023.
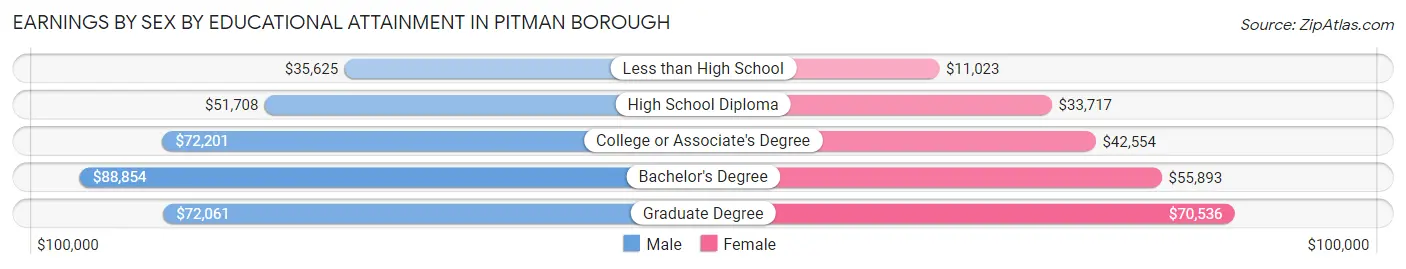
| Educational Attainment | Male Income | Female Income |
| Less than High School | $35,625 | $11,023 |
| High School Diploma | $51,708 | $33,717 |
| College or Associate's Degree | $72,201 | $42,554 |
| Bachelor's Degree | $88,854 | $55,893 |
| Graduate Degree | $72,061 | $70,536 |
| Total | $70,813 | $43,277 |
Family Income in Pitman borough
Family Income Brackets in Pitman borough
According to the Pitman borough family income data, there are 784 families falling into the $100,000 to $149,999 income range, which is the most common income bracket and makes up 34.1% of all families.
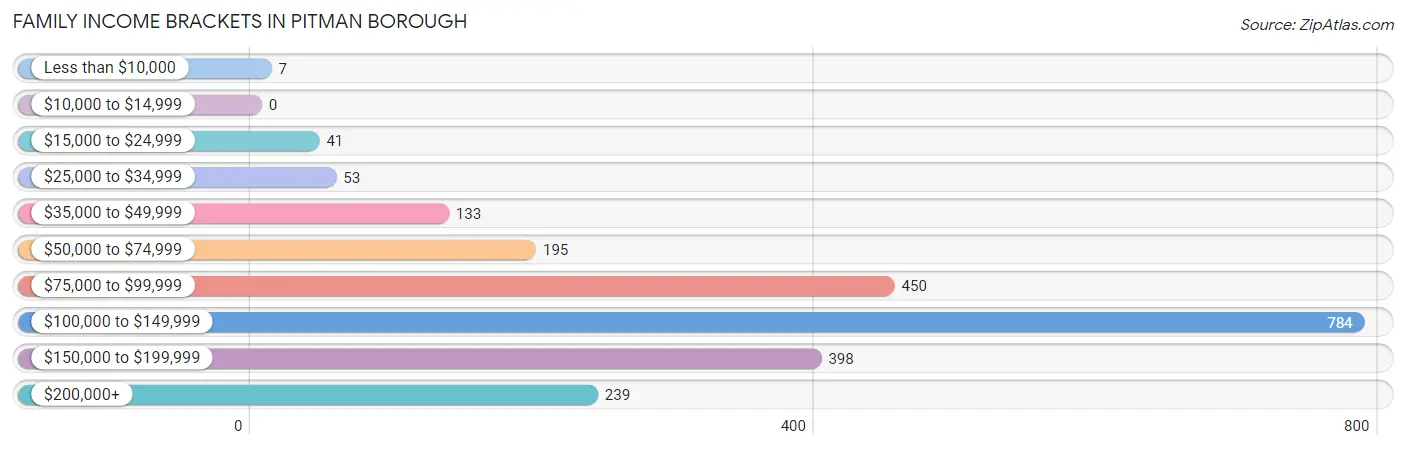
| Income Bracket | # Families | % Families |
| Less than $10,000 | 7 | 0.3% |
| $10,000 to $14,999 | 0 | 0.0% |
| $15,000 to $24,999 | 41 | 1.8% |
| $25,000 to $34,999 | 53 | 2.3% |
| $35,000 to $49,999 | 133 | 5.8% |
| $50,000 to $74,999 | 195 | 8.5% |
| $75,000 to $99,999 | 450 | 19.6% |
| $100,000 to $149,999 | 784 | 34.1% |
| $150,000 to $199,999 | 398 | 17.3% |
| $200,000+ | 239 | 10.4% |
Family Income by Famaliy Size in Pitman borough
5-person families (177 | 7.7%) account for the highest median family income in Pitman borough with $160,202 per family, while 2-person families (1,096 | 47.7%) have the highest median income of $53,125 per family member.
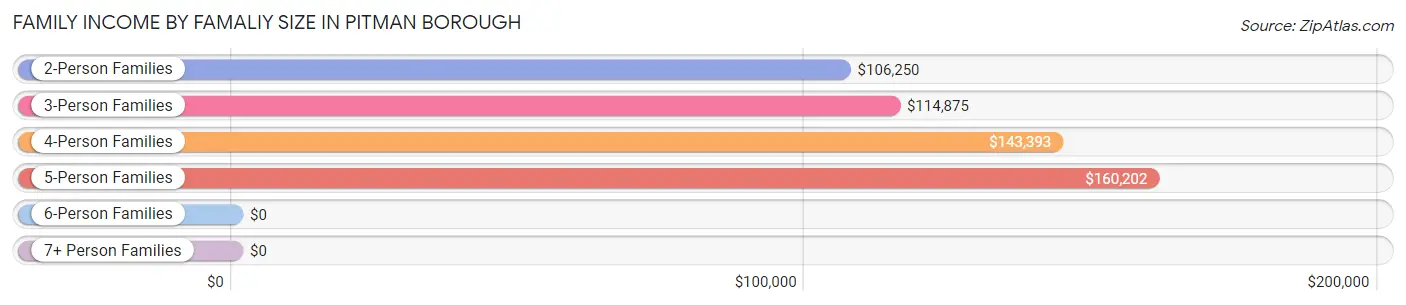
| Income Bracket | # Families | Median Income |
| 2-Person Families | 1,096 (47.7%) | $106,250 |
| 3-Person Families | 451 (19.6%) | $114,875 |
| 4-Person Families | 529 (23.0%) | $143,393 |
| 5-Person Families | 177 (7.7%) | $160,202 |
| 6-Person Families | 39 (1.7%) | $0 |
| 7+ Person Families | 6 (0.3%) | $0 |
| Total | 2,298 (100.0%) | $116,302 |
Family Income by Number of Earners in Pitman borough
The median family income in Pitman borough is $116,302, with families comprising 3+ earners (365) having the highest median family income of $161,908, while families with no earners (227) have the lowest median family income of $92,054, accounting for 15.9% and 9.9% of families, respectively.
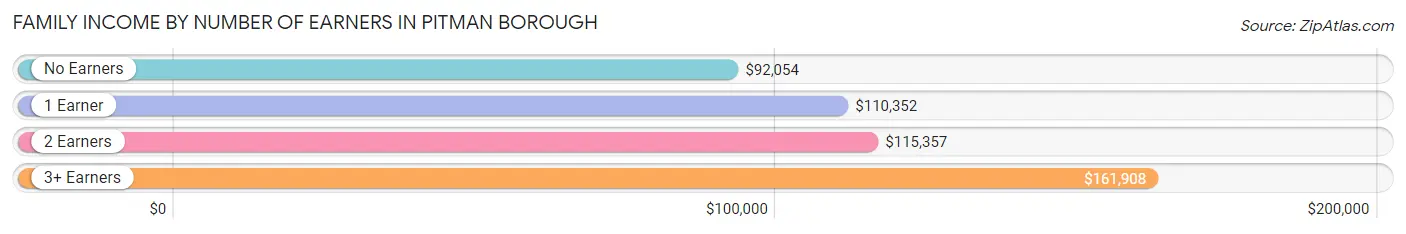
| Number of Earners | # Families | Median Income |
| No Earners | 227 (9.9%) | $92,054 |
| 1 Earner | 764 (33.3%) | $110,352 |
| 2 Earners | 942 (41.0%) | $115,357 |
| 3+ Earners | 365 (15.9%) | $161,908 |
| Total | 2,298 (100.0%) | $116,302 |
Household Income in Pitman borough
Household Income Brackets in Pitman borough
With 895 households falling in the category, the $100,000 to $149,999 income range is the most frequent in Pitman borough, accounting for 24.4% of all households. In contrast, only 29 households (0.8%) fall into the $10,000 to $14,999 income bracket, making it the least populous group.
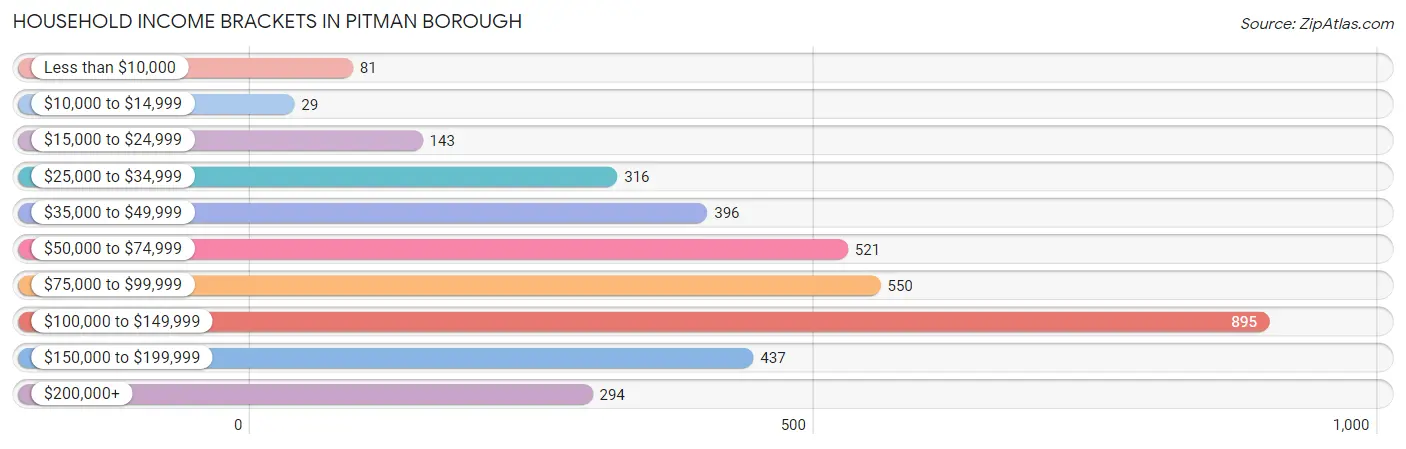
| Income Bracket | # Households | % Households |
| Less than $10,000 | 81 | 2.2% |
| $10,000 to $14,999 | 29 | 0.8% |
| $15,000 to $24,999 | 143 | 3.9% |
| $25,000 to $34,999 | 316 | 8.6% |
| $35,000 to $49,999 | 396 | 10.8% |
| $50,000 to $74,999 | 521 | 14.2% |
| $75,000 to $99,999 | 550 | 15.0% |
| $100,000 to $149,999 | 895 | 24.4% |
| $150,000 to $199,999 | 437 | 11.9% |
| $200,000+ | 294 | 8.0% |
Household Income by Householder Age in Pitman borough
The median household income in Pitman borough is $91,566, with the highest median household income of $110,101 found in the 45 to 64 years age bracket for the primary householder. A total of 1,377 households (37.5%) fall into this category. Meanwhile, the 65+ years age bracket for the primary householder has the lowest median household income of $59,565, with 1,184 households (32.3%) in this group.
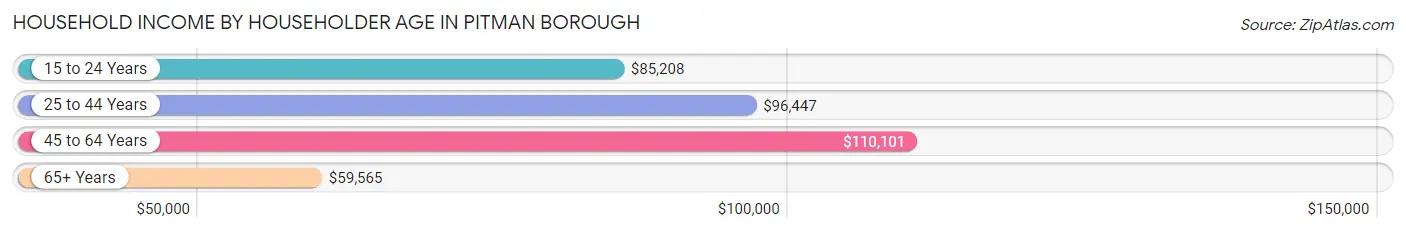
| Income Bracket | # Households | Median Income |
| 15 to 24 Years | 87 (2.4%) | $85,208 |
| 25 to 44 Years | 1,022 (27.9%) | $96,447 |
| 45 to 64 Years | 1,377 (37.5%) | $110,101 |
| 65+ Years | 1,184 (32.3%) | $59,565 |
| Total | 3,670 (100.0%) | $91,566 |
Poverty in Pitman borough
Income Below Poverty by Sex and Age in Pitman borough
With 4.6% poverty level for males and 4.6% for females among the residents of Pitman borough, 15 year old males and 12 to 14 year old females are the most vulnerable to poverty, with 37 males (77.1%) and 52 females (26.9%) in their respective age groups living below the poverty level.
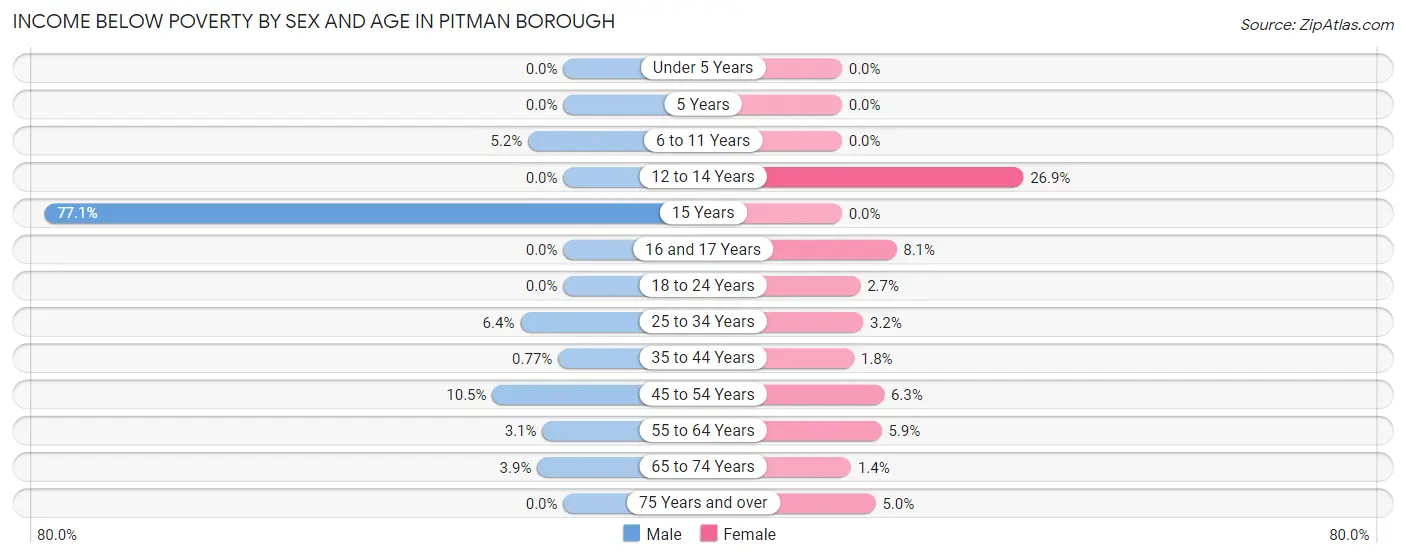
| Age Bracket | Male | Female |
| Under 5 Years | 0 (0.0%) | 0 (0.0%) |
| 5 Years | 0 (0.0%) | 0 (0.0%) |
| 6 to 11 Years | 19 (5.2%) | 0 (0.0%) |
| 12 to 14 Years | 0 (0.0%) | 52 (26.9%) |
| 15 Years | 37 (77.1%) | 0 (0.0%) |
| 16 and 17 Years | 0 (0.0%) | 11 (8.1%) |
| 18 to 24 Years | 0 (0.0%) | 11 (2.7%) |
| 25 to 34 Years | 37 (6.4%) | 19 (3.2%) |
| 35 to 44 Years | 4 (0.8%) | 10 (1.8%) |
| 45 to 54 Years | 51 (10.5%) | 36 (6.3%) |
| 55 to 64 Years | 19 (3.1%) | 43 (5.9%) |
| 65 to 74 Years | 18 (3.9%) | 7 (1.4%) |
| 75 Years and over | 0 (0.0%) | 28 (5.0%) |
| Total | 185 (4.6%) | 217 (4.6%) |
Income Above Poverty by Sex and Age in Pitman borough
According to the poverty statistics in Pitman borough, males aged under 5 years and females aged under 5 years are the age groups that are most secure financially, with 100.0% of males and 100.0% of females in these age groups living above the poverty line.
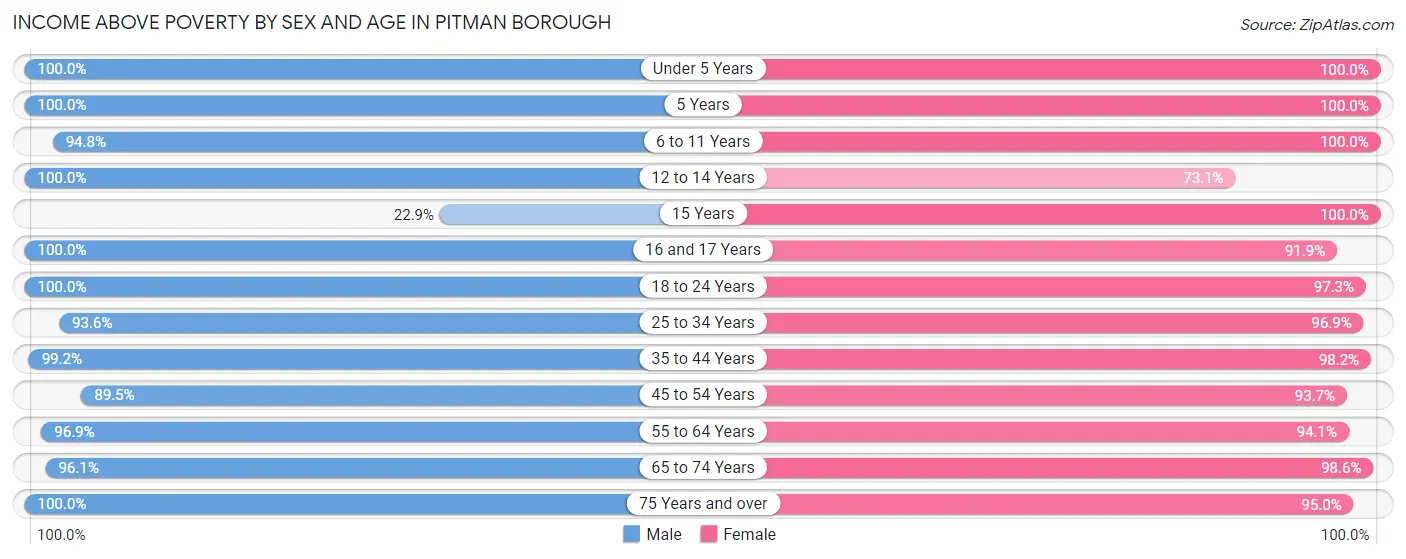
| Age Bracket | Male | Female |
| Under 5 Years | 226 (100.0%) | 120 (100.0%) |
| 5 Years | 11 (100.0%) | 30 (100.0%) |
| 6 to 11 Years | 344 (94.8%) | 239 (100.0%) |
| 12 to 14 Years | 190 (100.0%) | 141 (73.1%) |
| 15 Years | 11 (22.9%) | 9 (100.0%) |
| 16 and 17 Years | 101 (100.0%) | 125 (91.9%) |
| 18 to 24 Years | 247 (100.0%) | 392 (97.3%) |
| 25 to 34 Years | 541 (93.6%) | 584 (96.9%) |
| 35 to 44 Years | 516 (99.2%) | 550 (98.2%) |
| 45 to 54 Years | 433 (89.5%) | 539 (93.7%) |
| 55 to 64 Years | 589 (96.9%) | 686 (94.1%) |
| 65 to 74 Years | 446 (96.1%) | 507 (98.6%) |
| 75 Years and over | 183 (100.0%) | 532 (95.0%) |
| Total | 3,838 (95.4%) | 4,454 (95.4%) |
Income Below Poverty Among Married-Couple Families in Pitman borough
The poverty statistics for married-couple families in Pitman borough show that 1.9% or 35 of the total 1,798 families live below the poverty line. Families with 3 or 4 children have the highest poverty rate of 14.3%, comprising of 17 families. On the other hand, families with no children have the lowest poverty rate of 0.0%, which includes 0 families.
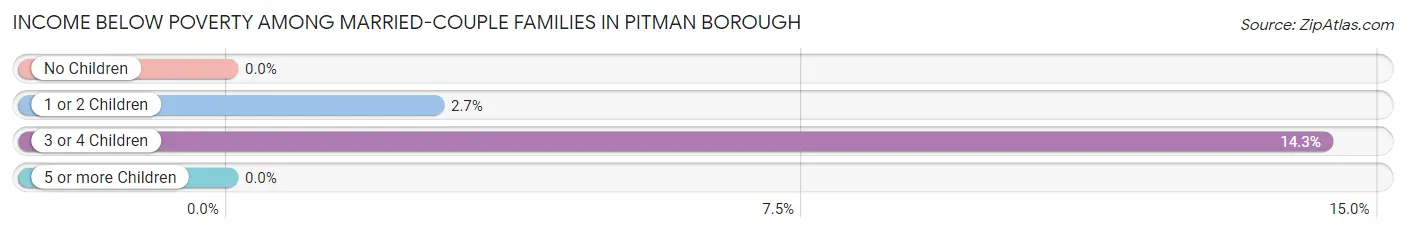
| Children | Above Poverty | Below Poverty |
| No Children | 1,009 (100.0%) | 0 (0.0%) |
| 1 or 2 Children | 652 (97.3%) | 18 (2.7%) |
| 3 or 4 Children | 102 (85.7%) | 17 (14.3%) |
| 5 or more Children | 0 (0.0%) | 0 (0.0%) |
| Total | 1,763 (98.1%) | 35 (1.9%) |
Income Below Poverty Among Single-Parent Households in Pitman borough
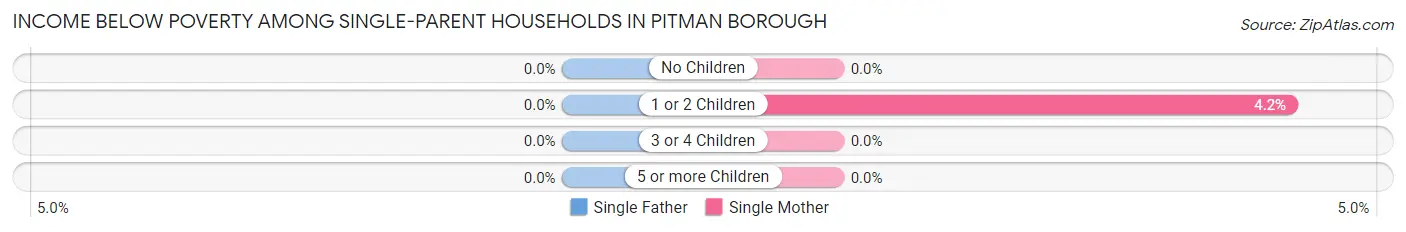
| Children | Single Father | Single Mother |
| No Children | 0 (0.0%) | 0 (0.0%) |
| 1 or 2 Children | 0 (0.0%) | 6 (4.2%) |
| 3 or 4 Children | 0 (0.0%) | 0 (0.0%) |
| 5 or more Children | 0 (0.0%) | 0 (0.0%) |
| Total | 0 (0.0%) | 6 (1.6%) |
Income Below Poverty Among Married-Couple vs Single-Parent Households in Pitman borough
The poverty data for Pitman borough shows that 35 of the married-couple family households (1.9%) and 6 of the single-parent households (1.2%) are living below the poverty level. Within the married-couple family households, those with 3 or 4 children have the highest poverty rate, with 17 households (14.3%) falling below the poverty line. Among the single-parent households, those with 1 or 2 children have the highest poverty rate, with 6 household (2.6%) living below poverty.
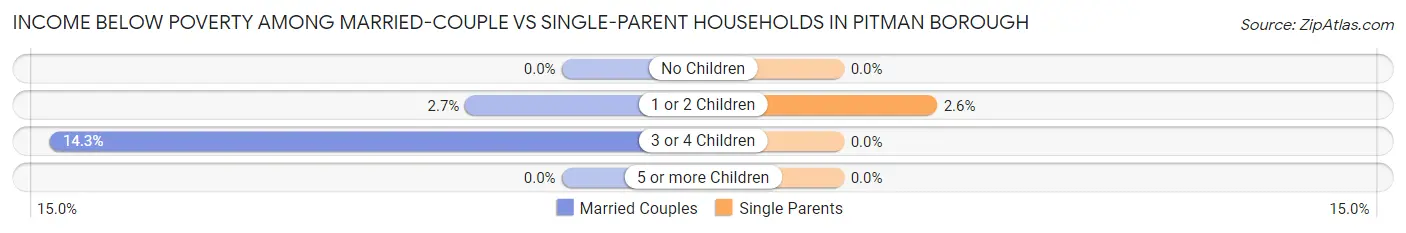
| Children | Married-Couple Families | Single-Parent Households |
| No Children | 0 (0.0%) | 0 (0.0%) |
| 1 or 2 Children | 18 (2.7%) | 6 (2.6%) |
| 3 or 4 Children | 17 (14.3%) | 0 (0.0%) |
| 5 or more Children | 0 (0.0%) | 0 (0.0%) |
| Total | 35 (1.9%) | 6 (1.2%) |
Race in Pitman borough
The most populous races in Pitman borough are White / Caucasian (8,332 | 94.6%), Hispanic or Latino (267 | 3.0%), and Black / African American (182 | 2.1%).
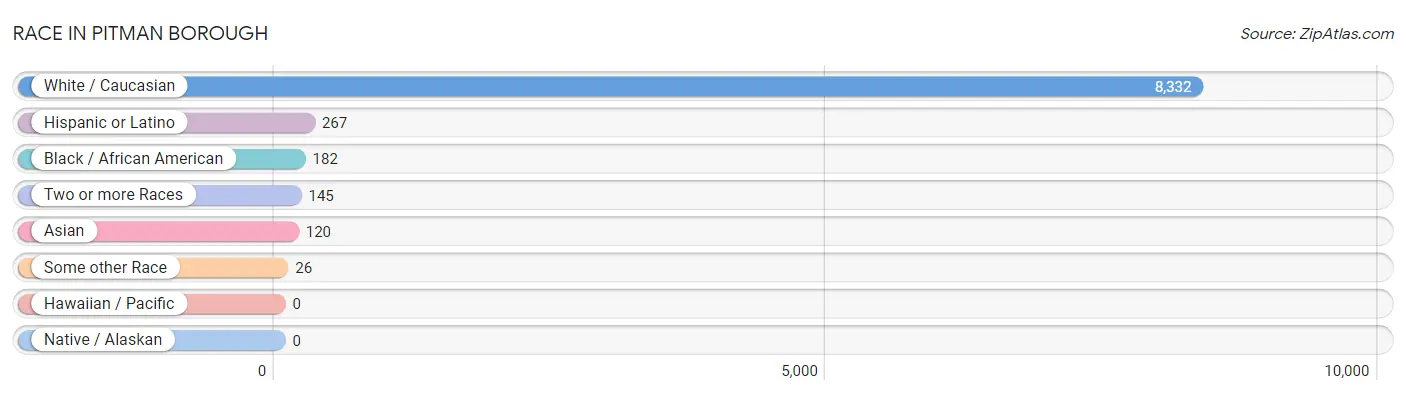
| Race | # Population | % Population |
| Asian | 120 | 1.4% |
| Black / African American | 182 | 2.1% |
| Hawaiian / Pacific | 0 | 0.0% |
| Hispanic or Latino | 267 | 3.0% |
| Native / Alaskan | 0 | 0.0% |
| White / Caucasian | 8,332 | 94.6% |
| Two or more Races | 145 | 1.7% |
| Some other Race | 26 | 0.3% |
| Total | 8,805 | 100.0% |
Ancestry in Pitman borough
The most populous ancestries reported in Pitman borough are Irish (2,566 | 29.1%), German (1,999 | 22.7%), Italian (1,765 | 20.1%), English (1,697 | 19.3%), and American (414 | 4.7%), together accounting for 95.9% of all Pitman borough residents.
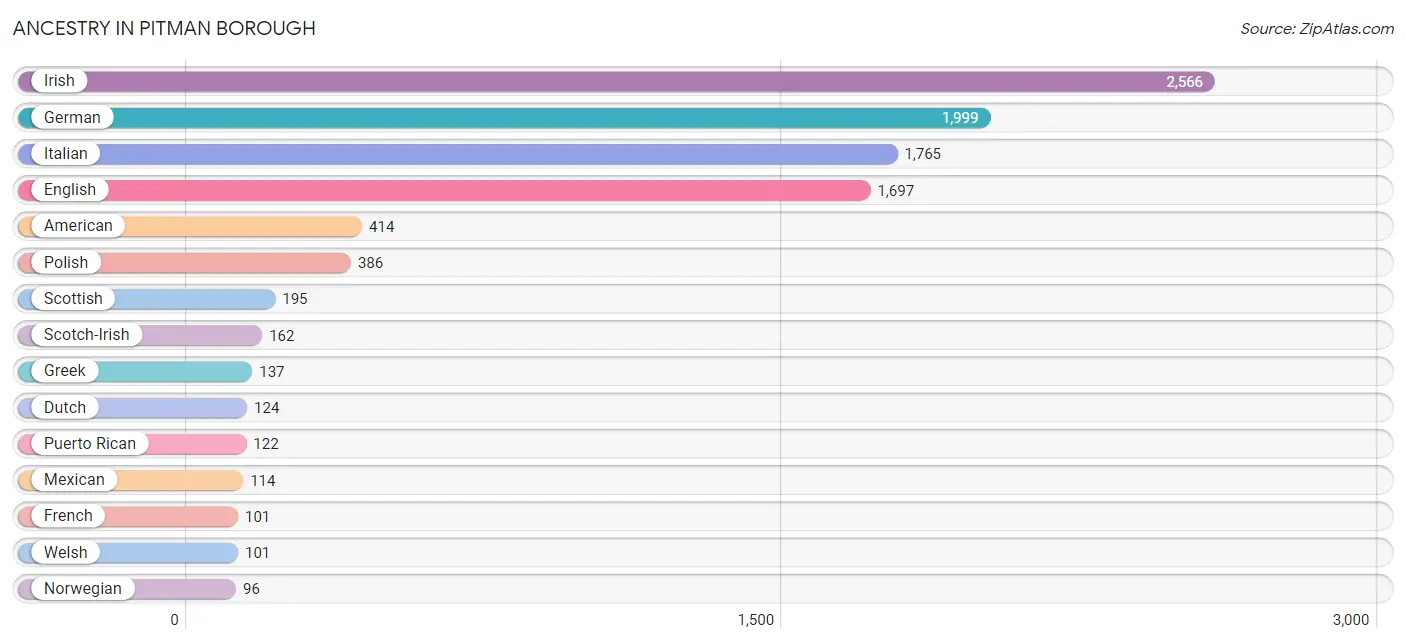
| Ancestry | # Population | % Population |
| American | 414 | 4.7% |
| Austrian | 14 | 0.2% |
| British | 77 | 0.9% |
| Canadian | 21 | 0.2% |
| Cherokee | 17 | 0.2% |
| Colombian | 10 | 0.1% |
| Croatian | 7 | 0.1% |
| Dutch | 124 | 1.4% |
| Eastern European | 55 | 0.6% |
| English | 1,697 | 19.3% |
| European | 50 | 0.6% |
| French | 101 | 1.1% |
| French Canadian | 12 | 0.1% |
| German | 1,999 | 22.7% |
| Greek | 137 | 1.6% |
| Hungarian | 29 | 0.3% |
| Iranian | 27 | 0.3% |
| Irish | 2,566 | 29.1% |
| Italian | 1,765 | 20.1% |
| Jamaican | 7 | 0.1% |
| Korean | 76 | 0.9% |
| Latvian | 31 | 0.4% |
| Lithuanian | 26 | 0.3% |
| Mexican | 114 | 1.3% |
| Norwegian | 96 | 1.1% |
| Pennsylvania German | 8 | 0.1% |
| Polish | 386 | 4.4% |
| Portuguese | 5 | 0.1% |
| Puerto Rican | 122 | 1.4% |
| Russian | 53 | 0.6% |
| Scotch-Irish | 162 | 1.8% |
| Scottish | 195 | 2.2% |
| Slavic | 7 | 0.1% |
| Slovak | 16 | 0.2% |
| South American | 10 | 0.1% |
| Spaniard | 21 | 0.2% |
| Swedish | 21 | 0.2% |
| Swiss | 35 | 0.4% |
| Thai | 62 | 0.7% |
| Turkish | 18 | 0.2% |
| Ukrainian | 86 | 1.0% |
| Welsh | 101 | 1.1% | View All 42 Rows |
Immigrants in Pitman borough
The most numerous immigrant groups reported in Pitman borough came from Canada (182 | 2.1%), Europe (116 | 1.3%), Asia (100 | 1.1%), Latin America (76 | 0.9%), and South America (67 | 0.8%), together accounting for 6.2% of all Pitman borough residents.
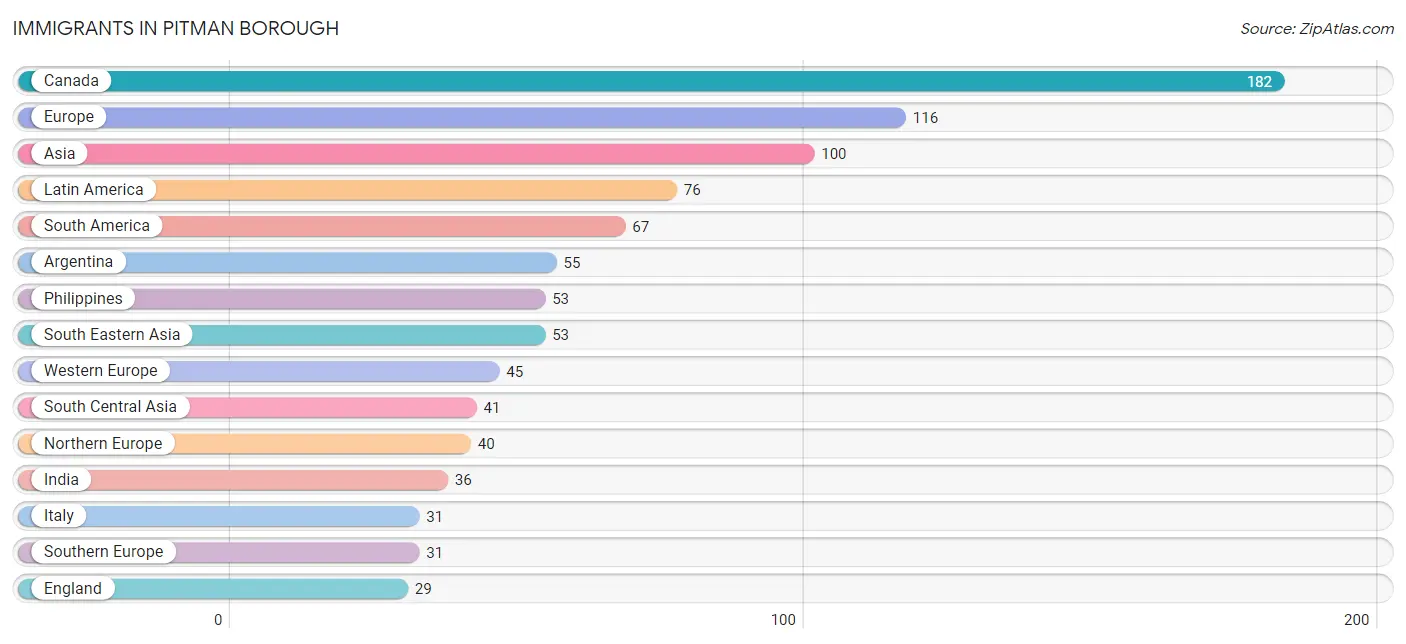
| Immigration Origin | # Population | % Population |
| Argentina | 55 | 0.6% |
| Asia | 100 | 1.1% |
| Australia | 3 | 0.0% |
| Brazil | 12 | 0.1% |
| Canada | 182 | 2.1% |
| Caribbean | 7 | 0.1% |
| Central America | 2 | 0.0% |
| England | 29 | 0.3% |
| Europe | 116 | 1.3% |
| Germany | 9 | 0.1% |
| India | 36 | 0.4% |
| Ireland | 5 | 0.1% |
| Italy | 31 | 0.4% |
| Jamaica | 7 | 0.1% |
| Latin America | 76 | 0.9% |
| Mexico | 2 | 0.0% |
| Netherlands | 9 | 0.1% |
| Northern Europe | 40 | 0.4% |
| Oceania | 3 | 0.0% |
| Pakistan | 5 | 0.1% |
| Philippines | 53 | 0.6% |
| Scotland | 6 | 0.1% |
| South America | 67 | 0.8% |
| South Central Asia | 41 | 0.5% |
| South Eastern Asia | 53 | 0.6% |
| Southern Europe | 31 | 0.4% |
| Switzerland | 27 | 0.3% |
| Turkey | 6 | 0.1% |
| Western Asia | 6 | 0.1% |
| Western Europe | 45 | 0.5% | View All 30 Rows |
Sex and Age in Pitman borough
Sex and Age in Pitman borough
The most populous age groups in Pitman borough are 60 to 64 Years (359 | 8.8%) for men and 25 to 29 Years (397 | 8.4%) for women.
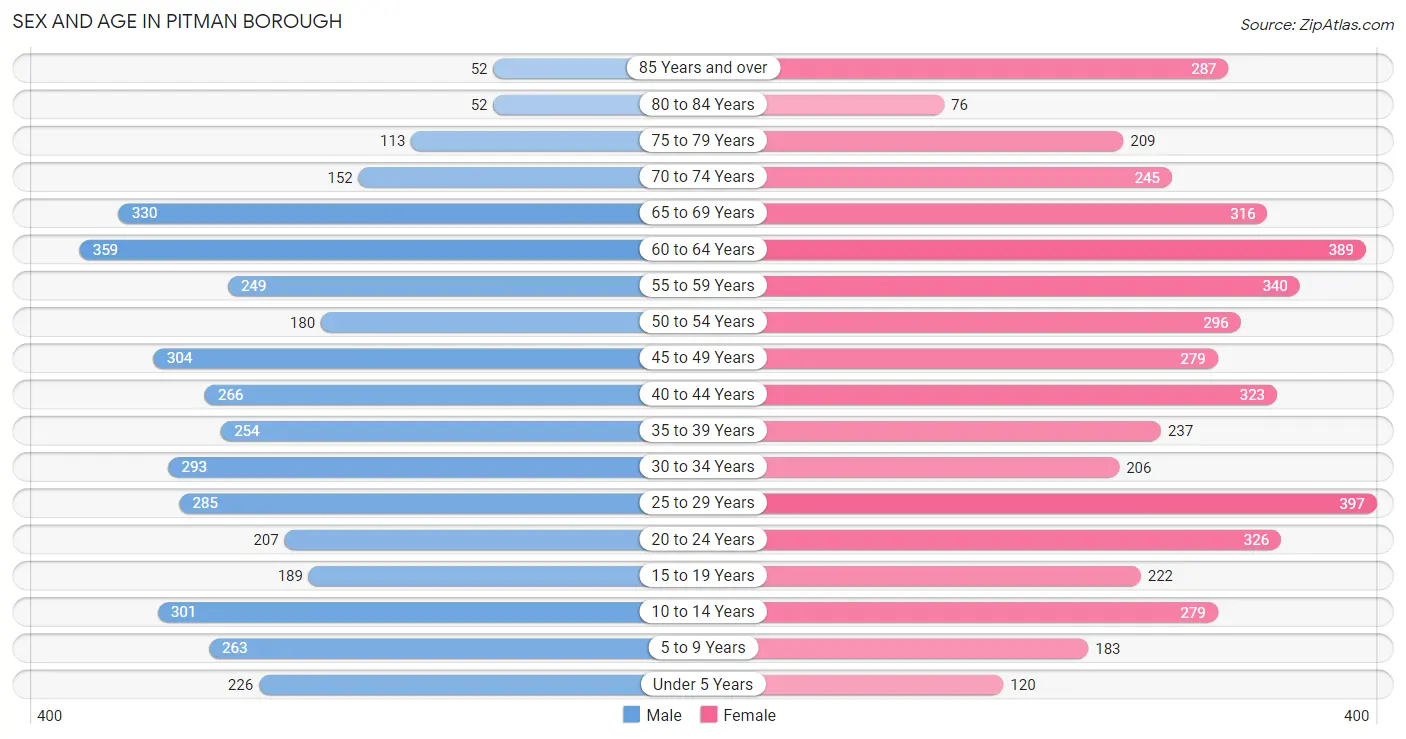
| Age Bracket | Male | Female |
| Under 5 Years | 226 (5.6%) | 120 (2.5%) |
| 5 to 9 Years | 263 (6.5%) | 183 (3.9%) |
| 10 to 14 Years | 301 (7.4%) | 279 (5.9%) |
| 15 to 19 Years | 189 (4.6%) | 222 (4.7%) |
| 20 to 24 Years | 207 (5.1%) | 326 (6.9%) |
| 25 to 29 Years | 285 (7.0%) | 397 (8.4%) |
| 30 to 34 Years | 293 (7.2%) | 206 (4.4%) |
| 35 to 39 Years | 254 (6.2%) | 237 (5.0%) |
| 40 to 44 Years | 266 (6.5%) | 323 (6.8%) |
| 45 to 49 Years | 304 (7.5%) | 279 (5.9%) |
| 50 to 54 Years | 180 (4.4%) | 296 (6.3%) |
| 55 to 59 Years | 249 (6.1%) | 340 (7.2%) |
| 60 to 64 Years | 359 (8.8%) | 389 (8.2%) |
| 65 to 69 Years | 330 (8.1%) | 316 (6.7%) |
| 70 to 74 Years | 152 (3.7%) | 245 (5.2%) |
| 75 to 79 Years | 113 (2.8%) | 209 (4.4%) |
| 80 to 84 Years | 52 (1.3%) | 76 (1.6%) |
| 85 Years and over | 52 (1.3%) | 287 (6.1%) |
| Total | 4,075 (100.0%) | 4,730 (100.0%) |
Families and Households in Pitman borough
Median Family Size in Pitman borough
The median family size in Pitman borough is 3.05 persons per family, with married-couple families (1,798 | 78.2%) accounting for the largest median family size of 3.2 persons per family. On the other hand, single female/mother families (382 | 16.6%) represent the smallest median family size with 2.40 persons per family.
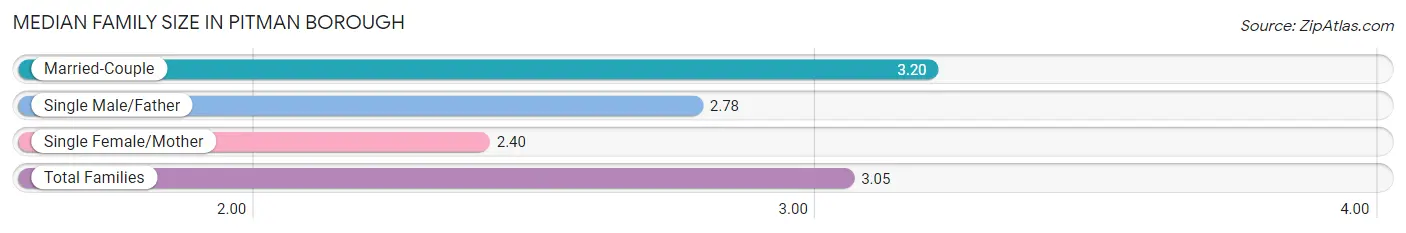
| Family Type | # Families | Family Size |
| Married-Couple | 1,798 (78.2%) | 3.20 |
| Single Male/Father | 118 (5.1%) | 2.78 |
| Single Female/Mother | 382 (16.6%) | 2.40 |
| Total Families | 2,298 (100.0%) | 3.05 |
Median Household Size in Pitman borough
The median household size in Pitman borough is 2.36 persons per household, with married-couple households (1,798 | 49.0%) accounting for the largest median household size of 3.21 persons per household. non-family households (1,372 | 37.4%) represent the smallest median household size with 1.14 persons per household.
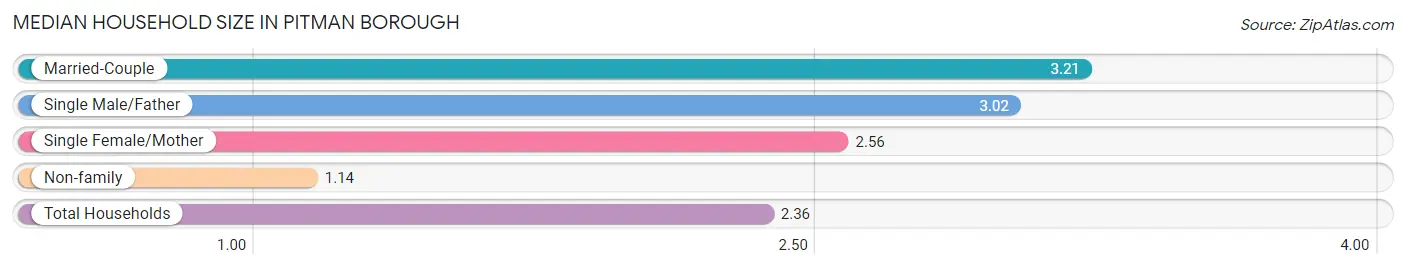
| Household Type | # Households | Household Size |
| Married-Couple | 1,798 (49.0%) | 3.21 |
| Single Male/Father | 118 (3.2%) | 3.02 |
| Single Female/Mother | 382 (10.4%) | 2.56 |
| Non-family | 1,372 (37.4%) | 1.14 |
| Total Households | 3,670 (100.0%) | 2.36 |
Household Size by Marriage Status in Pitman borough
Out of a total of 3,670 households in Pitman borough, 2,298 (62.6%) are family households, while 1,372 (37.4%) are nonfamily households. The most numerous type of family households are 2-person households, comprising 1,064, and the most common type of nonfamily households are 1-person households, comprising 1,186.
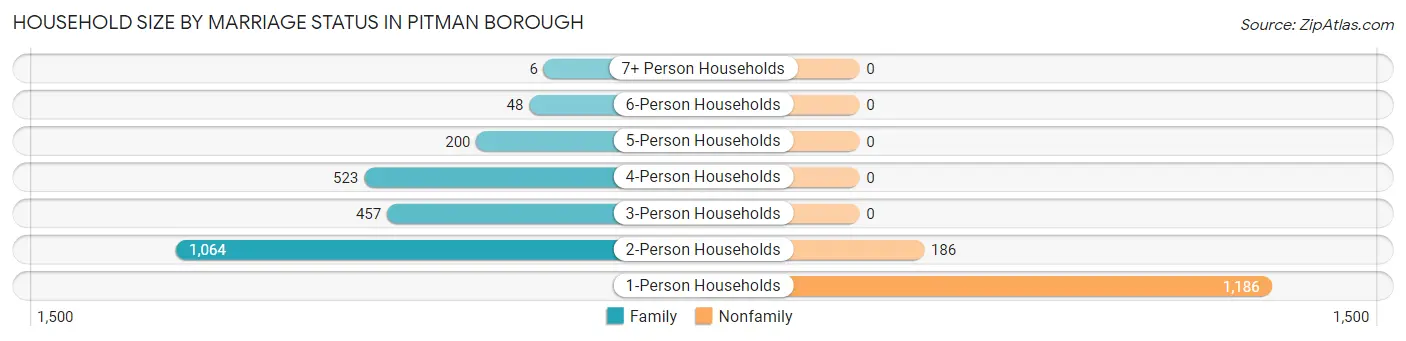
| Household Size | Family Households | Nonfamily Households |
| 1-Person Households | - | 1,186 (32.3%) |
| 2-Person Households | 1,064 (29.0%) | 186 (5.1%) |
| 3-Person Households | 457 (12.4%) | 0 (0.0%) |
| 4-Person Households | 523 (14.2%) | 0 (0.0%) |
| 5-Person Households | 200 (5.4%) | 0 (0.0%) |
| 6-Person Households | 48 (1.3%) | 0 (0.0%) |
| 7+ Person Households | 6 (0.2%) | 0 (0.0%) |
| Total | 2,298 (62.6%) | 1,372 (37.4%) |
Female Fertility in Pitman borough
Fertility by Age in Pitman borough
Average fertility rate in Pitman borough is 46.0 births per 1,000 women. Women in the age bracket of 20 to 34 years have the highest fertility rate with 55.0 births per 1,000 women. Women in the age bracket of 20 to 34 years acount for 54.3% of all women with births.
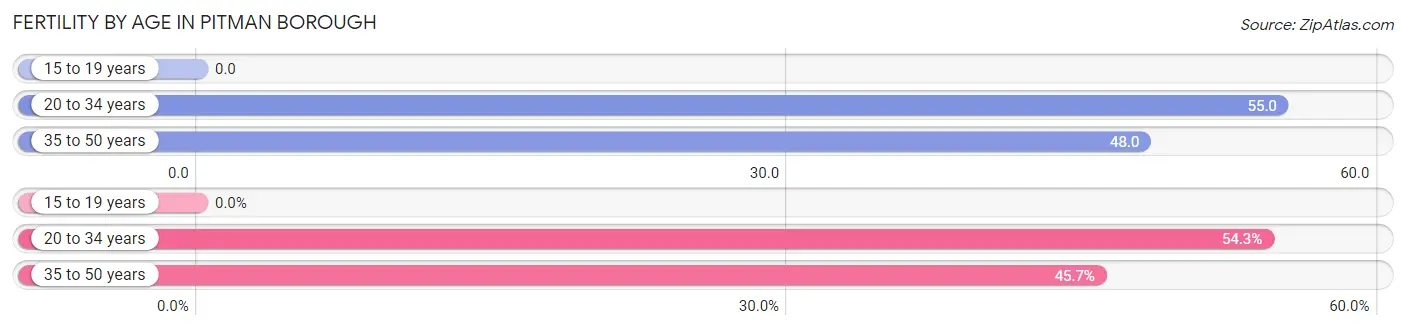
| Age Bracket | Women with Births | Births / 1,000 Women |
| 15 to 19 years | 0 (0.0%) | 0.0 |
| 20 to 34 years | 51 (54.3%) | 55.0 |
| 35 to 50 years | 43 (45.7%) | 48.0 |
| Total | 94 (100.0%) | 46.0 |
Fertility by Age by Marriage Status in Pitman borough
87.2% of women with births (94) in Pitman borough are married. The highest percentage of unmarried women with births falls into 20 to 34 years age bracket with 23.5% of them unmarried at the time of birth, while the lowest percentage of unmarried women with births belong to 35 to 50 years age bracket with 0.0% of them unmarried.
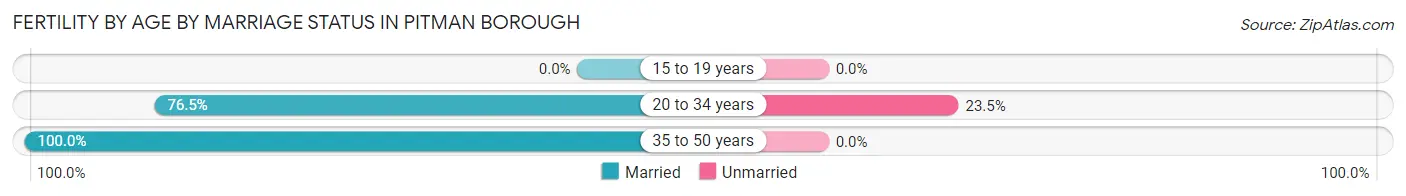
| Age Bracket | Married | Unmarried |
| 15 to 19 years | 0 (0.0%) | 0 (0.0%) |
| 20 to 34 years | 39 (76.5%) | 12 (23.5%) |
| 35 to 50 years | 43 (100.0%) | 0 (0.0%) |
| Total | 82 (87.2%) | 12 (12.8%) |
Fertility by Education in Pitman borough
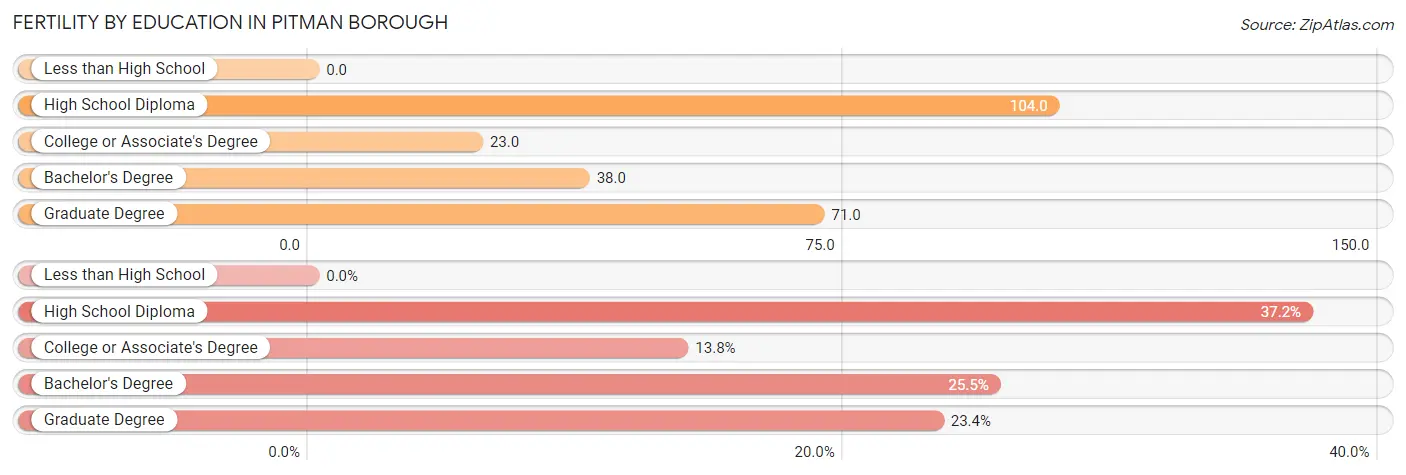
| Educational Attainment | Women with Births | Births / 1,000 Women |
| Less than High School | 0 (0.0%) | 0.0 |
| High School Diploma | 35 (37.2%) | 104.0 |
| College or Associate's Degree | 13 (13.8%) | 23.0 |
| Bachelor's Degree | 24 (25.5%) | 38.0 |
| Graduate Degree | 22 (23.4%) | 71.0 |
| Total | 94 (100.0%) | 46.0 |
Fertility by Education by Marriage Status in Pitman borough
12.8% of women with births in Pitman borough are unmarried. Women with the educational attainment of college or associate's degree are most likely to be married with 100.0% of them married at childbirth, while women with the educational attainment of high school diploma are least likely to be married with 34.3% of them unmarried at childbirth.
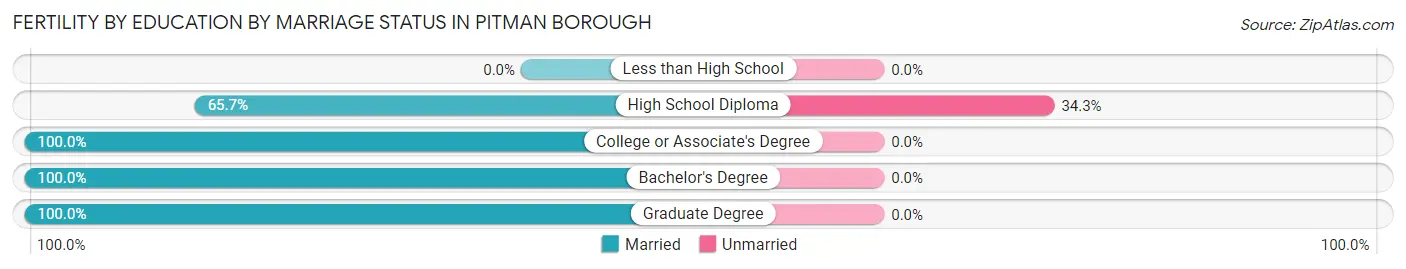
| Educational Attainment | Married | Unmarried |
| Less than High School | 0 (0.0%) | 0 (0.0%) |
| High School Diploma | 23 (65.7%) | 12 (34.3%) |
| College or Associate's Degree | 13 (100.0%) | 0 (0.0%) |
| Bachelor's Degree | 24 (100.0%) | 0 (0.0%) |
| Graduate Degree | 22 (100.0%) | 0 (0.0%) |
| Total | 82 (87.2%) | 12 (12.8%) |
Employment Characteristics in Pitman borough
Employment by Class of Employer in Pitman borough
Among the 4,524 employed individuals in Pitman borough, private company employees (2,755 | 60.9%), local government employees (592 | 13.1%), and not-for-profit organizations (536 | 11.8%) make up the most common classes of employment.
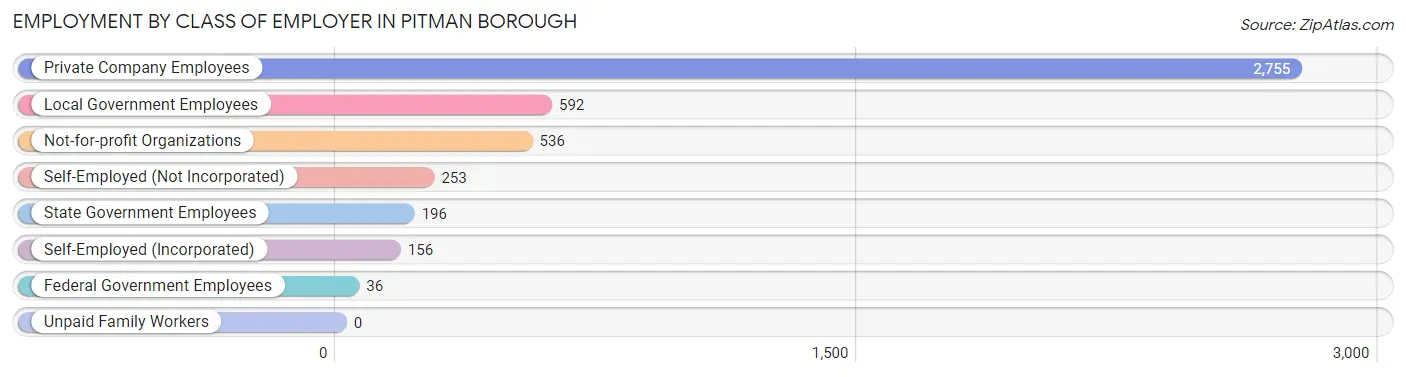
| Employer Class | # Employees | % Employees |
| Private Company Employees | 2,755 | 60.9% |
| Self-Employed (Incorporated) | 156 | 3.5% |
| Self-Employed (Not Incorporated) | 253 | 5.6% |
| Not-for-profit Organizations | 536 | 11.8% |
| Local Government Employees | 592 | 13.1% |
| State Government Employees | 196 | 4.3% |
| Federal Government Employees | 36 | 0.8% |
| Unpaid Family Workers | 0 | 0.0% |
| Total | 4,524 | 100.0% |
Employment Status by Age in Pitman borough
According to the labor force statistics for Pitman borough, out of the total population over 16 years of age (7,376), 66.8% or 4,927 individuals are in the labor force, with 6.6% or 325 of them unemployed. The age group with the highest labor force participation rate is 35 to 44 years, with 93.0% or 1,004 individuals in the labor force. Within the labor force, the 16 to 19 years age range has the highest percentage of unemployed individuals, with 27.6% or 58 of them being unemployed.
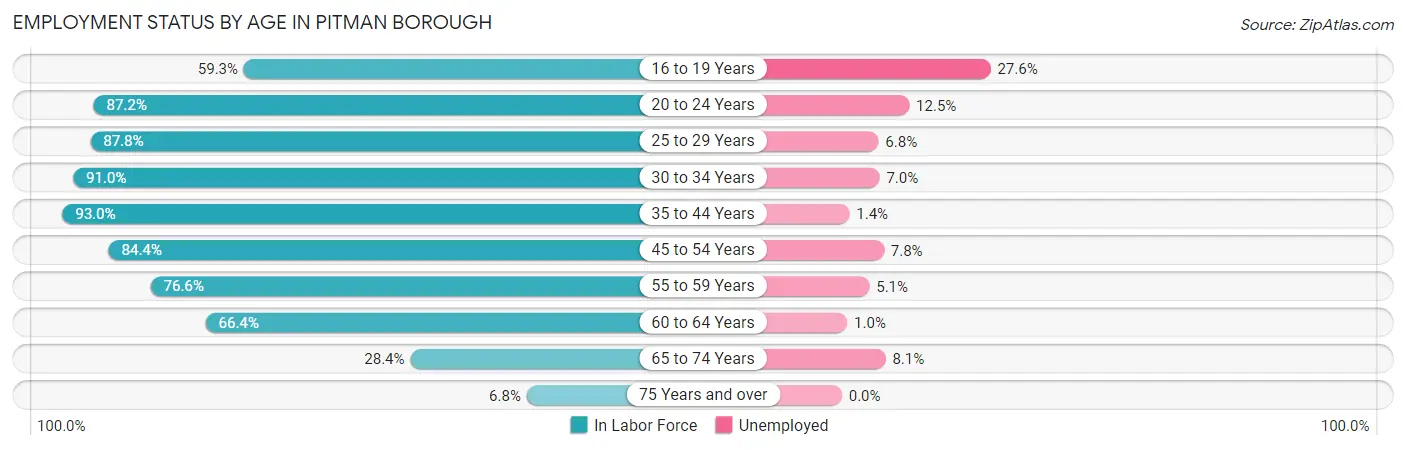
| Age Bracket | In Labor Force | Unemployed |
| 16 to 19 Years | 210 (59.3%) | 58 (27.6%) |
| 20 to 24 Years | 465 (87.2%) | 58 (12.5%) |
| 25 to 29 Years | 599 (87.8%) | 41 (6.8%) |
| 30 to 34 Years | 454 (91.0%) | 32 (7.0%) |
| 35 to 44 Years | 1,004 (93.0%) | 14 (1.4%) |
| 45 to 54 Years | 894 (84.4%) | 70 (7.8%) |
| 55 to 59 Years | 451 (76.6%) | 23 (5.1%) |
| 60 to 64 Years | 497 (66.4%) | 5 (1.0%) |
| 65 to 74 Years | 296 (28.4%) | 24 (8.1%) |
| 75 Years and over | 54 (6.8%) | 0 (0.0%) |
| Total | 4,927 (66.8%) | 325 (6.6%) |
Employment Status by Educational Attainment in Pitman borough
According to labor force statistics for Pitman borough, 83.7% of individuals (3,898) out of the total population between 25 and 64 years of age (4,657) are in the labor force, with 4.7% or 183 of them being unemployed. The group with the highest labor force participation rate are those with the educational attainment of bachelor's degree or higher, with 86.6% or 1,705 individuals in the labor force. Within the labor force, individuals with high school diploma education have the highest percentage of unemployment, with 9.1% or 86 of them being unemployed.
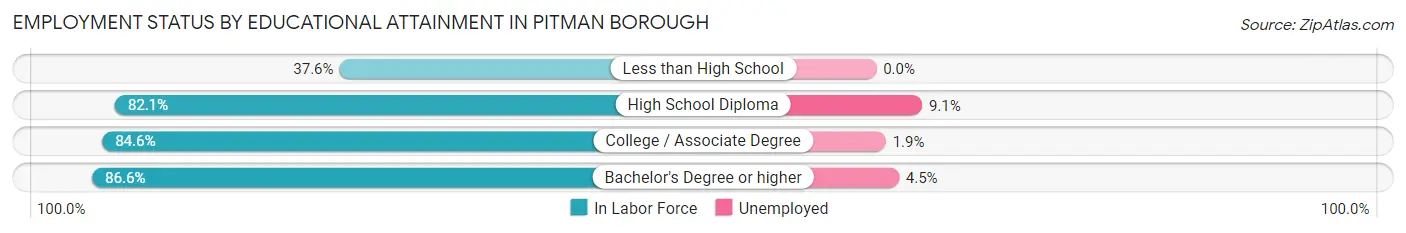
| Educational Attainment | In Labor Force | Unemployed |
| Less than High School | 41 (37.6%) | 0 (0.0%) |
| High School Diploma | 947 (82.1%) | 105 (9.1%) |
| College / Associate Degree | 1,206 (84.6%) | 27 (1.9%) |
| Bachelor's Degree or higher | 1,705 (86.6%) | 89 (4.5%) |
| Total | 3,898 (83.7%) | 219 (4.7%) |
Employment Occupations by Sex in Pitman borough
Management, Business, Science and Arts Occupations
The most common Management, Business, Science and Arts occupations in Pitman borough are Community & Social Service (922 | 20.1%), Education Instruction & Library (593 | 12.9%), Management (447 | 9.7%), Health Diagnosing & Treating (315 | 6.9%), and Computers, Engineering & Science (279 | 6.1%).
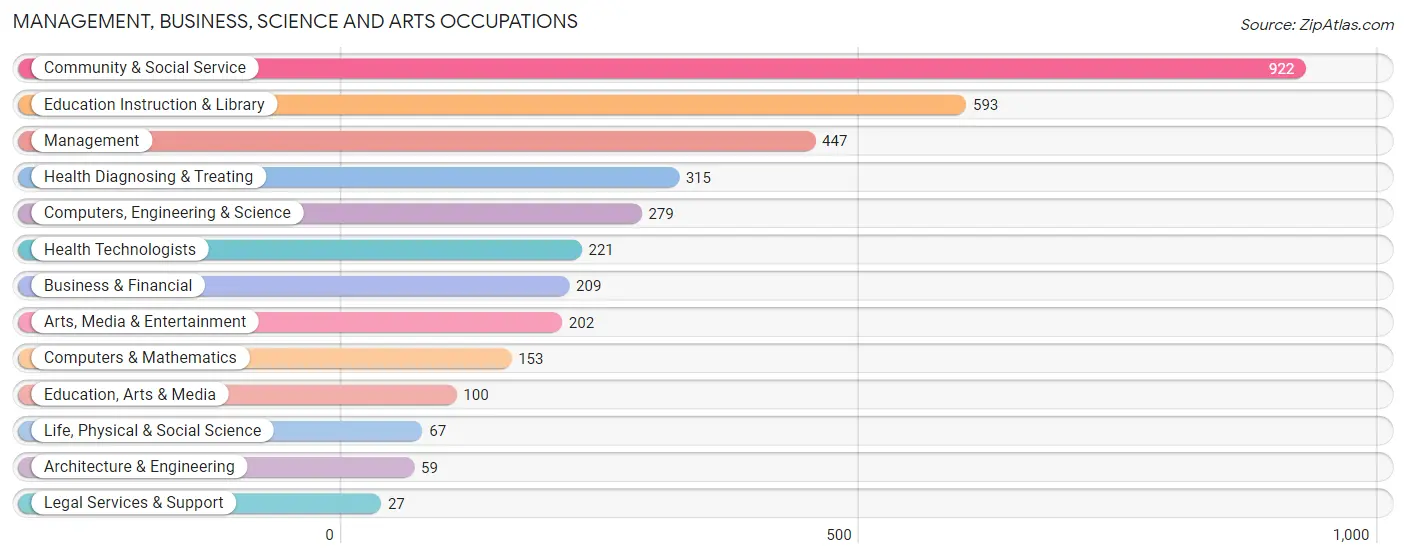
Management, Business, Science and Arts Occupations by Sex
Within the Management, Business, Science and Arts occupations in Pitman borough, the most male-oriented occupations are Architecture & Engineering (100.0%), Life, Physical & Social Science (85.1%), and Computers, Engineering & Science (81.0%), while the most female-oriented occupations are Education Instruction & Library (77.9%), Health Diagnosing & Treating (74.0%), and Community & Social Service (70.5%).
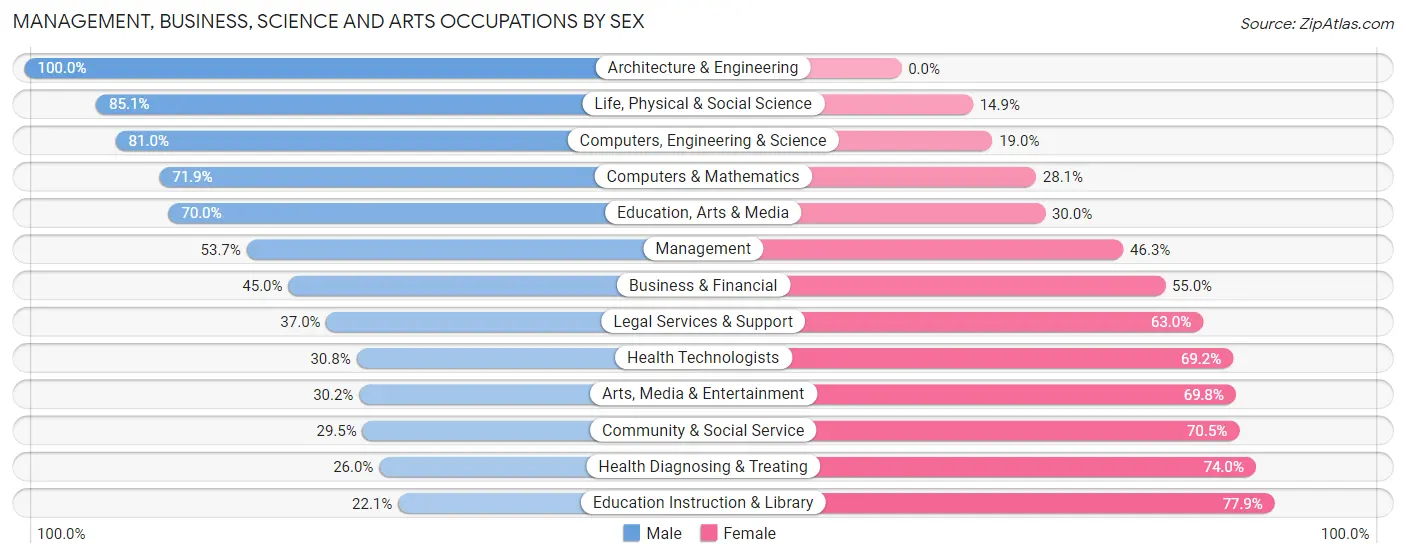
| Occupation | Male | Female |
| Management | 240 (53.7%) | 207 (46.3%) |
| Business & Financial | 94 (45.0%) | 115 (55.0%) |
| Computers, Engineering & Science | 226 (81.0%) | 53 (19.0%) |
| Computers & Mathematics | 110 (71.9%) | 43 (28.1%) |
| Architecture & Engineering | 59 (100.0%) | 0 (0.0%) |
| Life, Physical & Social Science | 57 (85.1%) | 10 (14.9%) |
| Community & Social Service | 272 (29.5%) | 650 (70.5%) |
| Education, Arts & Media | 70 (70.0%) | 30 (30.0%) |
| Legal Services & Support | 10 (37.0%) | 17 (63.0%) |
| Education Instruction & Library | 131 (22.1%) | 462 (77.9%) |
| Arts, Media & Entertainment | 61 (30.2%) | 141 (69.8%) |
| Health Diagnosing & Treating | 82 (26.0%) | 233 (74.0%) |
| Health Technologists | 68 (30.8%) | 153 (69.2%) |
| Total (Category) | 914 (42.1%) | 1,258 (57.9%) |
| Total (Overall) | 2,115 (46.0%) | 2,484 (54.0%) |
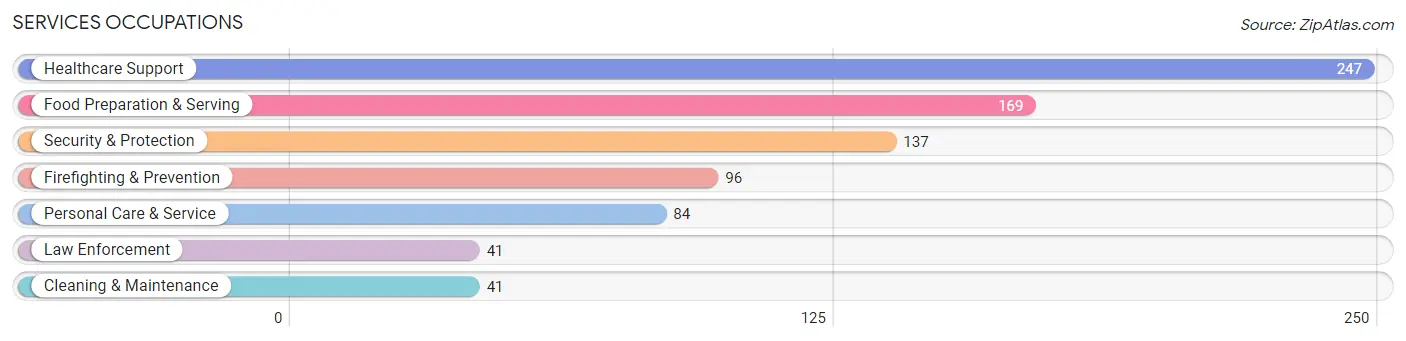
Services Occupations
The most common Services occupations in Pitman borough are Healthcare Support (247 | 5.4%), Food Preparation & Serving (169 | 3.7%), Security & Protection (137 | 3.0%), Firefighting & Prevention (96 | 2.1%), and Personal Care & Service (84 | 1.8%).
Services Occupations by Sex
Within the Services occupations in Pitman borough, the most male-oriented occupations are Law Enforcement (100.0%), Security & Protection (89.8%), and Firefighting & Prevention (85.4%), while the most female-oriented occupations are Healthcare Support (91.9%), Personal Care & Service (73.8%), and Food Preparation & Serving (45.6%).
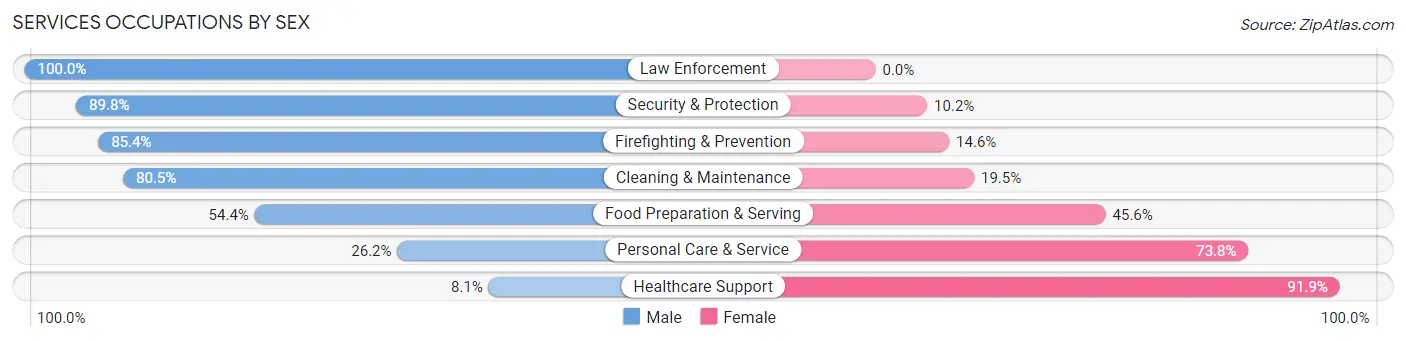
| Occupation | Male | Female |
| Healthcare Support | 20 (8.1%) | 227 (91.9%) |
| Security & Protection | 123 (89.8%) | 14 (10.2%) |
| Firefighting & Prevention | 82 (85.4%) | 14 (14.6%) |
| Law Enforcement | 41 (100.0%) | 0 (0.0%) |
| Food Preparation & Serving | 92 (54.4%) | 77 (45.6%) |
| Cleaning & Maintenance | 33 (80.5%) | 8 (19.5%) |
| Personal Care & Service | 22 (26.2%) | 62 (73.8%) |
| Total (Category) | 290 (42.8%) | 388 (57.2%) |
| Total (Overall) | 2,115 (46.0%) | 2,484 (54.0%) |
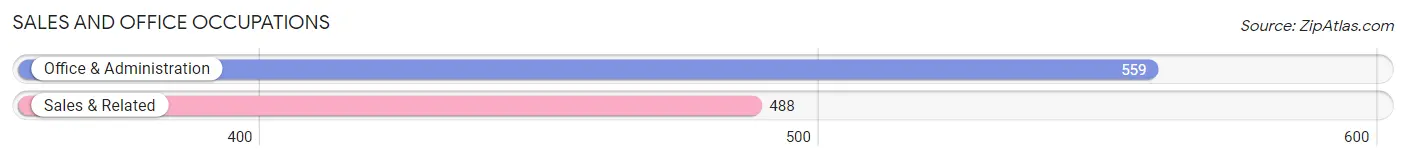
Sales and Office Occupations
The most common Sales and Office occupations in Pitman borough are Office & Administration (559 | 12.1%), and Sales & Related (488 | 10.6%).
Sales and Office Occupations by Sex
| Occupation | Male | Female |
| Sales & Related | 233 (47.7%) | 255 (52.2%) |
| Office & Administration | 122 (21.8%) | 437 (78.2%) |
| Total (Category) | 355 (33.9%) | 692 (66.1%) |
| Total (Overall) | 2,115 (46.0%) | 2,484 (54.0%) |
Natural Resources, Construction and Maintenance Occupations
The most common Natural Resources, Construction and Maintenance occupations in Pitman borough are Construction & Extraction (204 | 4.4%), Installation, Maintenance & Repair (104 | 2.3%), and Farming, Fishing & Forestry (7 | 0.2%).
Natural Resources, Construction and Maintenance Occupations by Sex
| Occupation | Male | Female |
| Farming, Fishing & Forestry | 0 (0.0%) | 7 (100.0%) |
| Construction & Extraction | 204 (100.0%) | 0 (0.0%) |
| Installation, Maintenance & Repair | 104 (100.0%) | 0 (0.0%) |
| Total (Category) | 308 (97.8%) | 7 (2.2%) |
| Total (Overall) | 2,115 (46.0%) | 2,484 (54.0%) |
Production, Transportation and Moving Occupations
The most common Production, Transportation and Moving occupations in Pitman borough are Production (161 | 3.5%), Transportation (120 | 2.6%), and Material Moving (106 | 2.3%).
Production, Transportation and Moving Occupations by Sex
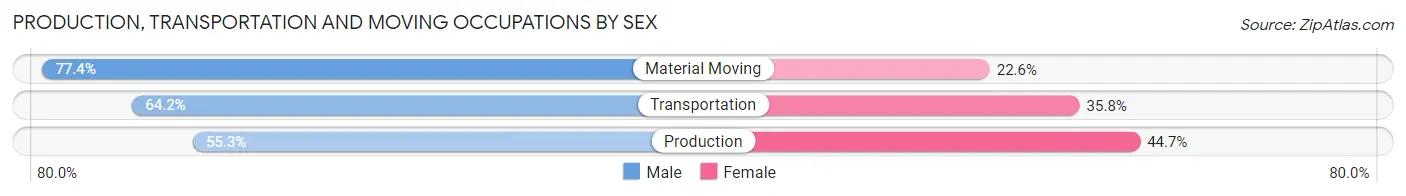
| Occupation | Male | Female |
| Production | 89 (55.3%) | 72 (44.7%) |
| Transportation | 77 (64.2%) | 43 (35.8%) |
| Material Moving | 82 (77.4%) | 24 (22.6%) |
| Total (Category) | 248 (64.1%) | 139 (35.9%) |
| Total (Overall) | 2,115 (46.0%) | 2,484 (54.0%) |
Employment Industries by Sex in Pitman borough
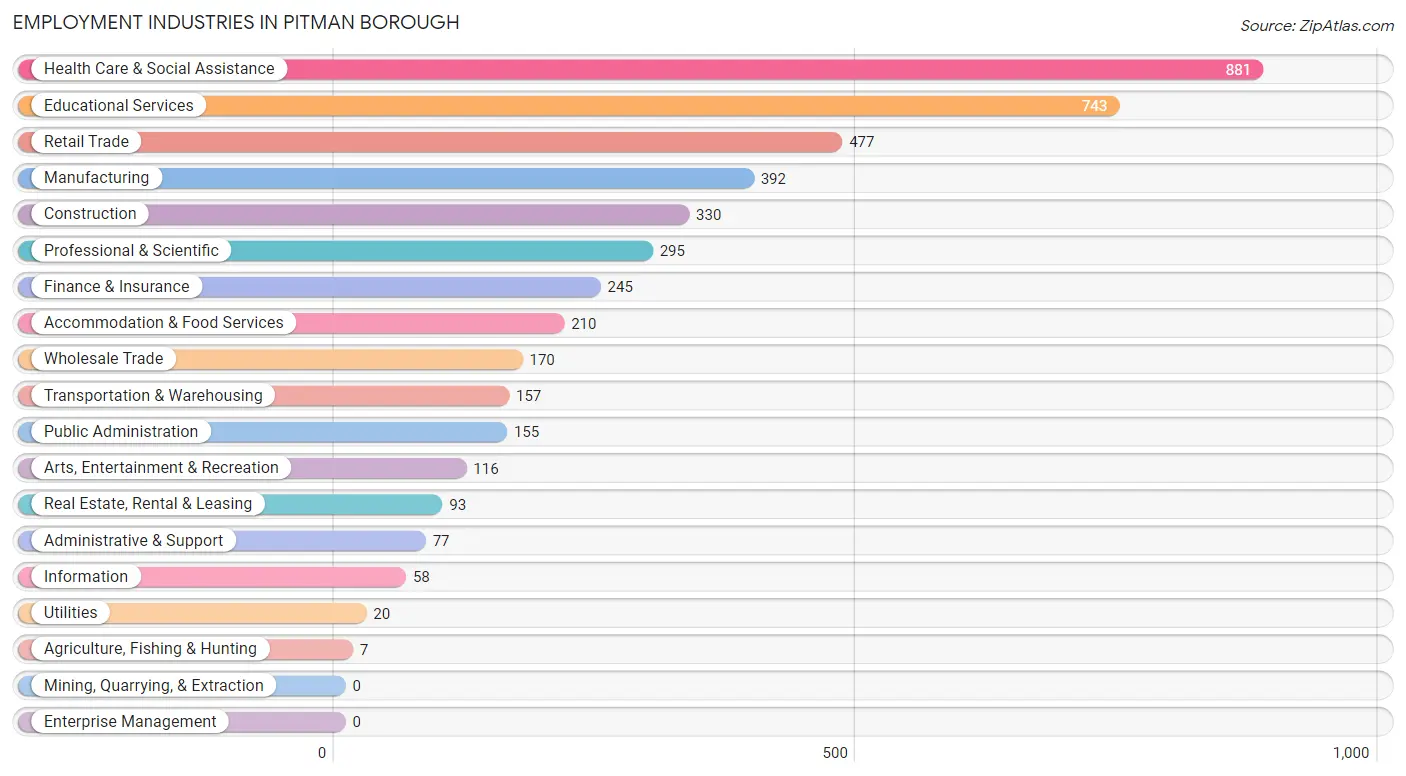
Employment Industries in Pitman borough
The major employment industries in Pitman borough include Health Care & Social Assistance (881 | 19.2%), Educational Services (743 | 16.2%), Retail Trade (477 | 10.4%), Manufacturing (392 | 8.5%), and Construction (330 | 7.2%).
Employment Industries by Sex in Pitman borough
The Pitman borough industries that see more men than women are Utilities (100.0%), Construction (98.5%), and Manufacturing (74.7%), whereas the industries that tend to have a higher number of women are Agriculture, Fishing & Hunting (100.0%), Educational Services (81.3%), and Health Care & Social Assistance (74.8%).
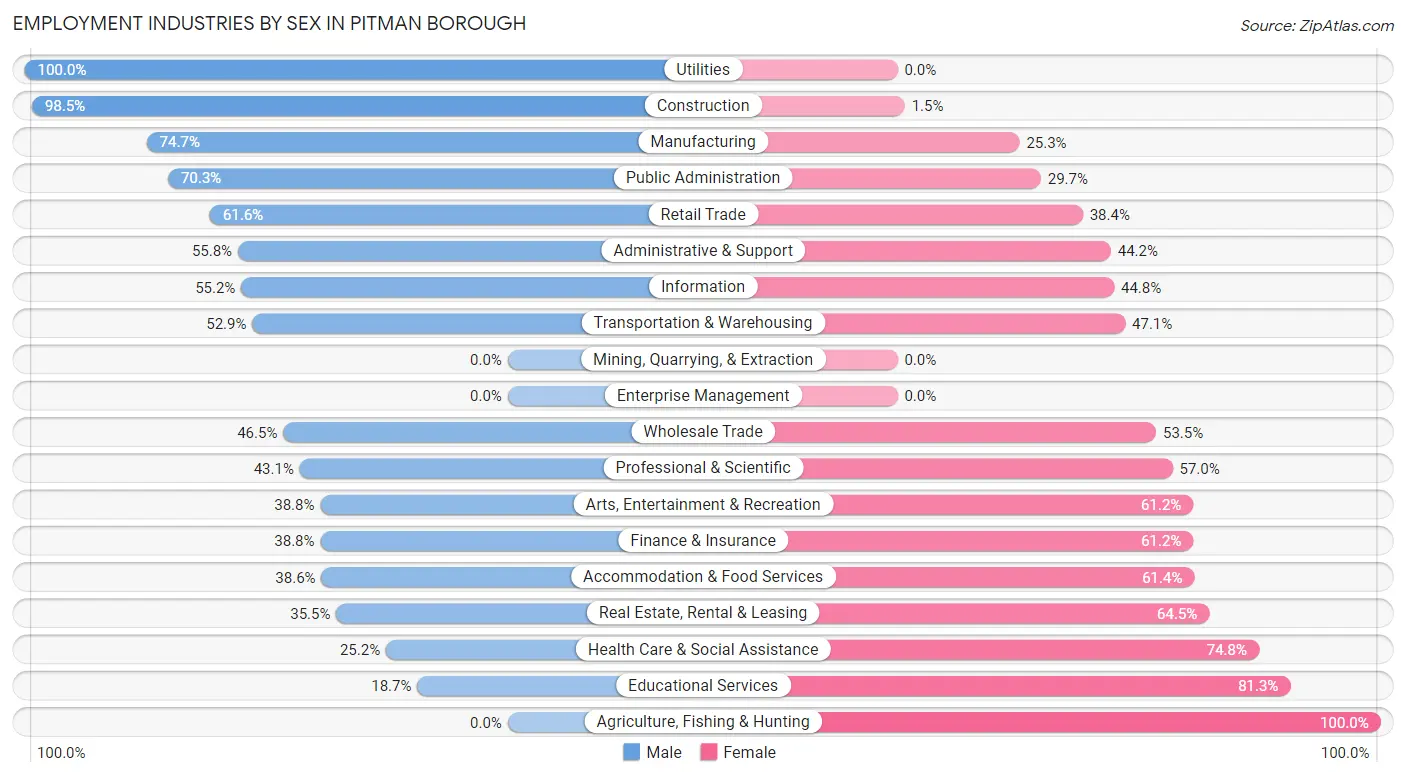
| Industry | Male | Female |
| Agriculture, Fishing & Hunting | 0 (0.0%) | 7 (100.0%) |
| Mining, Quarrying, & Extraction | 0 (0.0%) | 0 (0.0%) |
| Construction | 325 (98.5%) | 5 (1.5%) |
| Manufacturing | 293 (74.7%) | 99 (25.3%) |
| Wholesale Trade | 79 (46.5%) | 91 (53.5%) |
| Retail Trade | 294 (61.6%) | 183 (38.4%) |
| Transportation & Warehousing | 83 (52.9%) | 74 (47.1%) |
| Utilities | 20 (100.0%) | 0 (0.0%) |
| Information | 32 (55.2%) | 26 (44.8%) |
| Finance & Insurance | 95 (38.8%) | 150 (61.2%) |
| Real Estate, Rental & Leasing | 33 (35.5%) | 60 (64.5%) |
| Professional & Scientific | 127 (43.0%) | 168 (57.0%) |
| Enterprise Management | 0 (0.0%) | 0 (0.0%) |
| Administrative & Support | 43 (55.8%) | 34 (44.2%) |
| Educational Services | 139 (18.7%) | 604 (81.3%) |
| Health Care & Social Assistance | 222 (25.2%) | 659 (74.8%) |
| Arts, Entertainment & Recreation | 45 (38.8%) | 71 (61.2%) |
| Accommodation & Food Services | 81 (38.6%) | 129 (61.4%) |
| Public Administration | 109 (70.3%) | 46 (29.7%) |
| Total | 2,115 (46.0%) | 2,484 (54.0%) |
Education in Pitman borough
School Enrollment in Pitman borough
The most common levels of schooling among the 1,945 students in Pitman borough are college / undergraduate (437 | 22.5%), middle school (426 | 21.9%), and high school (391 | 20.1%).
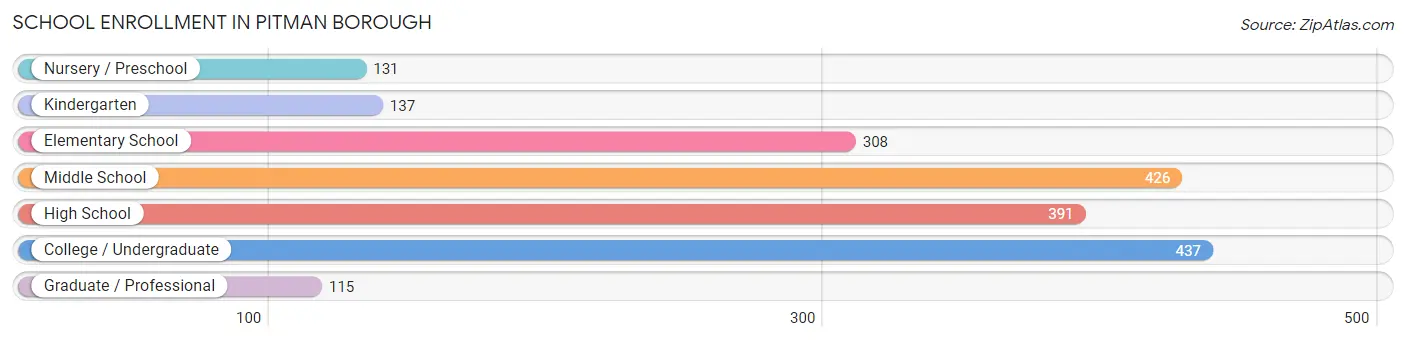
| School Level | # Students | % Students |
| Nursery / Preschool | 131 | 6.7% |
| Kindergarten | 137 | 7.0% |
| Elementary School | 308 | 15.8% |
| Middle School | 426 | 21.9% |
| High School | 391 | 20.1% |
| College / Undergraduate | 437 | 22.5% |
| Graduate / Professional | 115 | 5.9% |
| Total | 1,945 | 100.0% |
School Enrollment by Age by Funding Source in Pitman borough
Out of a total of 1,945 students who are enrolled in schools in Pitman borough, 270 (13.9%) attend a private institution, while the remaining 1,675 (86.1%) are enrolled in public schools. The age group of 3 to 4 year olds has the highest likelihood of being enrolled in private schools, with 50 (42.0% in the age bracket) enrolled. Conversely, the age group of 15 to 17 year olds has the lowest likelihood of being enrolled in a private school, with 276 (100.0% in the age bracket) attending a public institution.
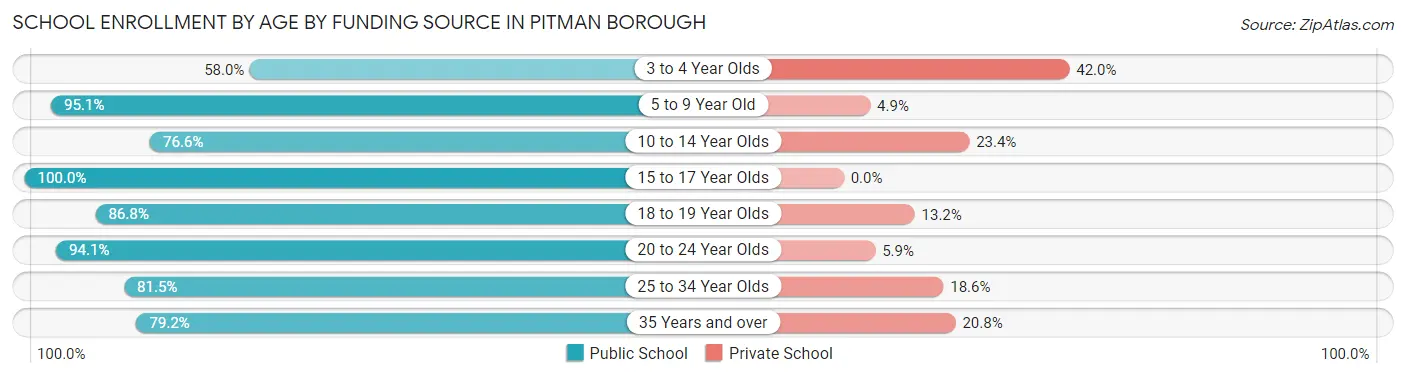
| Age Bracket | Public School | Private School |
| 3 to 4 Year Olds | 69 (58.0%) | 50 (42.0%) |
| 5 to 9 Year Old | 424 (95.1%) | 22 (4.9%) |
| 10 to 14 Year Olds | 390 (76.6%) | 119 (23.4%) |
| 15 to 17 Year Olds | 276 (100.0%) | 0 (0.0%) |
| 18 to 19 Year Olds | 92 (86.8%) | 14 (13.2%) |
| 20 to 24 Year Olds | 208 (94.1%) | 13 (5.9%) |
| 25 to 34 Year Olds | 101 (81.5%) | 23 (18.5%) |
| 35 Years and over | 114 (79.2%) | 30 (20.8%) |
| Total | 1,675 (86.1%) | 270 (13.9%) |
Educational Attainment by Field of Study in Pitman borough
Education (602 | 20.3%), business (472 | 16.0%), psychology (298 | 10.1%), science & technology (255 | 8.6%), and social sciences (253 | 8.6%) are the most common fields of study among 2,959 individuals in Pitman borough who have obtained a bachelor's degree or higher.
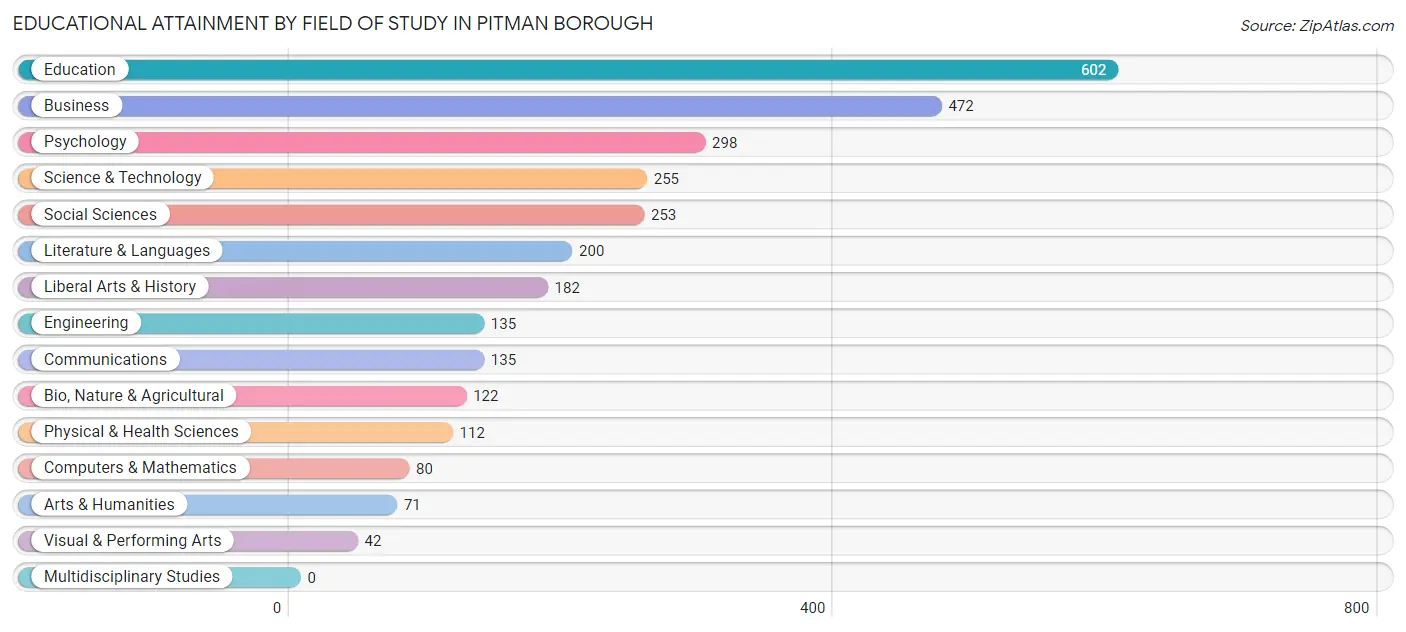
| Field of Study | # Graduates | % Graduates |
| Computers & Mathematics | 80 | 2.7% |
| Bio, Nature & Agricultural | 122 | 4.1% |
| Physical & Health Sciences | 112 | 3.8% |
| Psychology | 298 | 10.1% |
| Social Sciences | 253 | 8.6% |
| Engineering | 135 | 4.6% |
| Multidisciplinary Studies | 0 | 0.0% |
| Science & Technology | 255 | 8.6% |
| Business | 472 | 16.0% |
| Education | 602 | 20.3% |
| Literature & Languages | 200 | 6.8% |
| Liberal Arts & History | 182 | 6.1% |
| Visual & Performing Arts | 42 | 1.4% |
| Communications | 135 | 4.6% |
| Arts & Humanities | 71 | 2.4% |
| Total | 2,959 | 100.0% |
Transportation & Commute in Pitman borough
Vehicle Availability by Sex in Pitman borough
The most prevalent vehicle ownership categories in Pitman borough are males with 2 vehicles (1,080, accounting for 51.2%) and females with 2 vehicles (1,115, making up 44.8%).
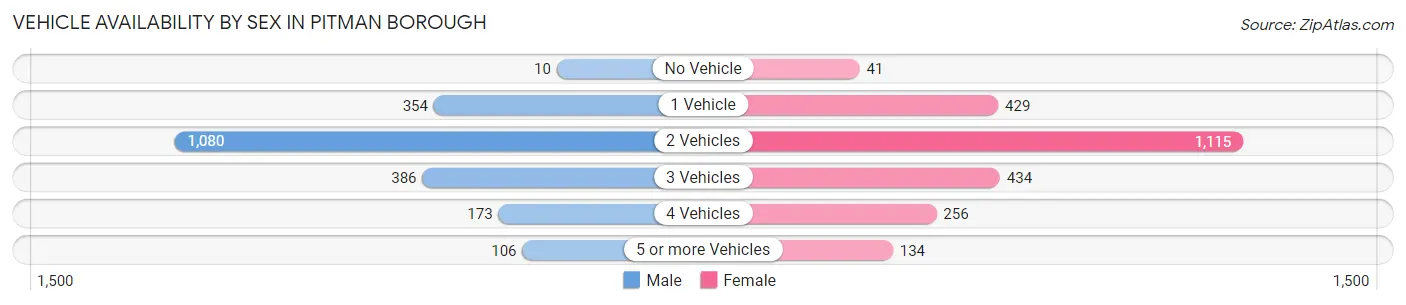
| Vehicles Available | Male | Female |
| No Vehicle | 10 (0.5%) | 41 (1.7%) |
| 1 Vehicle | 354 (16.8%) | 429 (17.8%) |
| 2 Vehicles | 1,080 (51.2%) | 1,115 (46.3%) |
| 3 Vehicles | 386 (18.3%) | 434 (18.0%) |
| 4 Vehicles | 173 (8.2%) | 256 (10.6%) |
| 5 or more Vehicles | 106 (5.0%) | 134 (5.6%) |
| Total | 2,109 (100.0%) | 2,409 (100.0%) |
Commute Time in Pitman borough
The most frequently occuring commute durations in Pitman borough are 15 to 19 minutes (584 commuters, 14.6%), 10 to 14 minutes (493 commuters, 12.4%), and 30 to 34 minutes (490 commuters, 12.3%).
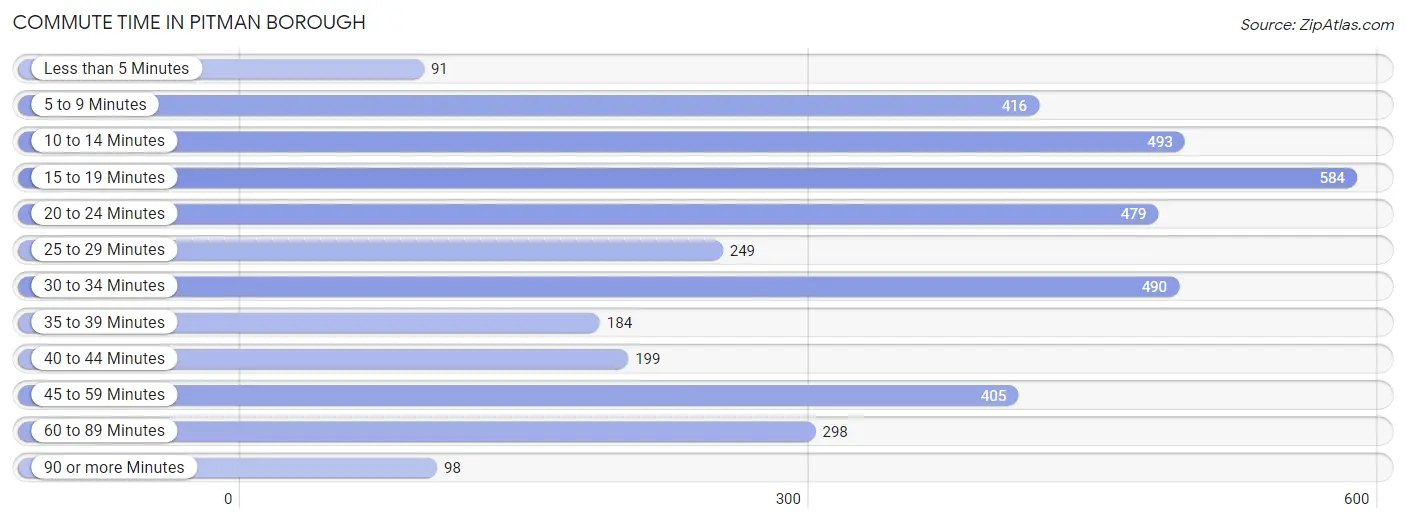
| Commute Time | # Commuters | % Commuters |
| Less than 5 Minutes | 91 | 2.3% |
| 5 to 9 Minutes | 416 | 10.4% |
| 10 to 14 Minutes | 493 | 12.4% |
| 15 to 19 Minutes | 584 | 14.6% |
| 20 to 24 Minutes | 479 | 12.0% |
| 25 to 29 Minutes | 249 | 6.2% |
| 30 to 34 Minutes | 490 | 12.3% |
| 35 to 39 Minutes | 184 | 4.6% |
| 40 to 44 Minutes | 199 | 5.0% |
| 45 to 59 Minutes | 405 | 10.2% |
| 60 to 89 Minutes | 298 | 7.5% |
| 90 or more Minutes | 98 | 2.5% |
Commute Time by Sex in Pitman borough
The most common commute times in Pitman borough are 15 to 19 minutes (299 commuters, 15.4%) for males and 30 to 34 minutes (347 commuters, 17.0%) for females.
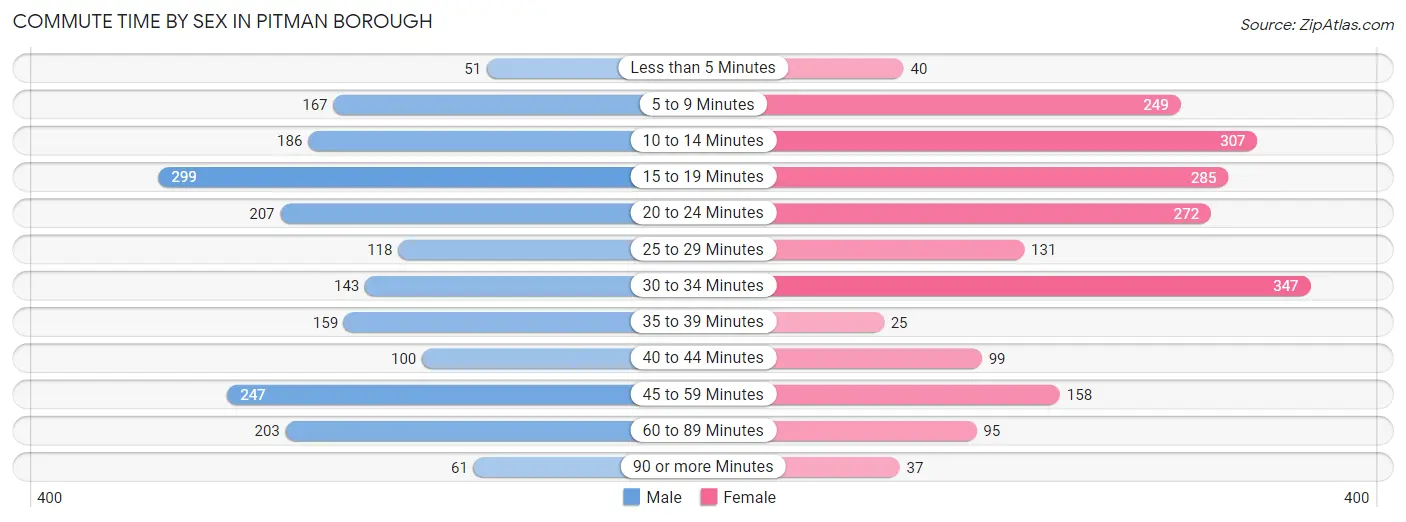
| Commute Time | Male | Female |
| Less than 5 Minutes | 51 (2.6%) | 40 (2.0%) |
| 5 to 9 Minutes | 167 (8.6%) | 249 (12.2%) |
| 10 to 14 Minutes | 186 (9.6%) | 307 (15.0%) |
| 15 to 19 Minutes | 299 (15.4%) | 285 (13.9%) |
| 20 to 24 Minutes | 207 (10.7%) | 272 (13.3%) |
| 25 to 29 Minutes | 118 (6.1%) | 131 (6.4%) |
| 30 to 34 Minutes | 143 (7.4%) | 347 (17.0%) |
| 35 to 39 Minutes | 159 (8.2%) | 25 (1.2%) |
| 40 to 44 Minutes | 100 (5.1%) | 99 (4.8%) |
| 45 to 59 Minutes | 247 (12.7%) | 158 (7.7%) |
| 60 to 89 Minutes | 203 (10.5%) | 95 (4.6%) |
| 90 or more Minutes | 61 (3.1%) | 37 (1.8%) |
Time of Departure to Work by Sex in Pitman borough
The most frequent times of departure to work in Pitman borough are 6:30 AM to 6:59 AM (404, 20.8%) for males and 7:00 AM to 7:29 AM (381, 18.6%) for females.
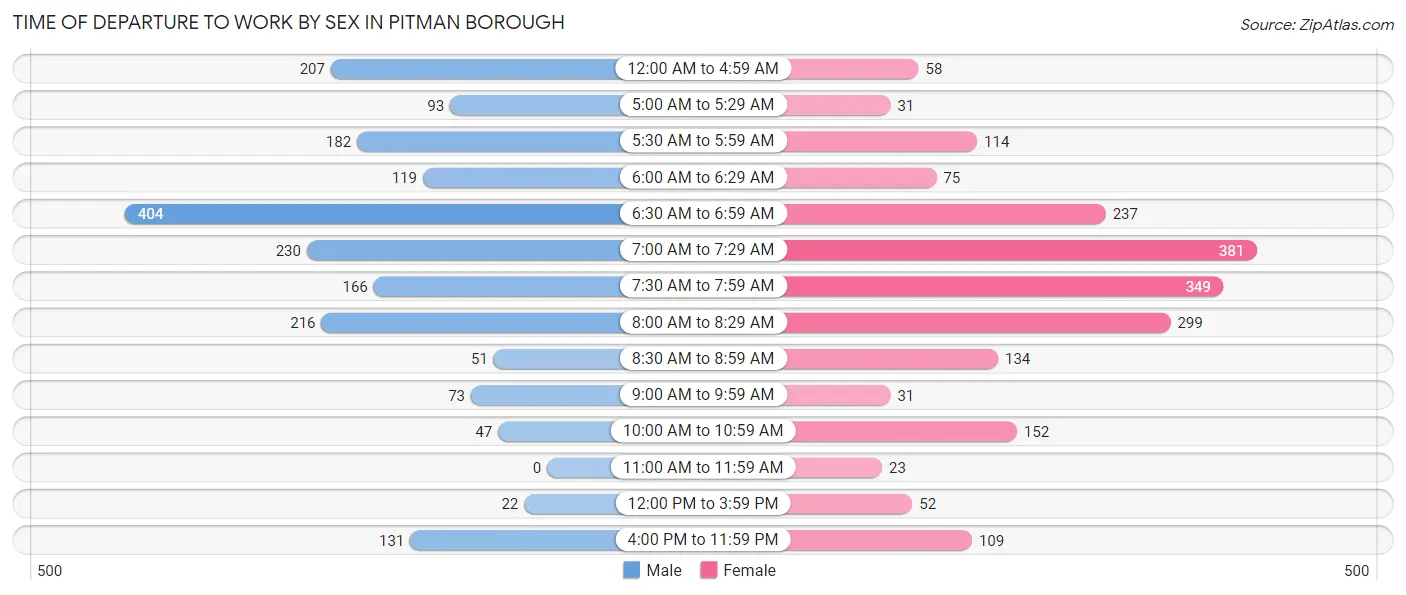
| Time of Departure | Male | Female |
| 12:00 AM to 4:59 AM | 207 (10.7%) | 58 (2.8%) |
| 5:00 AM to 5:29 AM | 93 (4.8%) | 31 (1.5%) |
| 5:30 AM to 5:59 AM | 182 (9.4%) | 114 (5.6%) |
| 6:00 AM to 6:29 AM | 119 (6.1%) | 75 (3.7%) |
| 6:30 AM to 6:59 AM | 404 (20.8%) | 237 (11.6%) |
| 7:00 AM to 7:29 AM | 230 (11.8%) | 381 (18.6%) |
| 7:30 AM to 7:59 AM | 166 (8.6%) | 349 (17.1%) |
| 8:00 AM to 8:29 AM | 216 (11.1%) | 299 (14.6%) |
| 8:30 AM to 8:59 AM | 51 (2.6%) | 134 (6.6%) |
| 9:00 AM to 9:59 AM | 73 (3.8%) | 31 (1.5%) |
| 10:00 AM to 10:59 AM | 47 (2.4%) | 152 (7.4%) |
| 11:00 AM to 11:59 AM | 0 (0.0%) | 23 (1.1%) |
| 12:00 PM to 3:59 PM | 22 (1.1%) | 52 (2.5%) |
| 4:00 PM to 11:59 PM | 131 (6.8%) | 109 (5.3%) |
| Total | 1,941 (100.0%) | 2,045 (100.0%) |
Housing Occupancy in Pitman borough
Occupancy by Ownership in Pitman borough
Of the total 3,670 dwellings in Pitman borough, owner-occupied units account for 2,622 (71.4%), while renter-occupied units make up 1,048 (28.6%).
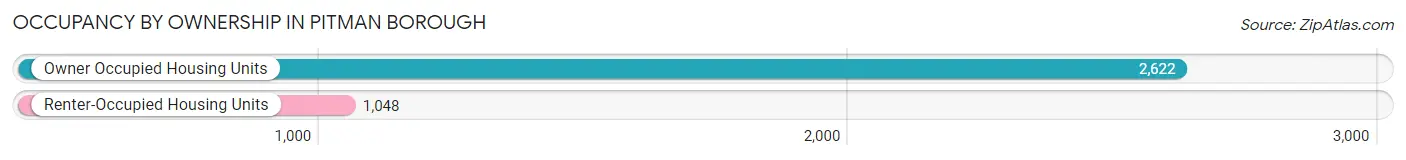
| Occupancy | # Housing Units | % Housing Units |
| Owner Occupied Housing Units | 2,622 | 71.4% |
| Renter-Occupied Housing Units | 1,048 | 28.6% |
| Total Occupied Housing Units | 3,670 | 100.0% |
Occupancy by Household Size in Pitman borough
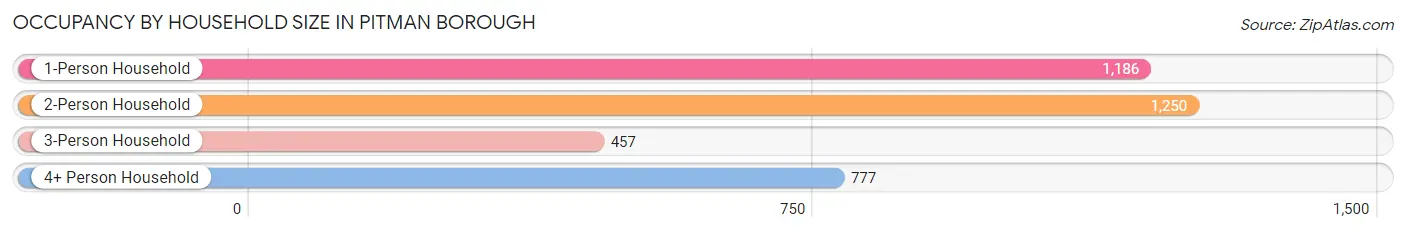
| Household Size | # Housing Units | % Housing Units |
| 1-Person Household | 1,186 | 32.3% |
| 2-Person Household | 1,250 | 34.1% |
| 3-Person Household | 457 | 12.4% |
| 4+ Person Household | 777 | 21.2% |
| Total Housing Units | 3,670 | 100.0% |
Occupancy by Ownership by Household Size in Pitman borough
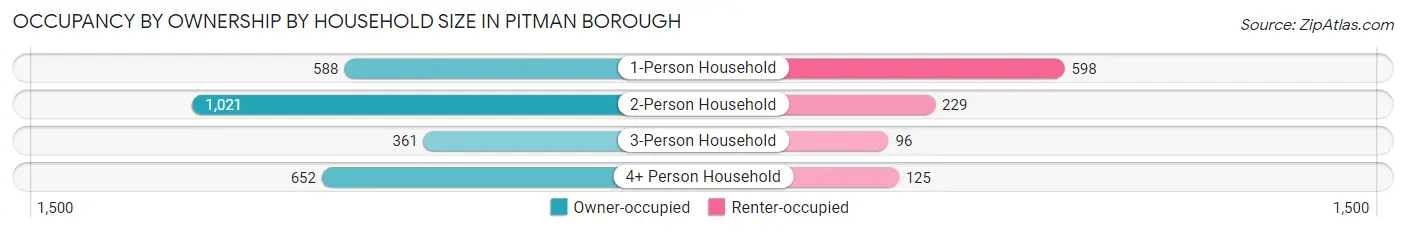
| Household Size | Owner-occupied | Renter-occupied |
| 1-Person Household | 588 (49.6%) | 598 (50.4%) |
| 2-Person Household | 1,021 (81.7%) | 229 (18.3%) |
| 3-Person Household | 361 (79.0%) | 96 (21.0%) |
| 4+ Person Household | 652 (83.9%) | 125 (16.1%) |
| Total Housing Units | 2,622 (71.4%) | 1,048 (28.6%) |
Occupancy by Educational Attainment in Pitman borough
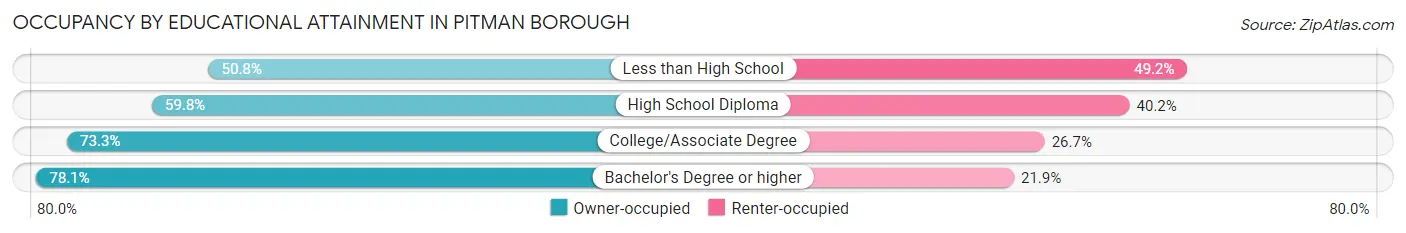
| Household Size | Owner-occupied | Renter-occupied |
| Less than High School | 63 (50.8%) | 61 (49.2%) |
| High School Diploma | 537 (59.8%) | 361 (40.2%) |
| College/Associate Degree | 707 (73.3%) | 258 (26.7%) |
| Bachelor's Degree or higher | 1,315 (78.1%) | 368 (21.9%) |
Occupancy by Age of Householder in Pitman borough
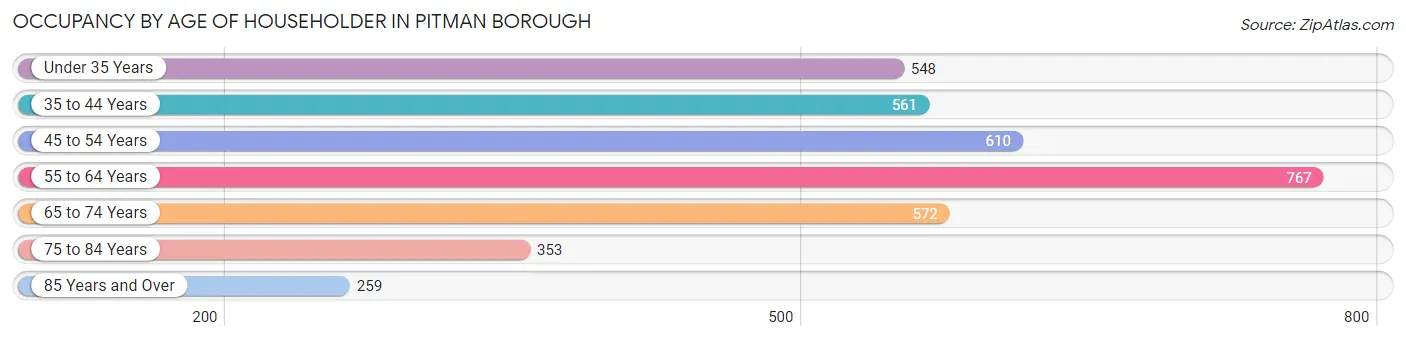
| Age Bracket | # Households | % Households |
| Under 35 Years | 548 | 14.9% |
| 35 to 44 Years | 561 | 15.3% |
| 45 to 54 Years | 610 | 16.6% |
| 55 to 64 Years | 767 | 20.9% |
| 65 to 74 Years | 572 | 15.6% |
| 75 to 84 Years | 353 | 9.6% |
| 85 Years and Over | 259 | 7.1% |
| Total | 3,670 | 100.0% |
Housing Finances in Pitman borough
Median Income by Occupancy in Pitman borough
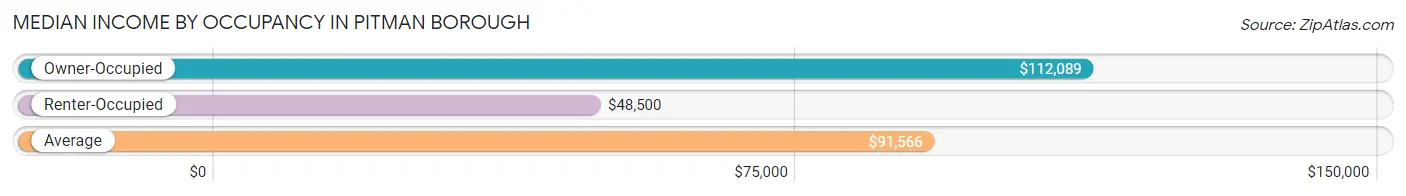
| Occupancy Type | # Households | Median Income |
| Owner-Occupied | 2,622 (71.4%) | $112,089 |
| Renter-Occupied | 1,048 (28.6%) | $48,500 |
| Average | 3,670 (100.0%) | $91,566 |
Occupancy by Householder Income Bracket in Pitman borough
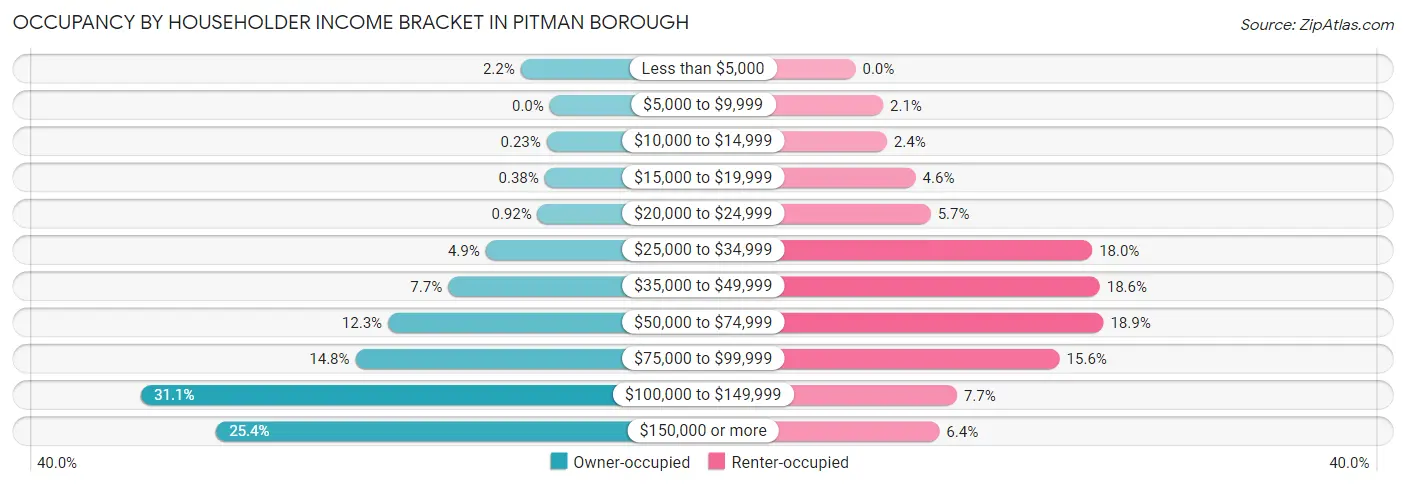
| Income Bracket | Owner-occupied | Renter-occupied |
| Less than $5,000 | 58 (2.2%) | 0 (0.0%) |
| $5,000 to $9,999 | 0 (0.0%) | 22 (2.1%) |
| $10,000 to $14,999 | 6 (0.2%) | 25 (2.4%) |
| $15,000 to $19,999 | 10 (0.4%) | 48 (4.6%) |
| $20,000 to $24,999 | 24 (0.9%) | 60 (5.7%) |
| $25,000 to $34,999 | 128 (4.9%) | 189 (18.0%) |
| $35,000 to $49,999 | 203 (7.7%) | 195 (18.6%) |
| $50,000 to $74,999 | 323 (12.3%) | 198 (18.9%) |
| $75,000 to $99,999 | 388 (14.8%) | 163 (15.5%) |
| $100,000 to $149,999 | 816 (31.1%) | 81 (7.7%) |
| $150,000 or more | 666 (25.4%) | 67 (6.4%) |
| Total | 2,622 (100.0%) | 1,048 (100.0%) |
Monthly Housing Cost Tiers in Pitman borough
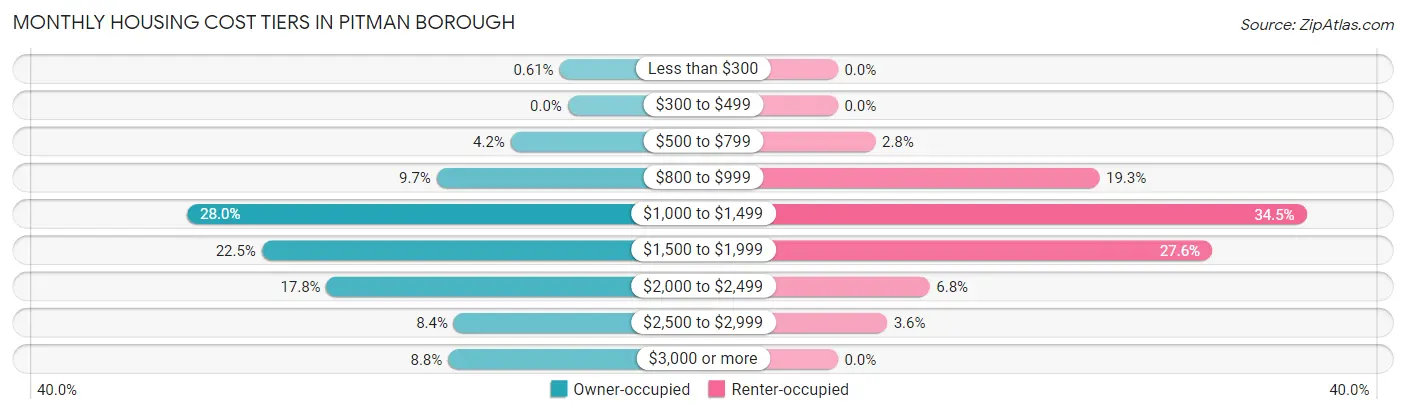
| Monthly Cost | Owner-occupied | Renter-occupied |
| Less than $300 | 16 (0.6%) | 0 (0.0%) |
| $300 to $499 | 0 (0.0%) | 0 (0.0%) |
| $500 to $799 | 110 (4.2%) | 29 (2.8%) |
| $800 to $999 | 253 (9.7%) | 202 (19.3%) |
| $1,000 to $1,499 | 735 (28.0%) | 362 (34.5%) |
| $1,500 to $1,999 | 591 (22.5%) | 289 (27.6%) |
| $2,000 to $2,499 | 466 (17.8%) | 71 (6.8%) |
| $2,500 to $2,999 | 220 (8.4%) | 38 (3.6%) |
| $3,000 or more | 231 (8.8%) | 0 (0.0%) |
| Total | 2,622 (100.0%) | 1,048 (100.0%) |
Physical Housing Characteristics in Pitman borough
Housing Structures in Pitman borough
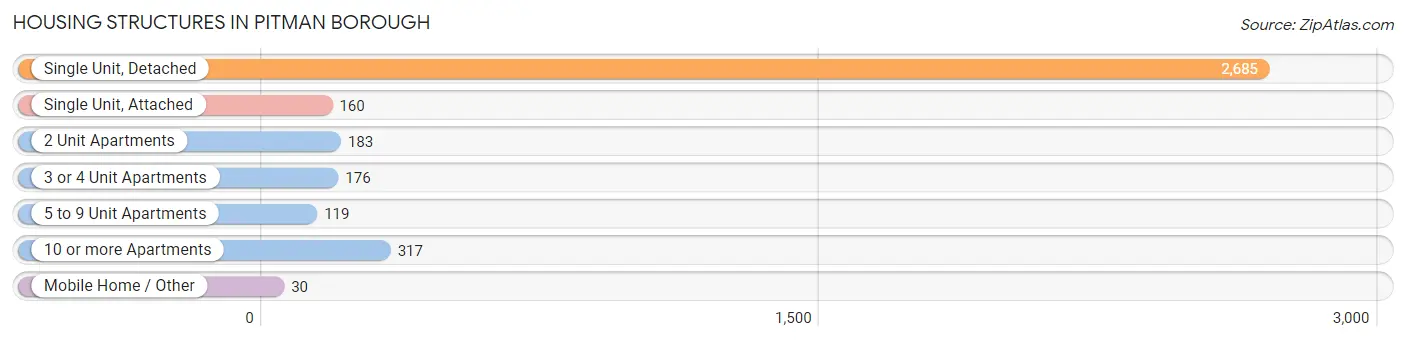
| Structure Type | # Housing Units | % Housing Units |
| Single Unit, Detached | 2,685 | 73.2% |
| Single Unit, Attached | 160 | 4.4% |
| 2 Unit Apartments | 183 | 5.0% |
| 3 or 4 Unit Apartments | 176 | 4.8% |
| 5 to 9 Unit Apartments | 119 | 3.2% |
| 10 or more Apartments | 317 | 8.6% |
| Mobile Home / Other | 30 | 0.8% |
| Total | 3,670 | 100.0% |
Housing Structures by Occupancy in Pitman borough
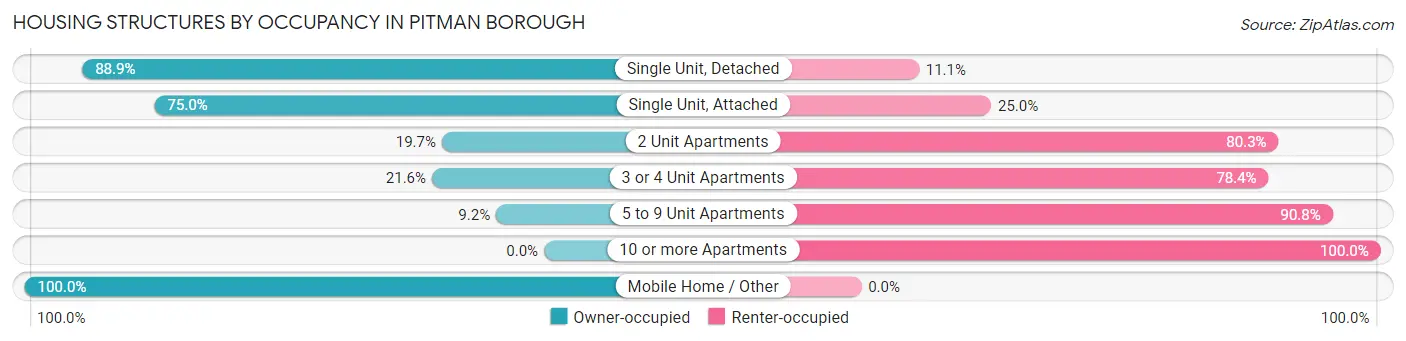
| Structure Type | Owner-occupied | Renter-occupied |
| Single Unit, Detached | 2,387 (88.9%) | 298 (11.1%) |
| Single Unit, Attached | 120 (75.0%) | 40 (25.0%) |
| 2 Unit Apartments | 36 (19.7%) | 147 (80.3%) |
| 3 or 4 Unit Apartments | 38 (21.6%) | 138 (78.4%) |
| 5 to 9 Unit Apartments | 11 (9.2%) | 108 (90.8%) |
| 10 or more Apartments | 0 (0.0%) | 317 (100.0%) |
| Mobile Home / Other | 30 (100.0%) | 0 (0.0%) |
| Total | 2,622 (71.4%) | 1,048 (28.6%) |
Housing Structures by Number of Rooms in Pitman borough
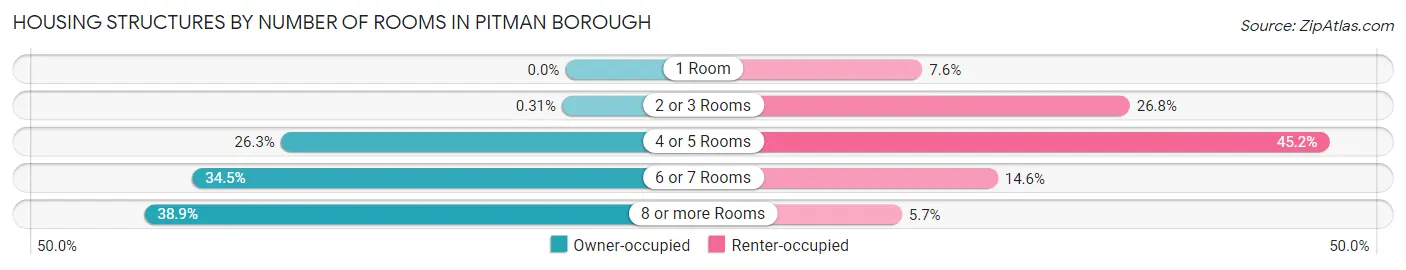
| Number of Rooms | Owner-occupied | Renter-occupied |
| 1 Room | 0 (0.0%) | 80 (7.6%) |
| 2 or 3 Rooms | 8 (0.3%) | 281 (26.8%) |
| 4 or 5 Rooms | 690 (26.3%) | 474 (45.2%) |
| 6 or 7 Rooms | 904 (34.5%) | 153 (14.6%) |
| 8 or more Rooms | 1,020 (38.9%) | 60 (5.7%) |
| Total | 2,622 (100.0%) | 1,048 (100.0%) |
Housing Structure by Heating Type in Pitman borough
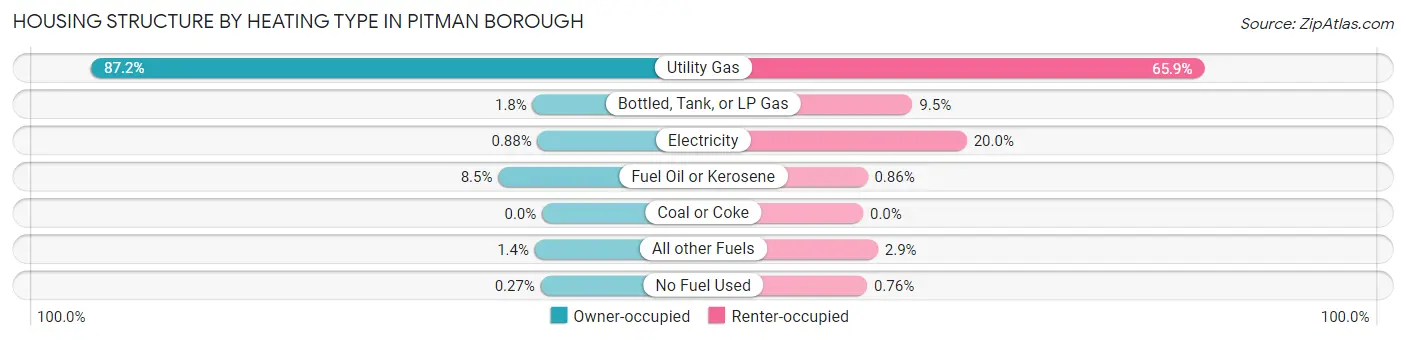
| Heating Type | Owner-occupied | Renter-occupied |
| Utility Gas | 2,285 (87.2%) | 691 (65.9%) |
| Bottled, Tank, or LP Gas | 48 (1.8%) | 100 (9.5%) |
| Electricity | 23 (0.9%) | 210 (20.0%) |
| Fuel Oil or Kerosene | 222 (8.5%) | 9 (0.9%) |
| Coal or Coke | 0 (0.0%) | 0 (0.0%) |
| All other Fuels | 37 (1.4%) | 30 (2.9%) |
| No Fuel Used | 7 (0.3%) | 8 (0.8%) |
| Total | 2,622 (100.0%) | 1,048 (100.0%) |
Household Vehicle Usage in Pitman borough
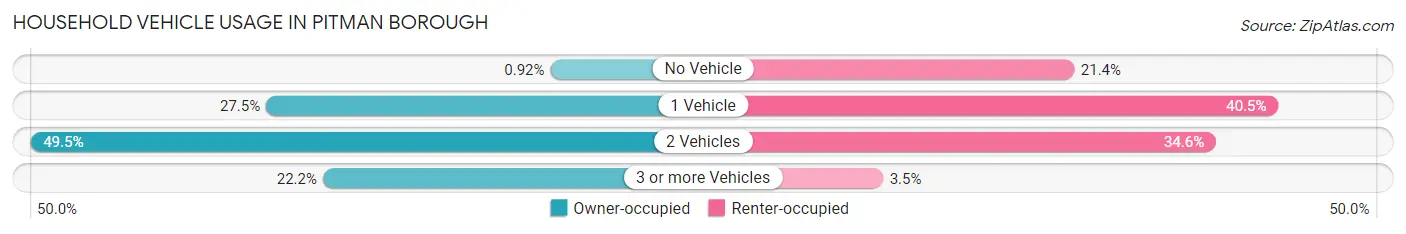
| Vehicles per Household | Owner-occupied | Renter-occupied |
| No Vehicle | 24 (0.9%) | 224 (21.4%) |
| 1 Vehicle | 720 (27.5%) | 424 (40.5%) |
| 2 Vehicles | 1,297 (49.5%) | 363 (34.6%) |
| 3 or more Vehicles | 581 (22.2%) | 37 (3.5%) |
| Total | 2,622 (100.0%) | 1,048 (100.0%) |
Real Estate & Mortgages in Pitman borough
Real Estate and Mortgage Overview in Pitman borough
| Characteristic | Without Mortgage | With Mortgage |
| Housing Units | 905 | 1,717 |
| Median Property Value | $242,900 | $229,900 |
| Median Household Income | $94,375 | $518 |
| Monthly Housing Costs | $1,218 | $231 |
| Real Estate Taxes | $8,379 | $48 |
Property Value by Mortgage Status in Pitman borough
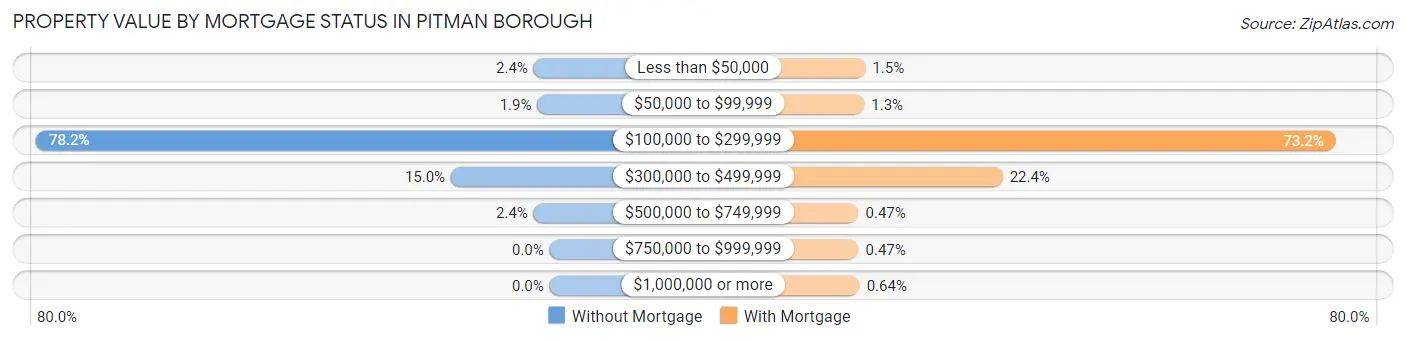
| Property Value | Without Mortgage | With Mortgage |
| Less than $50,000 | 22 (2.4%) | 26 (1.5%) |
| $50,000 to $99,999 | 17 (1.9%) | 23 (1.3%) |
| $100,000 to $299,999 | 708 (78.2%) | 1,256 (73.2%) |
| $300,000 to $499,999 | 136 (15.0%) | 385 (22.4%) |
| $500,000 to $749,999 | 22 (2.4%) | 8 (0.5%) |
| $750,000 to $999,999 | 0 (0.0%) | 8 (0.5%) |
| $1,000,000 or more | 0 (0.0%) | 11 (0.6%) |
| Total | 905 (100.0%) | 1,717 (100.0%) |
Household Income by Mortgage Status in Pitman borough
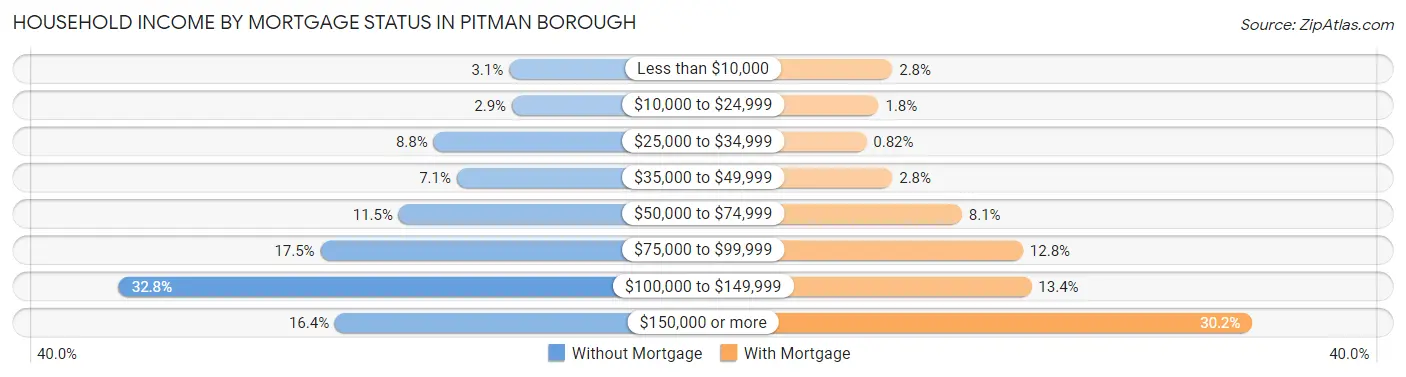
| Household Income | Without Mortgage | With Mortgage |
| Less than $10,000 | 28 (3.1%) | 48 (2.8%) |
| $10,000 to $24,999 | 26 (2.9%) | 30 (1.8%) |
| $25,000 to $34,999 | 80 (8.8%) | 14 (0.8%) |
| $35,000 to $49,999 | 64 (7.1%) | 48 (2.8%) |
| $50,000 to $74,999 | 104 (11.5%) | 139 (8.1%) |
| $75,000 to $99,999 | 158 (17.5%) | 219 (12.8%) |
| $100,000 to $149,999 | 297 (32.8%) | 230 (13.4%) |
| $150,000 or more | 148 (16.4%) | 519 (30.2%) |
| Total | 905 (100.0%) | 1,717 (100.0%) |
Property Value to Household Income Ratio in Pitman borough
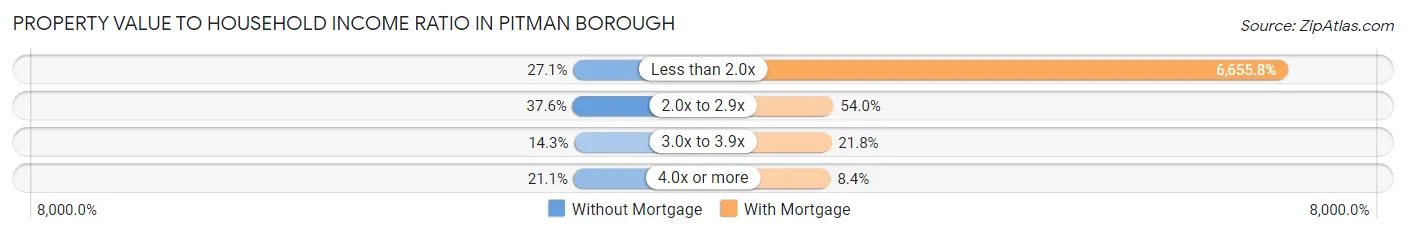
| Value-to-Income Ratio | Without Mortgage | With Mortgage |
| Less than 2.0x | 245 (27.1%) | 114,280 (6,655.8%) |
| 2.0x to 2.9x | 340 (37.6%) | 927 (54.0%) |
| 3.0x to 3.9x | 129 (14.2%) | 375 (21.8%) |
| 4.0x or more | 191 (21.1%) | 145 (8.4%) |
| Total | 905 (100.0%) | 1,717 (100.0%) |
Real Estate Taxes by Mortgage Status in Pitman borough
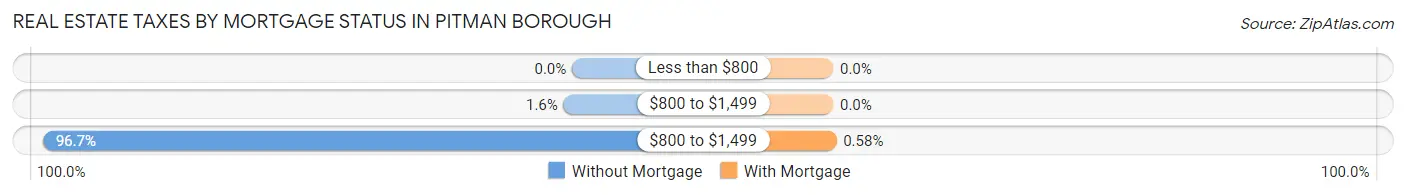
| Property Taxes | Without Mortgage | With Mortgage |
| Less than $800 | 0 (0.0%) | 0 (0.0%) |
| $800 to $1,499 | 14 (1.5%) | 0 (0.0%) |
| $800 to $1,499 | 875 (96.7%) | 10 (0.6%) |
| Total | 905 (100.0%) | 1,717 (100.0%) |
Health & Disability in Pitman borough
Health Insurance Coverage by Age in Pitman borough
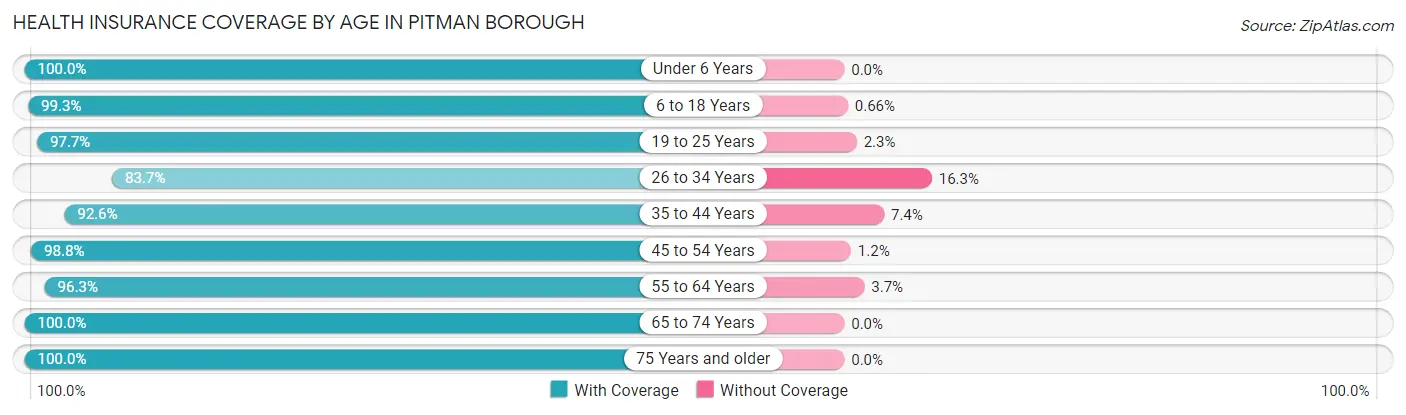
| Age Bracket | With Coverage | Without Coverage |
| Under 6 Years | 387 (100.0%) | 0 (0.0%) |
| 6 to 18 Years | 1,347 (99.3%) | 9 (0.7%) |
| 19 to 25 Years | 678 (97.7%) | 16 (2.3%) |
| 26 to 34 Years | 887 (83.7%) | 173 (16.3%) |
| 35 to 44 Years | 1,000 (92.6%) | 80 (7.4%) |
| 45 to 54 Years | 1,046 (98.8%) | 13 (1.2%) |
| 55 to 64 Years | 1,287 (96.3%) | 50 (3.7%) |
| 65 to 74 Years | 978 (100.0%) | 0 (0.0%) |
| 75 Years and older | 743 (100.0%) | 0 (0.0%) |
| Total | 8,353 (96.1%) | 341 (3.9%) |
Health Insurance Coverage by Citizenship Status in Pitman borough
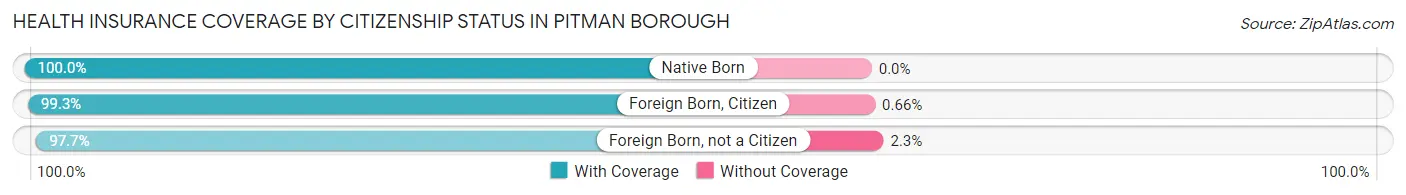
| Citizenship Status | With Coverage | Without Coverage |
| Native Born | 387 (100.0%) | 0 (0.0%) |
| Foreign Born, Citizen | 1,347 (99.3%) | 9 (0.7%) |
| Foreign Born, not a Citizen | 678 (97.7%) | 16 (2.3%) |
Health Insurance Coverage by Household Income in Pitman borough
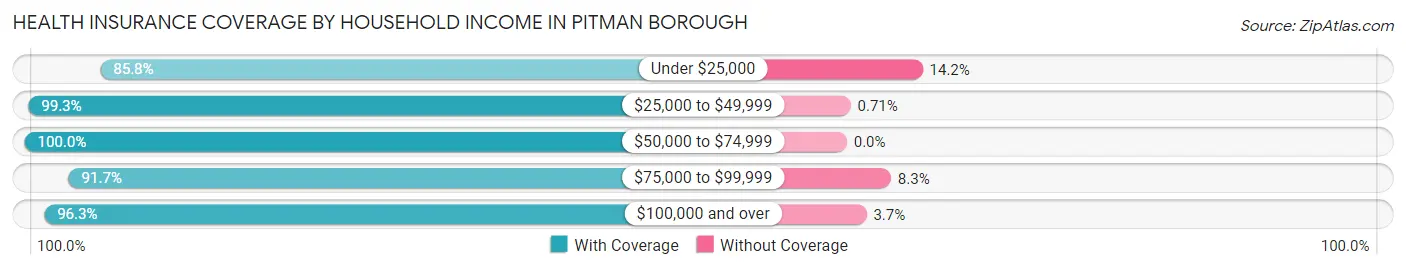
| Household Income | With Coverage | Without Coverage |
| Under $25,000 | 296 (85.8%) | 49 (14.2%) |
| $25,000 to $49,999 | 1,119 (99.3%) | 8 (0.7%) |
| $50,000 to $74,999 | 895 (100.0%) | 0 (0.0%) |
| $75,000 to $99,999 | 1,044 (91.7%) | 94 (8.3%) |
| $100,000 and over | 4,968 (96.3%) | 190 (3.7%) |
Public vs Private Health Insurance Coverage by Age in Pitman borough
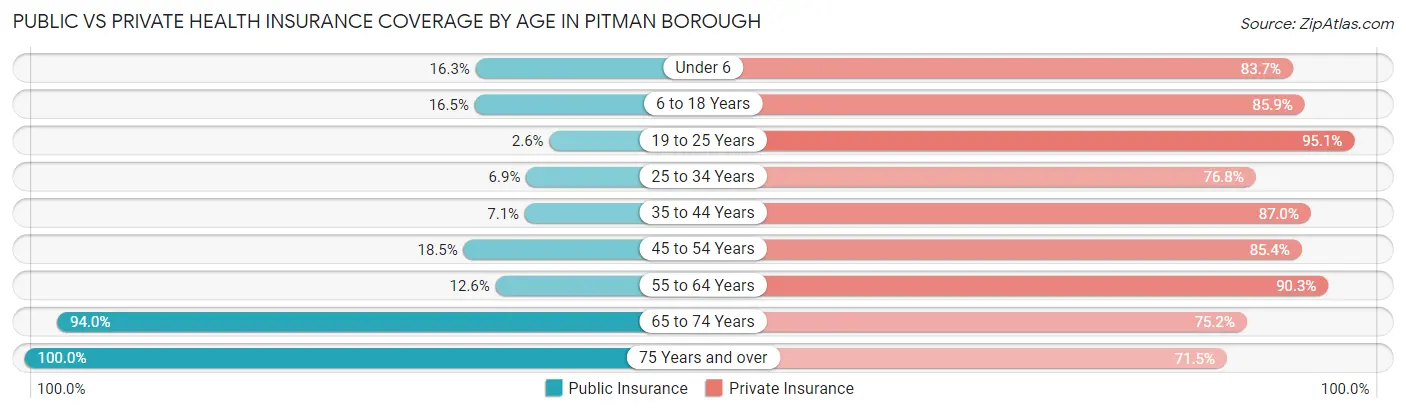
| Age Bracket | Public Insurance | Private Insurance |
| Under 6 | 63 (16.3%) | 324 (83.7%) |
| 6 to 18 Years | 223 (16.5%) | 1,165 (85.9%) |
| 19 to 25 Years | 18 (2.6%) | 660 (95.1%) |
| 25 to 34 Years | 73 (6.9%) | 814 (76.8%) |
| 35 to 44 Years | 77 (7.1%) | 940 (87.0%) |
| 45 to 54 Years | 196 (18.5%) | 904 (85.4%) |
| 55 to 64 Years | 168 (12.6%) | 1,207 (90.3%) |
| 65 to 74 Years | 919 (94.0%) | 735 (75.1%) |
| 75 Years and over | 743 (100.0%) | 531 (71.5%) |
| Total | 2,480 (28.5%) | 7,280 (83.7%) |
Disability Status by Sex by Age in Pitman borough
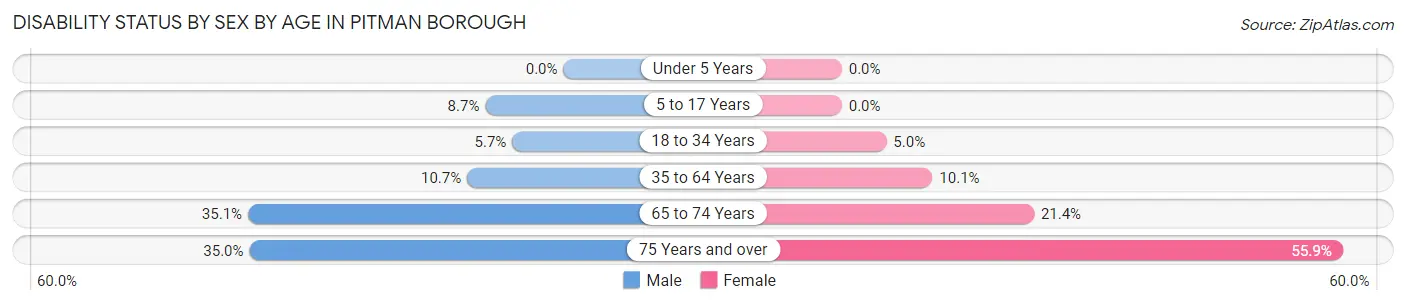
| Age Bracket | Male | Female |
| Under 5 Years | 0 (0.0%) | 0 (0.0%) |
| 5 to 17 Years | 62 (8.7%) | 0 (0.0%) |
| 18 to 34 Years | 47 (5.7%) | 50 (5.0%) |
| 35 to 64 Years | 173 (10.7%) | 188 (10.1%) |
| 65 to 74 Years | 163 (35.1%) | 110 (21.4%) |
| 75 Years and over | 64 (35.0%) | 313 (55.9%) |
Disability Class by Sex by Age in Pitman borough
Disability Class: Hearing Difficulty
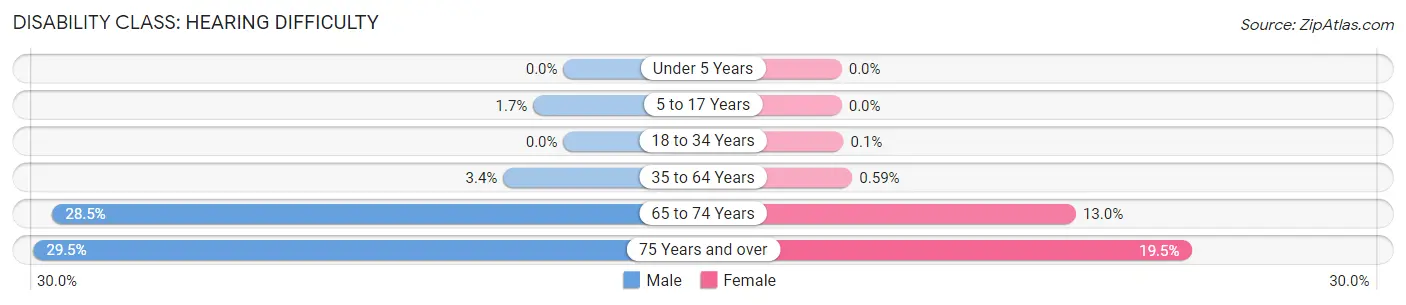
| Age Bracket | Male | Female |
| Under 5 Years | 0 (0.0%) | 0 (0.0%) |
| 5 to 17 Years | 12 (1.7%) | 0 (0.0%) |
| 18 to 34 Years | 0 (0.0%) | 1 (0.1%) |
| 35 to 64 Years | 54 (3.4%) | 11 (0.6%) |
| 65 to 74 Years | 132 (28.4%) | 67 (13.0%) |
| 75 Years and over | 54 (29.5%) | 109 (19.5%) |
Disability Class: Vision Difficulty
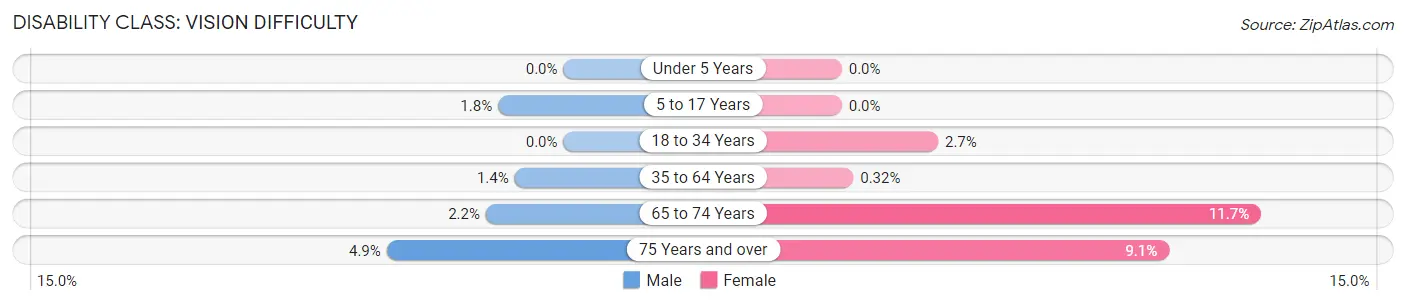
| Age Bracket | Male | Female |
| Under 5 Years | 0 (0.0%) | 0 (0.0%) |
| 5 to 17 Years | 13 (1.8%) | 0 (0.0%) |
| 18 to 34 Years | 0 (0.0%) | 27 (2.7%) |
| 35 to 64 Years | 22 (1.4%) | 6 (0.3%) |
| 65 to 74 Years | 10 (2.2%) | 60 (11.7%) |
| 75 Years and over | 9 (4.9%) | 51 (9.1%) |
Disability Class: Cognitive Difficulty
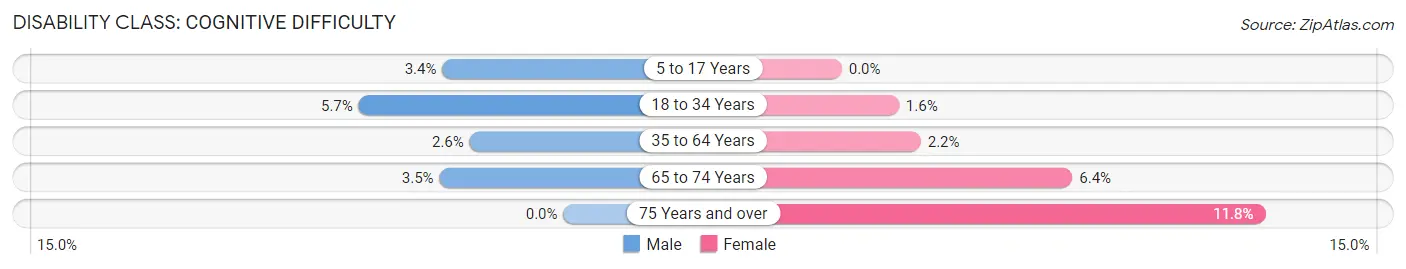
| Age Bracket | Male | Female |
| 5 to 17 Years | 24 (3.4%) | 0 (0.0%) |
| 18 to 34 Years | 47 (5.7%) | 16 (1.6%) |
| 35 to 64 Years | 42 (2.6%) | 41 (2.2%) |
| 65 to 74 Years | 16 (3.5%) | 33 (6.4%) |
| 75 Years and over | 0 (0.0%) | 66 (11.8%) |
Disability Class: Ambulatory Difficulty
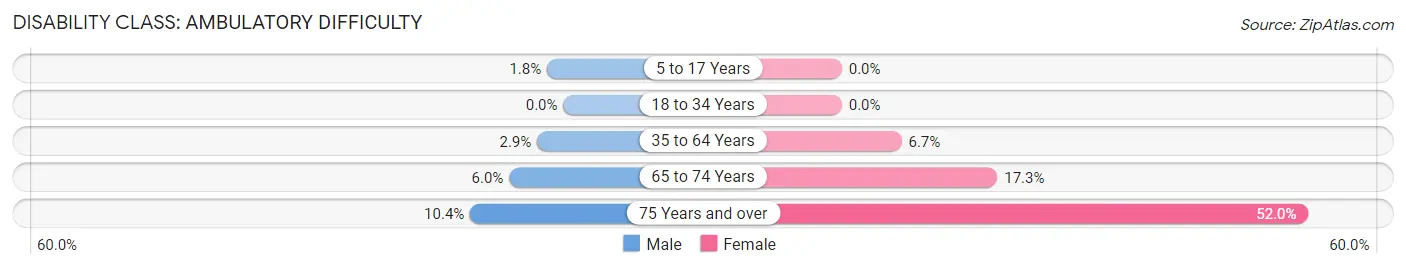
| Age Bracket | Male | Female |
| 5 to 17 Years | 13 (1.8%) | 0 (0.0%) |
| 18 to 34 Years | 0 (0.0%) | 0 (0.0%) |
| 35 to 64 Years | 47 (2.9%) | 124 (6.7%) |
| 65 to 74 Years | 28 (6.0%) | 89 (17.3%) |
| 75 Years and over | 19 (10.4%) | 291 (52.0%) |
Disability Class: Self-Care Difficulty
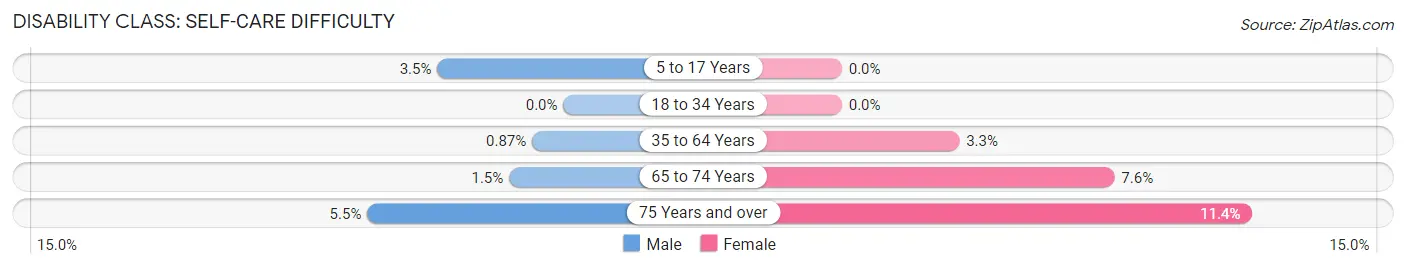
| Age Bracket | Male | Female |
| 5 to 17 Years | 25 (3.5%) | 0 (0.0%) |
| 18 to 34 Years | 0 (0.0%) | 0 (0.0%) |
| 35 to 64 Years | 14 (0.9%) | 61 (3.3%) |
| 65 to 74 Years | 7 (1.5%) | 39 (7.6%) |
| 75 Years and over | 10 (5.5%) | 64 (11.4%) |
Technology Access in Pitman borough
Computing Device Access in Pitman borough
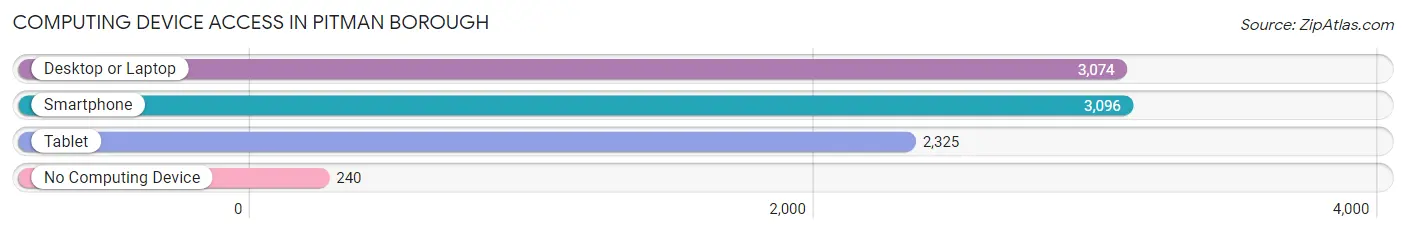
| Device Type | # Households | % Households |
| Desktop or Laptop | 3,074 | 83.8% |
| Smartphone | 3,096 | 84.4% |
| Tablet | 2,325 | 63.3% |
| No Computing Device | 240 | 6.5% |
| Total | 3,670 | 100.0% |
Internet Access in Pitman borough
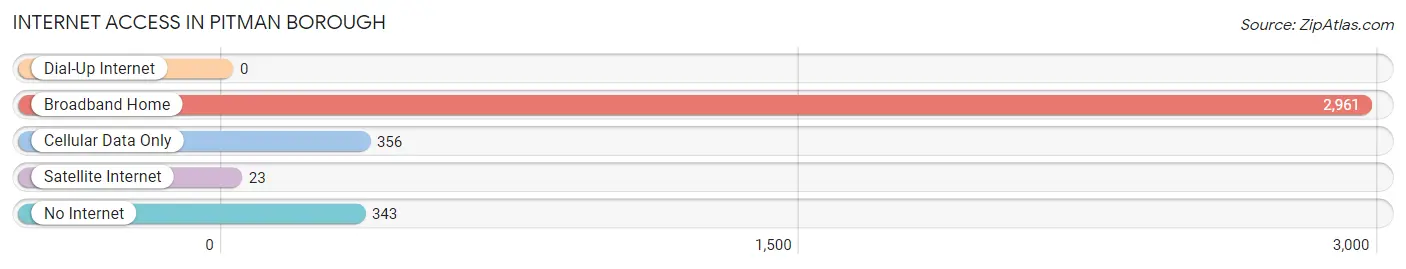
| Internet Type | # Households | % Households |
| Dial-Up Internet | 0 | 0.0% |
| Broadband Home | 2,961 | 80.7% |
| Cellular Data Only | 356 | 9.7% |
| Satellite Internet | 23 | 0.6% |
| No Internet | 343 | 9.3% |
| Total | 3,670 | 100.0% |
Pitman borough Summary
Pitman Borough is a small borough located in Gloucester County, New Jersey. It is situated in the southwestern part of the state, approximately 10 miles from Philadelphia, Pennsylvania. The borough is home to approximately 9,000 people and covers an area of 1.7 square miles.
History
Pitman Borough was founded in 1905 by John Pitman, a Quaker from Philadelphia. He purchased a large tract of land in the area and began to develop it into a residential community. The borough was officially incorporated in 1905 and was named after John Pitman.
The borough was originally a farming community, but it quickly developed into a residential area. In the early 1900s, the borough was home to several large farms, including the Pitman Farm, which was owned by John Pitman. The borough also had a number of small businesses, including a general store, a blacksmith shop, and a post office.
In the 1920s, the borough began to experience a period of growth and development. The population increased and new businesses opened, including a movie theater, a bowling alley, and a variety of shops. The borough also became a popular destination for tourists, who came to enjoy the area’s natural beauty and recreational activities.
In the 1950s, the borough experienced a period of decline. Many of the businesses closed and the population decreased. However, in the late 1970s, the borough began to experience a resurgence. New businesses opened and the population began to increase.
Geography
Pitman Borough is located in the southwestern part of Gloucester County, New Jersey. It is situated approximately 10 miles from Philadelphia, Pennsylvania. The borough covers an area of 1.7 square miles and is bordered by Mantua Township to the north, Glassboro to the east, and Washington Township to the south and west.
The borough is located in the Atlantic Coastal Plain region of New Jersey. The terrain is generally flat and the soil is sandy and loamy. The borough is home to several small streams, including the Mantua Creek, which flows through the borough.
Economy
The economy of Pitman Borough is largely based on the service industry. The borough is home to a variety of businesses, including restaurants, retail stores, and professional services. The borough also has a number of manufacturing companies, including a plastics factory and a printing company.
The borough is also home to a number of educational institutions, including Rowan University and Gloucester County College. These institutions provide a variety of educational opportunities for residents of the borough.
Demographics
As of the 2010 census, the population of Pitman Borough was 8,945. The racial makeup of the borough was 87.3% White, 8.2% African American, 0.7% Asian, 0.3% Native American, and 3.5% from other races. The median household income was $60,945 and the median family income was $71,945.
The borough is home to a variety of religious denominations, including Roman Catholic, Methodist, Presbyterian, and Baptist. The borough also has a number of cultural organizations, including the Pitman Arts Council and the Pitman Historical Society.
Conclusion
Pitman Borough is a small borough located in Gloucester County, New Jersey. It is situated in the southwestern part of the state, approximately 10 miles from Philadelphia, Pennsylvania. The borough was founded in 1905 by John Pitman and was originally a farming community. In the early 1900s, the borough began to experience a period of growth and development and became a popular destination for tourists. The economy of the borough is largely based on the service industry and the population is approximately 8,945. The borough is home to a variety of religious denominations and cultural organizations.
Common Questions
What is Per Capita Income in Pitman borough?
Per Capita income in Pitman borough is $44,092.
What is the Median Family Income in Pitman borough?
Median Family Income in Pitman borough is $116,302.
What is the Median Household income in Pitman borough?
Median Household Income in Pitman borough is $91,566.
What is Income or Wage Gap in Pitman borough?
Income or Wage Gap in Pitman borough is 46.1%.
Women in Pitman borough earn 53.9 cents for every dollar earned by a man.
What is Inequality or Gini Index in Pitman borough?
Inequality or Gini Index in Pitman borough is 0.36.
What is the Total Population of Pitman borough?
Total Population of Pitman borough is 8,805.
What is the Total Male Population of Pitman borough?
Total Male Population of Pitman borough is 4,075.
What is the Total Female Population of Pitman borough?
Total Female Population of Pitman borough is 4,730.
What is the Ratio of Males per 100 Females in Pitman borough?
There are 86.15 Males per 100 Females in Pitman borough.
What is the Ratio of Females per 100 Males in Pitman borough?
There are 116.07 Females per 100 Males in Pitman borough.
What is the Median Population Age in Pitman borough?
Median Population Age in Pitman borough is 43.4 Years.
What is the Average Family Size in Pitman borough
Average Family Size in Pitman borough is 3.0 People.
What is the Average Household Size in Pitman borough
Average Household Size in Pitman borough is 2.4 People.
How Large is the Labor Force in Pitman borough?
There are 4,927 People in the Labor Forcein in Pitman borough.
What is the Percentage of People in the Labor Force in Pitman borough?
66.8% of People are in the Labor Force in Pitman borough.
What is the Unemployment Rate in Pitman borough?
Unemployment Rate in Pitman borough is 6.6%.