Cities with the Most Immigrants from Guatemala in Missouri
RELATED REPORTS & OPTIONS
Guatemala
Missouri
Compare Cities
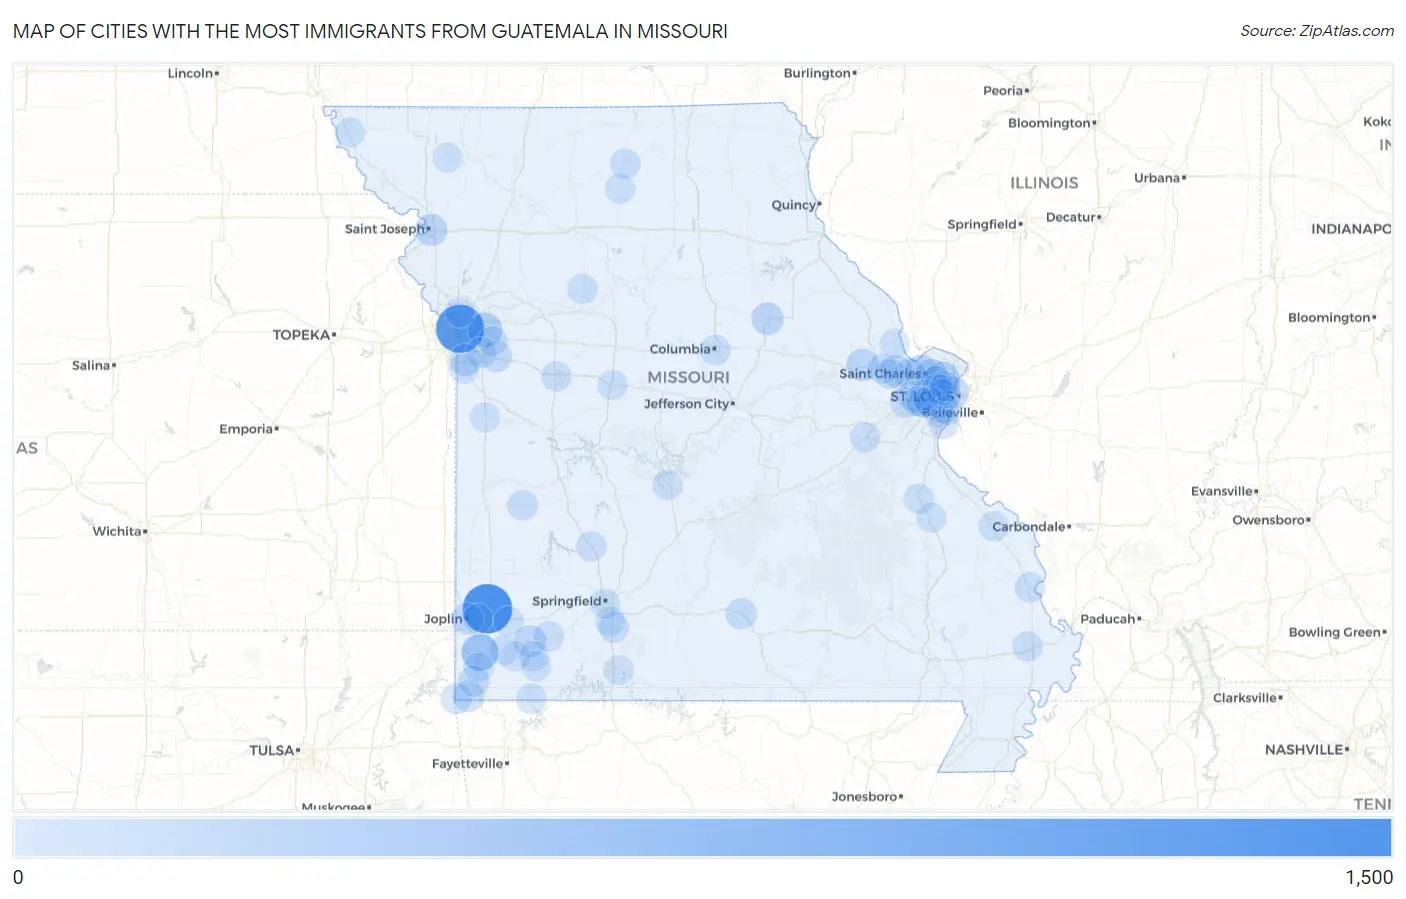
Map of Cities with the Most Immigrants from Guatemala in Missouri
0
1,500
Cities with the Most Immigrants from Guatemala in Missouri
| City | Guatemala | vs State | vs National | |
| 1. | Carthage | 1,309 | 7,146(18.32%)#1 | 1,051,999(0.12%)#117 |
| 2. | Kansas City | 1,215 | 7,146(17.00%)#2 | 1,051,999(0.12%)#131 |
| 3. | Neosho | 454 | 7,146(6.35%)#3 | 1,051,999(0.04%)#367 |
| 4. | Independence | 289 | 7,146(4.04%)#4 | 1,051,999(0.03%)#523 |
| 5. | Berkeley | 274 | 7,146(3.83%)#5 | 1,051,999(0.03%)#547 |
| 6. | St Charles | 192 | 7,146(2.69%)#6 | 1,051,999(0.02%)#742 |
| 7. | St Louis | 171 | 7,146(2.39%)#7 | 1,051,999(0.02%)#819 |
| 8. | Wright City | 152 | 7,146(2.13%)#8 | 1,051,999(0.01%)#902 |
| 9. | Mexico | 149 | 7,146(2.09%)#9 | 1,051,999(0.01%)#919 |
| 10. | Bridgeton | 147 | 7,146(2.06%)#10 | 1,051,999(0.01%)#925 |
| 11. | O Fallon | 142 | 7,146(1.99%)#11 | 1,051,999(0.01%)#958 |
| 12. | St Joseph | 140 | 7,146(1.96%)#12 | 1,051,999(0.01%)#968 |
| 13. | Monett | 139 | 7,146(1.95%)#13 | 1,051,999(0.01%)#982 |
| 14. | Grandview | 131 | 7,146(1.83%)#14 | 1,051,999(0.01%)#1,017 |
| 15. | Joplin | 116 | 7,146(1.62%)#15 | 1,051,999(0.01%)#1,106 |
| 16. | Lake Lotawana | 94 | 7,146(1.32%)#16 | 1,051,999(0.01%)#1,261 |
| 17. | Noel | 73 | 7,146(1.02%)#17 | 1,051,999(0.01%)#1,470 |
| 18. | St Peters | 72 | 7,146(1.01%)#18 | 1,051,999(0.01%)#1,473 |
| 19. | Southwest City | 69 | 7,146(0.97%)#19 | 1,051,999(0.01%)#1,516 |
| 20. | Anderson | 64 | 7,146(0.90%)#20 | 1,051,999(0.01%)#1,590 |
| 21. | Cabool | 61 | 7,146(0.85%)#21 | 1,051,999(0.01%)#1,641 |
| 22. | Affton | 58 | 7,146(0.81%)#22 | 1,051,999(0.01%)#1,680 |
| 23. | Lee S Summit | 47 | 7,146(0.66%)#23 | 1,051,999(0.00%)#1,863 |
| 24. | St Ann | 39 | 7,146(0.55%)#24 | 1,051,999(0.00%)#2,052 |
| 25. | Wildwood | 36 | 7,146(0.50%)#25 | 1,051,999(0.00%)#2,134 |
| 26. | Kirkwood | 36 | 7,146(0.50%)#26 | 1,051,999(0.00%)#2,138 |
| 27. | Columbia | 35 | 7,146(0.49%)#27 | 1,051,999(0.00%)#2,163 |
| 28. | Ozark | 35 | 7,146(0.49%)#28 | 1,051,999(0.00%)#2,171 |
| 29. | Blue Summit | 35 | 7,146(0.49%)#29 | 1,051,999(0.00%)#2,192 |
| 30. | El Dorado Springs | 34 | 7,146(0.48%)#30 | 1,051,999(0.00%)#2,219 |
| 31. | Warrensburg | 32 | 7,146(0.45%)#31 | 1,051,999(0.00%)#2,266 |
| 32. | Lake St Louis | 29 | 7,146(0.41%)#32 | 1,051,999(0.00%)#2,366 |
| 33. | Cape Girardeau | 26 | 7,146(0.36%)#33 | 1,051,999(0.00%)#2,462 |
| 34. | Bolivar | 25 | 7,146(0.35%)#34 | 1,051,999(0.00%)#2,513 |
| 35. | Clarkson Valley | 24 | 7,146(0.34%)#35 | 1,051,999(0.00%)#2,566 |
| 36. | Sedalia | 22 | 7,146(0.31%)#36 | 1,051,999(0.00%)#2,635 |
| 37. | Verona | 20 | 7,146(0.28%)#37 | 1,051,999(0.00%)#2,766 |
| 38. | Sikeston | 18 | 7,146(0.25%)#38 | 1,051,999(0.00%)#2,836 |
| 39. | Seligman | 18 | 7,146(0.25%)#39 | 1,051,999(0.00%)#2,868 |
| 40. | Wentzville | 15 | 7,146(0.21%)#40 | 1,051,999(0.00%)#2,996 |
| 41. | Concord | 15 | 7,146(0.21%)#41 | 1,051,999(0.00%)#3,007 |
| 42. | Perryville | 15 | 7,146(0.21%)#42 | 1,051,999(0.00%)#3,018 |
| 43. | University City | 14 | 7,146(0.20%)#43 | 1,051,999(0.00%)#3,060 |
| 44. | Milan | 14 | 7,146(0.20%)#44 | 1,051,999(0.00%)#3,109 |
| 45. | Carrollton | 13 | 7,146(0.18%)#45 | 1,051,999(0.00%)#3,171 |
| 46. | Oakville | 12 | 7,146(0.17%)#46 | 1,051,999(0.00%)#3,198 |
| 47. | St Clair | 12 | 7,146(0.17%)#47 | 1,051,999(0.00%)#3,235 |
| 48. | Blue Springs | 11 | 7,146(0.15%)#48 | 1,051,999(0.00%)#3,270 |
| 49. | Ballwin | 11 | 7,146(0.15%)#49 | 1,051,999(0.00%)#3,277 |
| 50. | Town And Country | 11 | 7,146(0.15%)#50 | 1,051,999(0.00%)#3,309 |
| 51. | Clayton | 10 | 7,146(0.14%)#51 | 1,051,999(0.00%)#3,385 |
| 52. | Archie | 10 | 7,146(0.14%)#52 | 1,051,999(0.00%)#3,437 |
| 53. | Fairview | 9 | 7,146(0.13%)#53 | 1,051,999(0.00%)#3,547 |
| 54. | Conception | 8 | 7,146(0.11%)#54 | 1,051,999(0.00%)#3,643 |
| 55. | Belton | 7 | 7,146(0.10%)#55 | 1,051,999(0.00%)#3,658 |
| 56. | Olivette | 7 | 7,146(0.10%)#56 | 1,051,999(0.00%)#3,680 |
| 57. | Purdy | 7 | 7,146(0.10%)#57 | 1,051,999(0.00%)#3,715 |
| 58. | Lemay | 6 | 7,146(0.08%)#58 | 1,051,999(0.00%)#3,764 |
| 59. | Goodman | 6 | 7,146(0.08%)#59 | 1,051,999(0.00%)#3,826 |
| 60. | Springfield | 5 | 7,146(0.07%)#60 | 1,051,999(0.00%)#3,855 |
| 61. | Bonne Terre | 5 | 7,146(0.07%)#61 | 1,051,999(0.00%)#3,887 |
| 62. | Camdenton | 4 | 7,146(0.06%)#62 | 1,051,999(0.00%)#3,976 |
| 63. | Winchester | 4 | 7,146(0.06%)#63 | 1,051,999(0.00%)#4,007 |
| 64. | Winfield | 4 | 7,146(0.06%)#64 | 1,051,999(0.00%)#4,009 |
| 65. | Sarcoxie | 4 | 7,146(0.06%)#65 | 1,051,999(0.00%)#4,015 |
| 66. | Duenweg | 3 | 7,146(0.04%)#66 | 1,051,999(0.00%)#4,110 |
| 67. | Fremont Hills | 3 | 7,146(0.04%)#67 | 1,051,999(0.00%)#4,117 |
| 68. | Butterfield | 3 | 7,146(0.04%)#68 | 1,051,999(0.00%)#4,143 |
| 69. | Browning | 3 | 7,146(0.04%)#69 | 1,051,999(0.00%)#4,151 |
| 70. | Manchester | 2 | 7,146(0.03%)#70 | 1,051,999(0.00%)#4,167 |
| 71. | Farmington | 2 | 7,146(0.03%)#71 | 1,051,999(0.00%)#4,168 |
| 72. | Des Peres | 2 | 7,146(0.03%)#72 | 1,051,999(0.00%)#4,176 |
| 73. | Merriam Woods | 2 | 7,146(0.03%)#73 | 1,051,999(0.00%)#4,201 |
| 74. | Oakwood | 2 | 7,146(0.03%)#74 | 1,051,999(0.00%)#4,268 |
| 75. | Rock Port | 1 | 7,146(0.01%)#75 | 1,051,999(0.00%)#4,350 |
| 76. | Greendale | 1 | 7,146(0.01%)#76 | 1,051,999(0.00%)#4,364 |
| 77. | Stark City | 1 | 7,146(0.01%)#77 | 1,051,999(0.00%)#4,405 |
Common Questions
What are the Top 10 Cities with the Most Immigrants from Guatemala in Missouri?
Top 10 Cities with the Most Immigrants from Guatemala in Missouri are:
#1
1,309
#2
1,215
#3
454
#4
289
#5
274
#6
192
#7
171
#8
152
#9
149
#10
147
What city has the Most Immigrants from Guatemala in Missouri?
Carthage has the Most Immigrants from Guatemala in Missouri with 1,309.
What is the Total Immigrants from Guatemala in the State of Missouri?
Total Immigrants from Guatemala in Missouri is 7,146.
What is the Total Immigrants from Guatemala in the United States?
Total Immigrants from Guatemala in the United States is 1,051,999.