Cities with the Most Immigrants from Guatemala in Illinois
RELATED REPORTS & OPTIONS
Guatemala
Illinois
Compare Cities
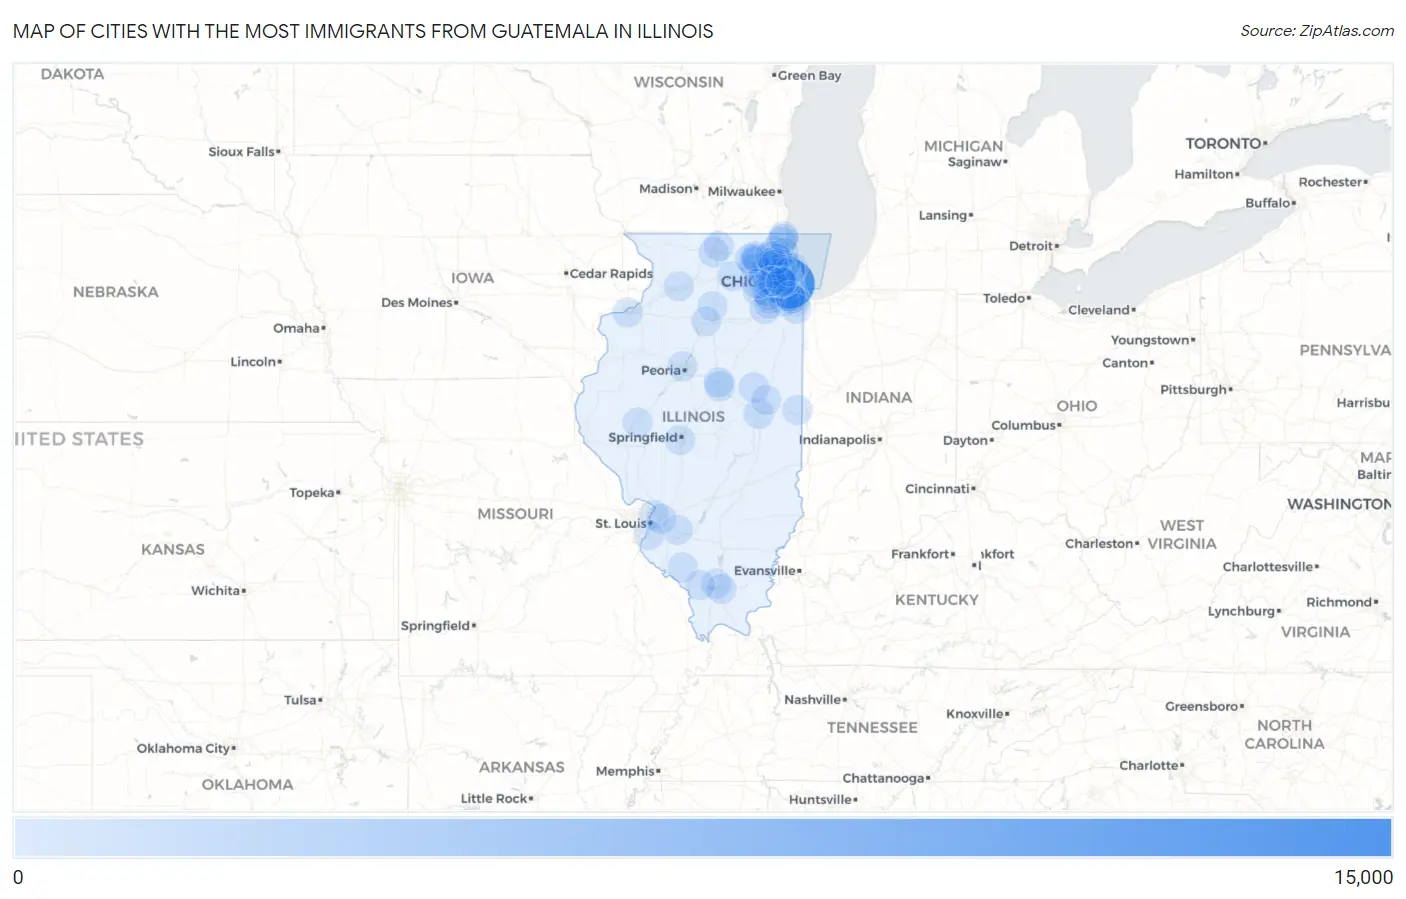
Map of Cities with the Most Immigrants from Guatemala in Illinois
0
15,000
Cities with the Most Immigrants from Guatemala in Illinois
| City | Guatemala | vs State | vs National | |
| 1. | Chicago | 10,661 | 22,793(46.77%)#1 | 1,051,999(1.01%)#4 |
| 2. | Cicero | 789 | 22,793(3.46%)#2 | 1,051,999(0.08%)#212 |
| 3. | Bensenville | 676 | 22,793(2.97%)#3 | 1,051,999(0.06%)#249 |
| 4. | Melrose Park | 484 | 22,793(2.12%)#4 | 1,051,999(0.05%)#357 |
| 5. | Addison | 478 | 22,793(2.10%)#5 | 1,051,999(0.05%)#359 |
| 6. | Berwyn | 275 | 22,793(1.21%)#6 | 1,051,999(0.03%)#546 |
| 7. | Waukegan | 269 | 22,793(1.18%)#7 | 1,051,999(0.03%)#556 |
| 8. | Aurora | 224 | 22,793(0.98%)#8 | 1,051,999(0.02%)#652 |
| 9. | Villa Park | 202 | 22,793(0.89%)#9 | 1,051,999(0.02%)#705 |
| 10. | Mount Prospect | 189 | 22,793(0.83%)#10 | 1,051,999(0.02%)#754 |
| 11. | Mundelein | 187 | 22,793(0.82%)#11 | 1,051,999(0.02%)#765 |
| 12. | Joliet | 182 | 22,793(0.80%)#12 | 1,051,999(0.02%)#782 |
| 13. | Bloomington | 177 | 22,793(0.78%)#13 | 1,051,999(0.02%)#797 |
| 14. | Elgin | 167 | 22,793(0.73%)#14 | 1,051,999(0.02%)#831 |
| 15. | Champaign | 166 | 22,793(0.73%)#15 | 1,051,999(0.02%)#836 |
| 16. | Gilberts | 166 | 22,793(0.73%)#16 | 1,051,999(0.02%)#841 |
| 17. | Carol Stream | 164 | 22,793(0.72%)#17 | 1,051,999(0.02%)#852 |
| 18. | Glendale Heights | 161 | 22,793(0.71%)#18 | 1,051,999(0.02%)#867 |
| 19. | Summit | 154 | 22,793(0.68%)#19 | 1,051,999(0.01%)#896 |
| 20. | Northlake | 146 | 22,793(0.64%)#20 | 1,051,999(0.01%)#935 |
| 21. | Hanover Park | 145 | 22,793(0.64%)#21 | 1,051,999(0.01%)#938 |
| 22. | Romeoville | 129 | 22,793(0.57%)#22 | 1,051,999(0.01%)#1,028 |
| 23. | Evanston | 128 | 22,793(0.56%)#23 | 1,051,999(0.01%)#1,037 |
| 24. | Harwood Heights | 126 | 22,793(0.55%)#24 | 1,051,999(0.01%)#1,051 |
| 25. | Des Plaines | 119 | 22,793(0.52%)#25 | 1,051,999(0.01%)#1,084 |
| 26. | Long Grove | 119 | 22,793(0.52%)#26 | 1,051,999(0.01%)#1,086 |
| 27. | Bolingbrook | 115 | 22,793(0.50%)#27 | 1,051,999(0.01%)#1,114 |
| 28. | Rockford | 111 | 22,793(0.49%)#28 | 1,051,999(0.01%)#1,131 |
| 29. | Skokie | 108 | 22,793(0.47%)#29 | 1,051,999(0.01%)#1,150 |
| 30. | West Chicago | 103 | 22,793(0.45%)#30 | 1,051,999(0.01%)#1,185 |
| 31. | Schiller Park | 100 | 22,793(0.44%)#31 | 1,051,999(0.01%)#1,203 |
| 32. | Gibson City | 99 | 22,793(0.43%)#32 | 1,051,999(0.01%)#1,217 |
| 33. | Downers Grove | 91 | 22,793(0.40%)#33 | 1,051,999(0.01%)#1,293 |
| 34. | Elmwood Park | 89 | 22,793(0.39%)#34 | 1,051,999(0.01%)#1,315 |
| 35. | Oak Park | 86 | 22,793(0.38%)#35 | 1,051,999(0.01%)#1,342 |
| 36. | Blue Island | 84 | 22,793(0.37%)#36 | 1,051,999(0.01%)#1,357 |
| 37. | Carpentersville | 81 | 22,793(0.36%)#37 | 1,051,999(0.01%)#1,382 |
| 38. | Berkeley | 80 | 22,793(0.35%)#38 | 1,051,999(0.01%)#1,396 |
| 39. | Elmhurst | 78 | 22,793(0.34%)#39 | 1,051,999(0.01%)#1,414 |
| 40. | Naperville | 76 | 22,793(0.33%)#40 | 1,051,999(0.01%)#1,425 |
| 41. | River Grove | 76 | 22,793(0.33%)#41 | 1,051,999(0.01%)#1,435 |
| 42. | Schaumburg | 74 | 22,793(0.32%)#42 | 1,051,999(0.01%)#1,451 |
| 43. | Bartlett | 74 | 22,793(0.32%)#43 | 1,051,999(0.01%)#1,453 |
| 44. | Harvey | 72 | 22,793(0.32%)#44 | 1,051,999(0.01%)#1,478 |
| 45. | Rantoul | 70 | 22,793(0.31%)#45 | 1,051,999(0.01%)#1,502 |
| 46. | Granite City | 67 | 22,793(0.29%)#46 | 1,051,999(0.01%)#1,534 |
| 47. | Normal | 66 | 22,793(0.29%)#47 | 1,051,999(0.01%)#1,547 |
| 48. | Norridge | 66 | 22,793(0.29%)#48 | 1,051,999(0.01%)#1,552 |
| 49. | Arlington Heights | 65 | 22,793(0.29%)#49 | 1,051,999(0.01%)#1,559 |
| 50. | Prospect Heights | 65 | 22,793(0.29%)#50 | 1,051,999(0.01%)#1,568 |
| 51. | New Baden | 65 | 22,793(0.29%)#51 | 1,051,999(0.01%)#1,576 |
| 52. | Orland Park | 62 | 22,793(0.27%)#52 | 1,051,999(0.01%)#1,610 |
| 53. | Wheaton | 62 | 22,793(0.27%)#53 | 1,051,999(0.01%)#1,611 |
| 54. | Collinsville | 62 | 22,793(0.27%)#54 | 1,051,999(0.01%)#1,613 |
| 55. | Roselle | 60 | 22,793(0.26%)#55 | 1,051,999(0.01%)#1,651 |
| 56. | Percy | 57 | 22,793(0.25%)#56 | 1,051,999(0.01%)#1,700 |
| 57. | Wood Dale | 56 | 22,793(0.25%)#57 | 1,051,999(0.01%)#1,706 |
| 58. | Zion | 54 | 22,793(0.24%)#58 | 1,051,999(0.01%)#1,743 |
| 59. | Itasca | 53 | 22,793(0.23%)#59 | 1,051,999(0.01%)#1,764 |
| 60. | Danville | 49 | 22,793(0.21%)#60 | 1,051,999(0.00%)#1,831 |
| 61. | Hoffman Estates | 46 | 22,793(0.20%)#61 | 1,051,999(0.00%)#1,881 |
| 62. | Dekalb | 46 | 22,793(0.20%)#62 | 1,051,999(0.00%)#1,884 |
| 63. | Franklin Park | 46 | 22,793(0.20%)#63 | 1,051,999(0.00%)#1,887 |
| 64. | Forest Park | 45 | 22,793(0.20%)#64 | 1,051,999(0.00%)#1,911 |
| 65. | Broadview | 45 | 22,793(0.20%)#65 | 1,051,999(0.00%)#1,917 |
| 66. | Herrin | 44 | 22,793(0.19%)#66 | 1,051,999(0.00%)#1,936 |
| 67. | Huntley | 43 | 22,793(0.19%)#67 | 1,051,999(0.00%)#1,948 |
| 68. | Beardstown | 42 | 22,793(0.18%)#68 | 1,051,999(0.00%)#1,973 |
| 69. | Glenview | 40 | 22,793(0.18%)#69 | 1,051,999(0.00%)#2,005 |
| 70. | Elk Grove Village | 39 | 22,793(0.17%)#70 | 1,051,999(0.00%)#2,043 |
| 71. | Algonquin | 39 | 22,793(0.17%)#71 | 1,051,999(0.00%)#2,044 |
| 72. | Lake In The Hills | 39 | 22,793(0.17%)#72 | 1,051,999(0.00%)#2,045 |
| 73. | Chicago Heights | 38 | 22,793(0.17%)#73 | 1,051,999(0.00%)#2,071 |
| 74. | Crest Hill | 38 | 22,793(0.17%)#74 | 1,051,999(0.00%)#2,078 |
| 75. | Lake Forest | 37 | 22,793(0.16%)#75 | 1,051,999(0.00%)#2,107 |
| 76. | Marion | 37 | 22,793(0.16%)#76 | 1,051,999(0.00%)#2,111 |
| 77. | Murphysboro | 37 | 22,793(0.16%)#77 | 1,051,999(0.00%)#2,117 |
| 78. | Rosemont | 37 | 22,793(0.16%)#78 | 1,051,999(0.00%)#2,121 |
| 79. | Peoria | 36 | 22,793(0.16%)#79 | 1,051,999(0.00%)#2,130 |
| 80. | Rock Island | 36 | 22,793(0.16%)#80 | 1,051,999(0.00%)#2,133 |
| 81. | Bellwood | 36 | 22,793(0.16%)#81 | 1,051,999(0.00%)#2,141 |
| 82. | Sterling | 35 | 22,793(0.15%)#82 | 1,051,999(0.00%)#2,179 |
| 83. | Robbins | 35 | 22,793(0.15%)#83 | 1,051,999(0.00%)#2,187 |
| 84. | Springfield | 34 | 22,793(0.15%)#84 | 1,051,999(0.00%)#2,194 |
| 85. | Palatine | 34 | 22,793(0.15%)#85 | 1,051,999(0.00%)#2,197 |
| 86. | Columbia | 34 | 22,793(0.15%)#86 | 1,051,999(0.00%)#2,210 |
| 87. | Lombard | 33 | 22,793(0.14%)#87 | 1,051,999(0.00%)#2,229 |
| 88. | Rolling Meadows | 32 | 22,793(0.14%)#88 | 1,051,999(0.00%)#2,263 |
| 89. | Hillside | 32 | 22,793(0.14%)#89 | 1,051,999(0.00%)#2,277 |
| 90. | Buffalo Grove | 31 | 22,793(0.14%)#90 | 1,051,999(0.00%)#2,293 |
| 91. | Loves Park | 31 | 22,793(0.14%)#91 | 1,051,999(0.00%)#2,297 |
| 92. | Lincolnwood | 30 | 22,793(0.13%)#92 | 1,051,999(0.00%)#2,326 |
| 93. | Lake Zurich | 29 | 22,793(0.13%)#93 | 1,051,999(0.00%)#2,361 |
| 94. | Alsip | 29 | 22,793(0.13%)#94 | 1,051,999(0.00%)#2,363 |
| 95. | Beach Park | 29 | 22,793(0.13%)#95 | 1,051,999(0.00%)#2,369 |
| 96. | Glen Ellyn | 28 | 22,793(0.12%)#96 | 1,051,999(0.00%)#2,386 |
| 97. | Westchester | 28 | 22,793(0.12%)#97 | 1,051,999(0.00%)#2,392 |
| 98. | Mendota | 28 | 22,793(0.12%)#98 | 1,051,999(0.00%)#2,400 |
| 99. | Batavia | 27 | 22,793(0.12%)#99 | 1,051,999(0.00%)#2,427 |
| 100. | Spring Valley | 27 | 22,793(0.12%)#100 | 1,051,999(0.00%)#2,442 |
Common Questions
What are the Top 10 Cities with the Most Immigrants from Guatemala in Illinois?
Top 10 Cities with the Most Immigrants from Guatemala in Illinois are:
#1
10,661
#2
789
#3
676
#4
484
#5
478
#6
275
#7
269
#8
224
#9
202
#10
189
What city has the Most Immigrants from Guatemala in Illinois?
Chicago has the Most Immigrants from Guatemala in Illinois with 10,661.
What is the Total Immigrants from Guatemala in the State of Illinois?
Total Immigrants from Guatemala in Illinois is 22,793.
What is the Total Immigrants from Guatemala in the United States?
Total Immigrants from Guatemala in the United States is 1,051,999.