Cities with the Most Immigrants from Guatemala in North Carolina
RELATED REPORTS & OPTIONS
Guatemala
North Carolina
Compare Cities
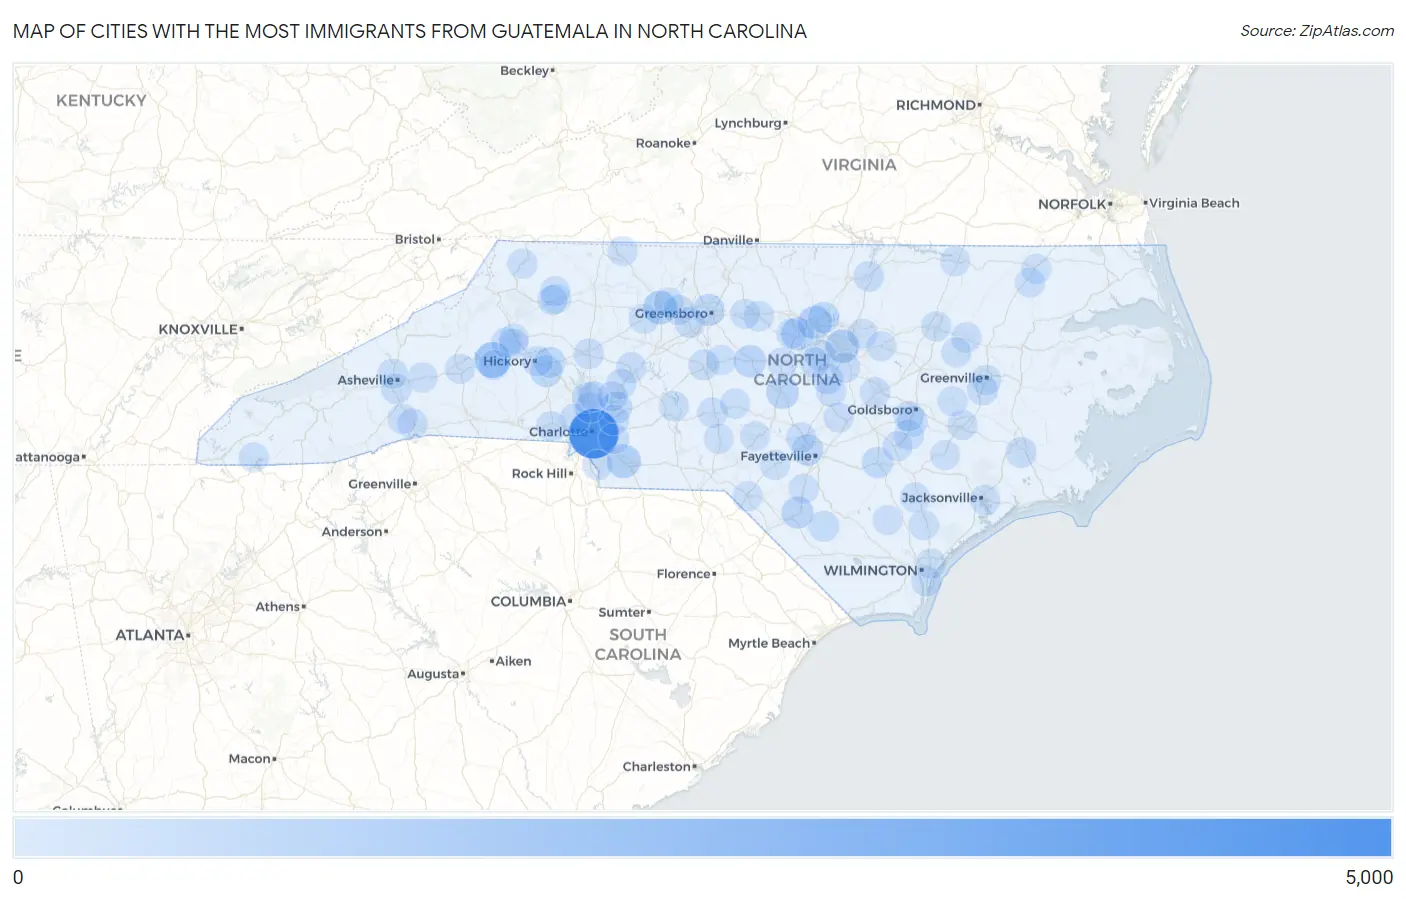
Map of Cities with the Most Immigrants from Guatemala in North Carolina
0
5,000
Cities with the Most Immigrants from Guatemala in North Carolina
| City | Guatemala | vs State | vs National | |
| 1. | Charlotte | 4,097 | 22,964(17.84%)#1 | 1,051,999(0.39%)#21 |
| 2. | Morganton | 1,172 | 22,964(5.10%)#2 | 1,051,999(0.11%)#135 |
| 3. | Winston Salem | 724 | 22,964(3.15%)#3 | 1,051,999(0.07%)#226 |
| 4. | Monroe | 723 | 22,964(3.15%)#4 | 1,051,999(0.07%)#227 |
| 5. | Durham | 699 | 22,964(3.04%)#5 | 1,051,999(0.07%)#235 |
| 6. | Raleigh | 683 | 22,964(2.97%)#6 | 1,051,999(0.06%)#243 |
| 7. | Chapel Hill | 584 | 22,964(2.54%)#7 | 1,051,999(0.06%)#298 |
| 8. | Sanford | 511 | 22,964(2.23%)#8 | 1,051,999(0.05%)#339 |
| 9. | Siler City | 457 | 22,964(1.99%)#9 | 1,051,999(0.04%)#365 |
| 10. | Lumberton | 401 | 22,964(1.75%)#10 | 1,051,999(0.04%)#402 |
| 11. | Greensboro | 375 | 22,964(1.63%)#11 | 1,051,999(0.04%)#422 |
| 12. | Newton | 366 | 22,964(1.59%)#12 | 1,051,999(0.03%)#429 |
| 13. | Concord | 338 | 22,964(1.47%)#13 | 1,051,999(0.03%)#462 |
| 14. | Dudley | 336 | 22,964(1.46%)#14 | 1,051,999(0.03%)#469 |
| 15. | Fayetteville | 330 | 22,964(1.44%)#15 | 1,051,999(0.03%)#474 |
| 16. | Clinton | 268 | 22,964(1.17%)#16 | 1,051,999(0.03%)#561 |
| 17. | Gorman | 250 | 22,964(1.09%)#17 | 1,051,999(0.02%)#589 |
| 18. | Cary | 209 | 22,964(0.91%)#18 | 1,051,999(0.02%)#687 |
| 19. | Conover | 187 | 22,964(0.81%)#19 | 1,051,999(0.02%)#768 |
| 20. | Bladenboro | 170 | 22,964(0.74%)#20 | 1,051,999(0.02%)#826 |
| 21. | Fuquay Varina | 163 | 22,964(0.71%)#21 | 1,051,999(0.02%)#857 |
| 22. | High Point | 156 | 22,964(0.68%)#22 | 1,051,999(0.01%)#882 |
| 23. | New Bern | 154 | 22,964(0.67%)#23 | 1,051,999(0.01%)#894 |
| 24. | Cornelius | 151 | 22,964(0.66%)#24 | 1,051,999(0.01%)#905 |
| 25. | Asheboro | 144 | 22,964(0.63%)#25 | 1,051,999(0.01%)#947 |
| 26. | Winterville | 144 | 22,964(0.63%)#26 | 1,051,999(0.01%)#949 |
| 27. | Asheville | 123 | 22,964(0.54%)#27 | 1,051,999(0.01%)#1,061 |
| 28. | Henderson | 122 | 22,964(0.53%)#28 | 1,051,999(0.01%)#1,068 |
| 29. | Hickory | 100 | 22,964(0.44%)#29 | 1,051,999(0.01%)#1,199 |
| 30. | Smithfield | 99 | 22,964(0.43%)#30 | 1,051,999(0.01%)#1,213 |
| 31. | Mint Hill | 97 | 22,964(0.42%)#31 | 1,051,999(0.01%)#1,235 |
| 32. | Statesville | 95 | 22,964(0.41%)#32 | 1,051,999(0.01%)#1,248 |
| 33. | Marvin | 92 | 22,964(0.40%)#33 | 1,051,999(0.01%)#1,284 |
| 34. | East Flat Rock | 91 | 22,964(0.40%)#34 | 1,051,999(0.01%)#1,301 |
| 35. | Pittsboro | 91 | 22,964(0.40%)#35 | 1,051,999(0.01%)#1,302 |
| 36. | Salisbury | 89 | 22,964(0.39%)#36 | 1,051,999(0.01%)#1,314 |
| 37. | Mount Holly | 89 | 22,964(0.39%)#37 | 1,051,999(0.01%)#1,317 |
| 38. | Brogden | 89 | 22,964(0.39%)#38 | 1,051,999(0.01%)#1,323 |
| 39. | Mount Olive | 84 | 22,964(0.37%)#39 | 1,051,999(0.01%)#1,361 |
| 40. | Angier | 75 | 22,964(0.33%)#40 | 1,051,999(0.01%)#1,448 |
| 41. | Harrisburg | 74 | 22,964(0.32%)#41 | 1,051,999(0.01%)#1,454 |
| 42. | Graham | 74 | 22,964(0.32%)#42 | 1,051,999(0.01%)#1,456 |
| 43. | Salem | 70 | 22,964(0.30%)#43 | 1,051,999(0.01%)#1,508 |
| 44. | Apex | 68 | 22,964(0.30%)#44 | 1,051,999(0.01%)#1,519 |
| 45. | Burgaw | 67 | 22,964(0.29%)#45 | 1,051,999(0.01%)#1,542 |
| 46. | Biscoe | 67 | 22,964(0.29%)#46 | 1,051,999(0.01%)#1,543 |
| 47. | Gastonia | 63 | 22,964(0.27%)#47 | 1,051,999(0.01%)#1,594 |
| 48. | Tarboro | 63 | 22,964(0.27%)#48 | 1,051,999(0.01%)#1,603 |
| 49. | Woodfin | 63 | 22,964(0.27%)#49 | 1,051,999(0.01%)#1,606 |
| 50. | Jacksonville | 62 | 22,964(0.27%)#50 | 1,051,999(0.01%)#1,608 |
| 51. | Mar Mac | 61 | 22,964(0.27%)#51 | 1,051,999(0.01%)#1,642 |
| 52. | Greenville | 58 | 22,964(0.25%)#52 | 1,051,999(0.01%)#1,673 |
| 53. | Huntersville | 58 | 22,964(0.25%)#53 | 1,051,999(0.01%)#1,674 |
| 54. | China Grove | 53 | 22,964(0.23%)#54 | 1,051,999(0.01%)#1,769 |
| 55. | Rocky Mount | 52 | 22,964(0.23%)#55 | 1,051,999(0.00%)#1,775 |
| 56. | Erwin | 51 | 22,964(0.22%)#56 | 1,051,999(0.00%)#1,806 |
| 57. | Gamewell | 46 | 22,964(0.20%)#57 | 1,051,999(0.00%)#1,894 |
| 58. | Silver Lake | 45 | 22,964(0.20%)#58 | 1,051,999(0.00%)#1,920 |
| 59. | Kannapolis | 42 | 22,964(0.18%)#59 | 1,051,999(0.00%)#1,963 |
| 60. | Spring Lake | 42 | 22,964(0.18%)#60 | 1,051,999(0.00%)#1,969 |
| 61. | Garner | 40 | 22,964(0.17%)#61 | 1,051,999(0.00%)#2,007 |
| 62. | Kernersville | 40 | 22,964(0.17%)#62 | 1,051,999(0.00%)#2,008 |
| 63. | Kinston | 39 | 22,964(0.17%)#63 | 1,051,999(0.00%)#2,048 |
| 64. | Davidson | 37 | 22,964(0.16%)#64 | 1,051,999(0.00%)#2,112 |
| 65. | Badin | 35 | 22,964(0.15%)#65 | 1,051,999(0.00%)#2,189 |
| 66. | St Pauls | 34 | 22,964(0.15%)#66 | 1,051,999(0.00%)#2,220 |
| 67. | Black Mountain | 33 | 22,964(0.14%)#67 | 1,051,999(0.00%)#2,247 |
| 68. | Norman | 33 | 22,964(0.14%)#68 | 1,051,999(0.00%)#2,253 |
| 69. | Rolesville | 32 | 22,964(0.14%)#69 | 1,051,999(0.00%)#2,274 |
| 70. | Winton | 32 | 22,964(0.14%)#70 | 1,051,999(0.00%)#2,286 |
| 71. | Southern Pines | 31 | 22,964(0.13%)#71 | 1,051,999(0.00%)#2,299 |
| 72. | Pink Hill | 28 | 22,964(0.12%)#72 | 1,051,999(0.00%)#2,417 |
| 73. | Carrboro | 27 | 22,964(0.12%)#73 | 1,051,999(0.00%)#2,429 |
| 74. | Raeford | 27 | 22,964(0.12%)#74 | 1,051,999(0.00%)#2,443 |
| 75. | Clemmons | 26 | 22,964(0.11%)#75 | 1,051,999(0.00%)#2,467 |
| 76. | Marion | 26 | 22,964(0.11%)#76 | 1,051,999(0.00%)#2,474 |
| 77. | North Wilkesboro | 26 | 22,964(0.11%)#77 | 1,051,999(0.00%)#2,478 |
| 78. | Burlington | 24 | 22,964(0.10%)#78 | 1,051,999(0.00%)#2,538 |
| 79. | Kings Grant | 24 | 22,964(0.10%)#79 | 1,051,999(0.00%)#2,550 |
| 80. | Wallace | 24 | 22,964(0.10%)#80 | 1,051,999(0.00%)#2,563 |
| 81. | Cajah S Mountain | 24 | 22,964(0.10%)#81 | 1,051,999(0.00%)#2,565 |
| 82. | Robbins | 24 | 22,964(0.10%)#82 | 1,051,999(0.00%)#2,573 |
| 83. | Franklinville | 24 | 22,964(0.10%)#83 | 1,051,999(0.00%)#2,574 |
| 84. | Jefferson | 22 | 22,964(0.10%)#84 | 1,051,999(0.00%)#2,661 |
| 85. | Ahoskie | 21 | 22,964(0.09%)#85 | 1,051,999(0.00%)#2,699 |
| 86. | Roanoke Rapids | 20 | 22,964(0.09%)#86 | 1,051,999(0.00%)#2,734 |
| 87. | Mulberry | 20 | 22,964(0.09%)#87 | 1,051,999(0.00%)#2,757 |
| 88. | Flat Rock | 19 | 22,964(0.08%)#88 | 1,051,999(0.00%)#2,811 |
| 89. | Laurinburg | 17 | 22,964(0.07%)#89 | 1,051,999(0.00%)#2,890 |
| 90. | Pinetops | 17 | 22,964(0.07%)#90 | 1,051,999(0.00%)#2,920 |
| 91. | Faison | 17 | 22,964(0.07%)#91 | 1,051,999(0.00%)#2,922 |
| 92. | Lenoir | 16 | 22,964(0.07%)#92 | 1,051,999(0.00%)#2,946 |
| 93. | Zebulon | 16 | 22,964(0.07%)#93 | 1,051,999(0.00%)#2,960 |
| 94. | Laurel Park | 16 | 22,964(0.07%)#94 | 1,051,999(0.00%)#2,975 |
| 95. | Ivanhoe | 16 | 22,964(0.07%)#95 | 1,051,999(0.00%)#2,987 |
| 96. | Cricket | 15 | 22,964(0.07%)#96 | 1,051,999(0.00%)#3,036 |
| 97. | Walkertown | 14 | 22,964(0.06%)#97 | 1,051,999(0.00%)#3,090 |
| 98. | Snow Hill | 14 | 22,964(0.06%)#98 | 1,051,999(0.00%)#3,108 |
| 99. | Hayesville | 14 | 22,964(0.06%)#99 | 1,051,999(0.00%)#3,122 |
| 100. | Anderson Creek | 13 | 22,964(0.06%)#100 | 1,051,999(0.00%)#3,152 |
Common Questions
What are the Top 10 Cities with the Most Immigrants from Guatemala in North Carolina?
Top 10 Cities with the Most Immigrants from Guatemala in North Carolina are:
#1
4,097
#2
1,172
#3
724
#4
723
#5
699
#6
683
#7
584
#8
511
#9
457
#10
401
What city has the Most Immigrants from Guatemala in North Carolina?
Charlotte has the Most Immigrants from Guatemala in North Carolina with 4,097.
What is the Total Immigrants from Guatemala in the State of North Carolina?
Total Immigrants from Guatemala in North Carolina is 22,964.
What is the Total Immigrants from Guatemala in the United States?
Total Immigrants from Guatemala in the United States is 1,051,999.