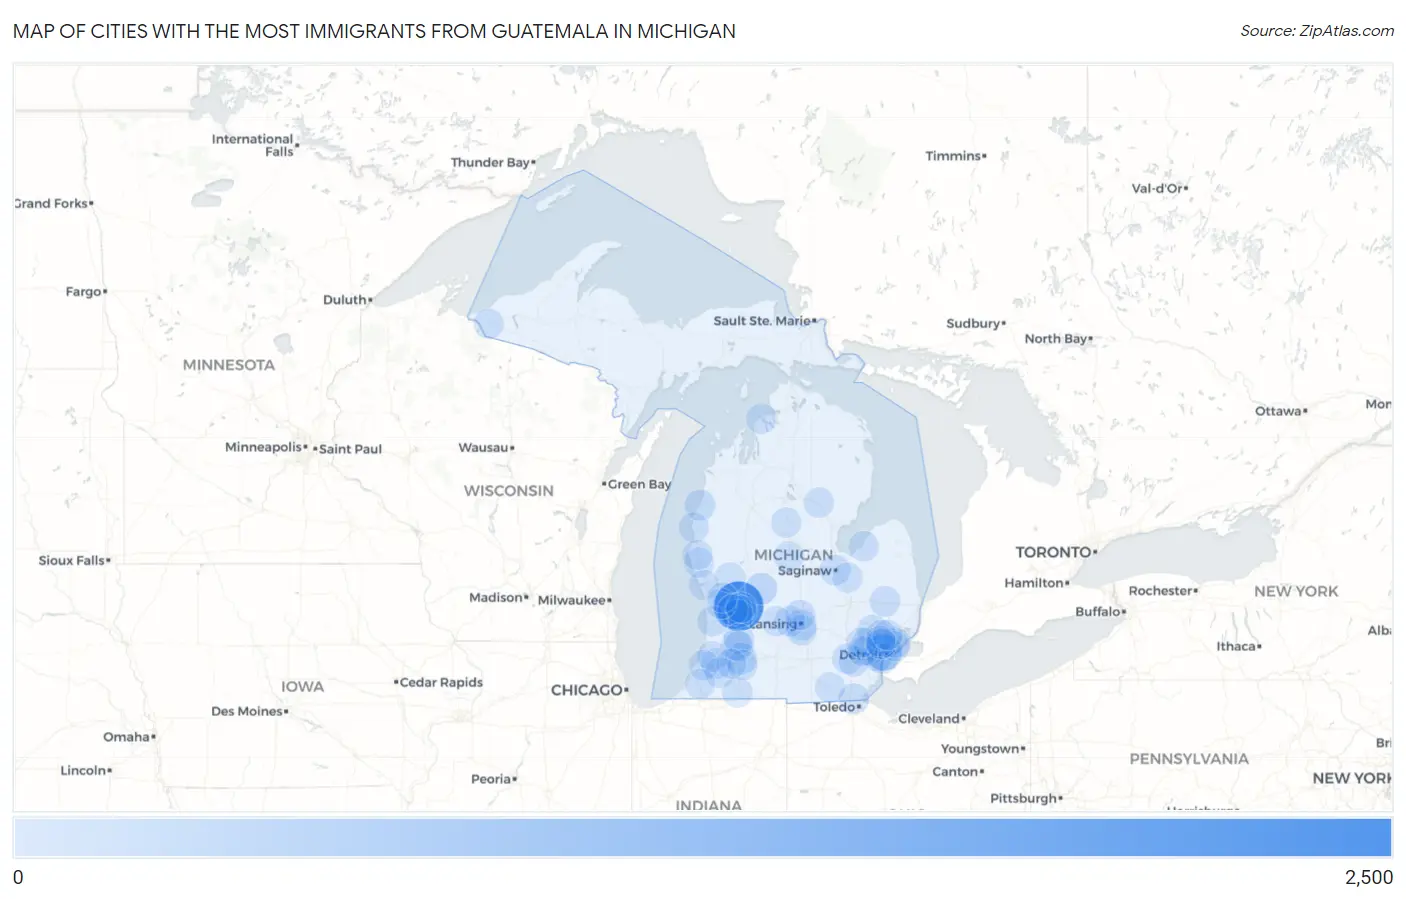
Cities with the Most Immigrants from Guatemala in Michigan
RELATED REPORTS & OPTIONS
Guatemala
Michigan
Compare Cities
Map of Cities with the Most Immigrants from Guatemala in Michigan
0
2,500
Cities with the Most Immigrants from Guatemala in Michigan
| City | Guatemala | vs State | vs National | |
| 1. | Grand Rapids | 2,205 | 7,097(31.07%)#1 | 1,051,999(0.21%)#54 |
| 2. | Detroit | 674 | 7,097(9.50%)#2 | 1,051,999(0.06%)#250 |
| 3. | Wyoming | 558 | 7,097(7.86%)#3 | 1,051,999(0.05%)#313 |
| 4. | Greenville | 167 | 7,097(2.35%)#4 | 1,051,999(0.02%)#833 |
| 5. | Kalamazoo | 145 | 7,097(2.04%)#5 | 1,051,999(0.01%)#936 |
| 6. | Kentwood | 129 | 7,097(1.82%)#6 | 1,051,999(0.01%)#1,026 |
| 7. | Lansing | 75 | 7,097(1.06%)#7 | 1,051,999(0.01%)#1,440 |
| 8. | Livonia | 70 | 7,097(0.99%)#8 | 1,051,999(0.01%)#1,494 |
| 9. | Cutlerville | 70 | 7,097(0.99%)#9 | 1,051,999(0.01%)#1,499 |
| 10. | Manistee | 70 | 7,097(0.99%)#10 | 1,051,999(0.01%)#1,506 |
| 11. | Holt | 57 | 7,097(0.80%)#11 | 1,051,999(0.01%)#1,696 |
| 12. | Lambertville | 56 | 7,097(0.79%)#12 | 1,051,999(0.01%)#1,709 |
| 13. | Pontiac | 53 | 7,097(0.75%)#13 | 1,051,999(0.01%)#1,755 |
| 14. | Lawrence | 50 | 7,097(0.70%)#14 | 1,051,999(0.00%)#1,823 |
| 15. | Grandville | 47 | 7,097(0.66%)#15 | 1,051,999(0.00%)#1,869 |
| 16. | Saginaw | 46 | 7,097(0.65%)#16 | 1,051,999(0.00%)#1,883 |
| 17. | Otsego | 44 | 7,097(0.62%)#17 | 1,051,999(0.00%)#1,943 |
| 18. | Bangor | 44 | 7,097(0.62%)#18 | 1,051,999(0.00%)#1,944 |
| 19. | Ann Arbor | 43 | 7,097(0.61%)#19 | 1,051,999(0.00%)#1,946 |
| 20. | Imlay City | 41 | 7,097(0.58%)#20 | 1,051,999(0.00%)#1,998 |
| 21. | Holland | 39 | 7,097(0.55%)#21 | 1,051,999(0.00%)#2,041 |
| 22. | Grand Ledge | 36 | 7,097(0.51%)#22 | 1,051,999(0.00%)#2,153 |
| 23. | Ypsilanti | 35 | 7,097(0.49%)#23 | 1,051,999(0.00%)#2,172 |
| 24. | Dearborn | 34 | 7,097(0.48%)#24 | 1,051,999(0.00%)#2,195 |
| 25. | Dewitt | 30 | 7,097(0.42%)#25 | 1,051,999(0.00%)#2,338 |
| 26. | Falmouth | 21 | 7,097(0.30%)#26 | 1,051,999(0.00%)#2,714 |
| 27. | Allendale | 20 | 7,097(0.28%)#27 | 1,051,999(0.00%)#2,724 |
| 28. | Martin | 19 | 7,097(0.27%)#28 | 1,051,999(0.00%)#2,815 |
| 29. | Warren | 18 | 7,097(0.25%)#29 | 1,051,999(0.00%)#2,817 |
| 30. | Farmington Hills | 18 | 7,097(0.25%)#30 | 1,051,999(0.00%)#2,818 |
| 31. | Frankenmuth | 18 | 7,097(0.25%)#31 | 1,051,999(0.00%)#2,852 |
| 32. | River Rouge | 16 | 7,097(0.23%)#32 | 1,051,999(0.00%)#2,961 |
| 33. | Constantine | 15 | 7,097(0.21%)#33 | 1,051,999(0.00%)#3,039 |
| 34. | Sebewaing | 15 | 7,097(0.21%)#34 | 1,051,999(0.00%)#3,042 |
| 35. | St Clair Shores | 14 | 7,097(0.20%)#35 | 1,051,999(0.00%)#3,054 |
| 36. | Decatur | 14 | 7,097(0.20%)#36 | 1,051,999(0.00%)#3,111 |
| 37. | Adrian | 13 | 7,097(0.18%)#37 | 1,051,999(0.00%)#3,140 |
| 38. | East Grand Rapids | 13 | 7,097(0.18%)#38 | 1,051,999(0.00%)#3,155 |
| 39. | Ludington | 13 | 7,097(0.18%)#39 | 1,051,999(0.00%)#3,162 |
| 40. | Troy | 12 | 7,097(0.17%)#40 | 1,051,999(0.00%)#3,190 |
| 41. | Grosse Pointe Woods | 11 | 7,097(0.15%)#41 | 1,051,999(0.00%)#3,295 |
| 42. | Portage | 9 | 7,097(0.13%)#42 | 1,051,999(0.00%)#3,450 |
| 43. | Plymouth | 8 | 7,097(0.11%)#43 | 1,051,999(0.00%)#3,586 |
| 44. | West Branch | 8 | 7,097(0.11%)#44 | 1,051,999(0.00%)#3,617 |
| 45. | Grant | 8 | 7,097(0.11%)#45 | 1,051,999(0.00%)#3,631 |
| 46. | Mount Pleasant | 7 | 7,097(0.10%)#46 | 1,051,999(0.00%)#3,660 |
| 47. | Rothbury | 7 | 7,097(0.10%)#47 | 1,051,999(0.00%)#3,738 |
| 48. | Novi | 6 | 7,097(0.08%)#48 | 1,051,999(0.00%)#3,744 |
| 49. | Plainwell | 6 | 7,097(0.08%)#49 | 1,051,999(0.00%)#3,793 |
| 50. | Harrison | 6 | 7,097(0.08%)#50 | 1,051,999(0.00%)#3,806 |
| 51. | Royal Oak | 5 | 7,097(0.07%)#51 | 1,051,999(0.00%)#3,856 |
| 52. | Watervliet | 5 | 7,097(0.07%)#52 | 1,051,999(0.00%)#3,916 |
| 53. | Pleasant Ridge | 4 | 7,097(0.06%)#53 | 1,051,999(0.00%)#3,993 |
| 54. | Shelby | 4 | 7,097(0.06%)#54 | 1,051,999(0.00%)#3,995 |
| 55. | Berrien Springs | 4 | 7,097(0.06%)#55 | 1,051,999(0.00%)#4,005 |
| 56. | Mattawan | 3 | 7,097(0.04%)#56 | 1,051,999(0.00%)#4,097 |
| 57. | Muskegon | 2 | 7,097(0.03%)#57 | 1,051,999(0.00%)#4,160 |
| 58. | Sunfield | 2 | 7,097(0.03%)#58 | 1,051,999(0.00%)#4,238 |
| 59. | Sterling Heights | 1 | 7,097(0.01%)#59 | 1,051,999(0.00%)#4,271 |
| 60. | Coopersville | 1 | 7,097(0.01%)#60 | 1,051,999(0.00%)#4,318 |
| 61. | Charlevoix | 1 | 7,097(0.01%)#61 | 1,051,999(0.00%)#4,334 |
| 62. | Bessemer | 1 | 7,097(0.01%)#62 | 1,051,999(0.00%)#4,343 |
Common Questions
What are the Top 10 Cities with the Most Immigrants from Guatemala in Michigan?
Top 10 Cities with the Most Immigrants from Guatemala in Michigan are:
#1
2,205
#2
674
#3
558
#4
167
#5
145
#6
129
#7
75
#8
70
#9
70
#10
70
What city has the Most Immigrants from Guatemala in Michigan?
Grand Rapids has the Most Immigrants from Guatemala in Michigan with 2,205.
What is the Total Immigrants from Guatemala in the State of Michigan?
Total Immigrants from Guatemala in Michigan is 7,097.
What is the Total Immigrants from Guatemala in the United States?
Total Immigrants from Guatemala in the United States is 1,051,999.