Cities with the Most Immigrants from Guatemala in Minnesota
RELATED REPORTS & OPTIONS
Guatemala
Minnesota
Compare Cities
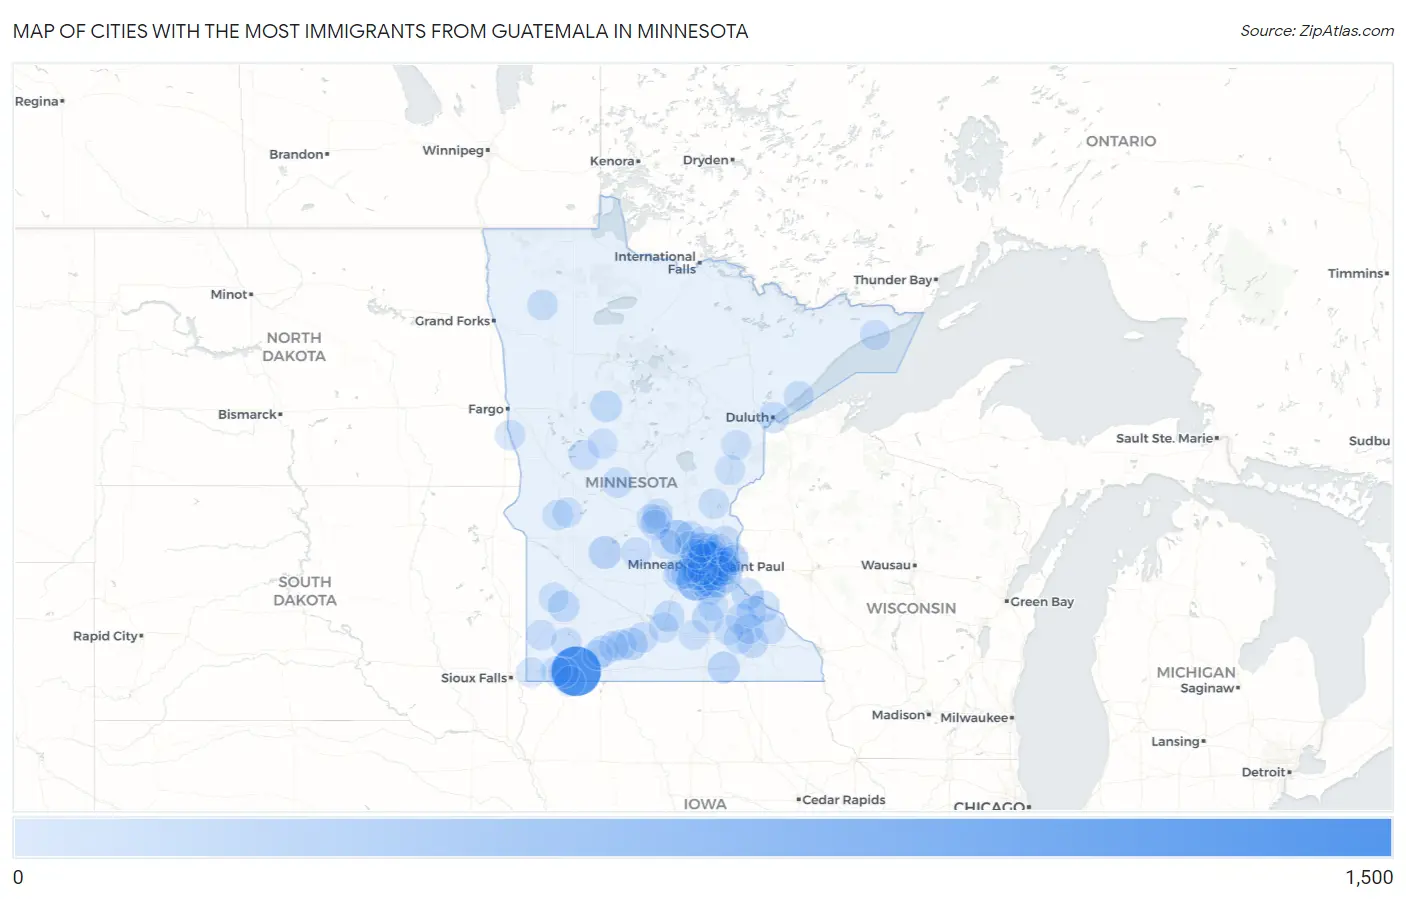
Map of Cities with the Most Immigrants from Guatemala in Minnesota
0
1,500
Cities with the Most Immigrants from Guatemala in Minnesota
| City | Guatemala | vs State | vs National | |
| 1. | Worthington | 1,094 | 6,706(16.31%)#1 | 1,051,999(0.10%)#149 |
| 2. | Minneapolis | 619 | 6,706(9.23%)#2 | 1,051,999(0.06%)#280 |
| 3. | Shakopee | 475 | 6,706(7.08%)#3 | 1,051,999(0.05%)#361 |
| 4. | Brooklyn Center | 310 | 6,706(4.62%)#4 | 1,051,999(0.03%)#504 |
| 5. | Monticello | 266 | 6,706(3.97%)#5 | 1,051,999(0.03%)#566 |
| 6. | St Paul | 203 | 6,706(3.03%)#6 | 1,051,999(0.02%)#702 |
| 7. | Plymouth | 191 | 6,706(2.85%)#7 | 1,051,999(0.02%)#746 |
| 8. | Willmar | 146 | 6,706(2.18%)#8 | 1,051,999(0.01%)#933 |
| 9. | Bloomington | 139 | 6,706(2.07%)#9 | 1,051,999(0.01%)#976 |
| 10. | St James | 120 | 6,706(1.79%)#10 | 1,051,999(0.01%)#1,080 |
| 11. | Austin | 107 | 6,706(1.60%)#11 | 1,051,999(0.01%)#1,160 |
| 12. | Red Wing | 94 | 6,706(1.40%)#12 | 1,051,999(0.01%)#1,258 |
| 13. | Lakeville | 89 | 6,706(1.33%)#13 | 1,051,999(0.01%)#1,313 |
| 14. | Lake City | 88 | 6,706(1.31%)#14 | 1,051,999(0.01%)#1,329 |
| 15. | Marshall | 83 | 6,706(1.24%)#15 | 1,051,999(0.01%)#1,372 |
| 16. | Burnsville | 82 | 6,706(1.22%)#16 | 1,051,999(0.01%)#1,373 |
| 17. | Park Rapids | 82 | 6,706(1.22%)#17 | 1,051,999(0.01%)#1,378 |
| 18. | St Peter | 79 | 6,706(1.18%)#18 | 1,051,999(0.01%)#1,410 |
| 19. | Columbia Heights | 75 | 6,706(1.12%)#19 | 1,051,999(0.01%)#1,446 |
| 20. | Apple Valley | 68 | 6,706(1.01%)#20 | 1,051,999(0.01%)#1,520 |
| 21. | Faribault | 68 | 6,706(1.01%)#21 | 1,051,999(0.01%)#1,523 |
| 22. | Windom | 67 | 6,706(1.00%)#22 | 1,051,999(0.01%)#1,541 |
| 23. | Roseville | 63 | 6,706(0.94%)#23 | 1,051,999(0.01%)#1,599 |
| 24. | Coon Rapids | 54 | 6,706(0.81%)#24 | 1,051,999(0.01%)#1,738 |
| 25. | Duluth | 53 | 6,706(0.79%)#25 | 1,051,999(0.01%)#1,753 |
| 26. | Richfield | 53 | 6,706(0.79%)#26 | 1,051,999(0.01%)#1,757 |
| 27. | Zumbrota | 52 | 6,706(0.78%)#27 | 1,051,999(0.00%)#1,786 |
| 28. | Crystal | 51 | 6,706(0.76%)#28 | 1,051,999(0.00%)#1,794 |
| 29. | Rochester | 48 | 6,706(0.72%)#29 | 1,051,999(0.00%)#1,845 |
| 30. | St Louis Park | 46 | 6,706(0.69%)#30 | 1,051,999(0.00%)#1,882 |
| 31. | Waconia | 46 | 6,706(0.69%)#31 | 1,051,999(0.00%)#1,890 |
| 32. | New Brighton | 44 | 6,706(0.66%)#32 | 1,051,999(0.00%)#1,931 |
| 33. | Forest Lake | 44 | 6,706(0.66%)#33 | 1,051,999(0.00%)#1,932 |
| 34. | Golden Valley | 43 | 6,706(0.64%)#34 | 1,051,999(0.00%)#1,950 |
| 35. | Savage | 41 | 6,706(0.61%)#35 | 1,051,999(0.00%)#1,982 |
| 36. | Butterfield | 40 | 6,706(0.60%)#36 | 1,051,999(0.00%)#2,034 |
| 37. | Eden Prairie | 39 | 6,706(0.58%)#37 | 1,051,999(0.00%)#2,037 |
| 38. | Elk River | 39 | 6,706(0.58%)#38 | 1,051,999(0.00%)#2,046 |
| 39. | Bigelow | 39 | 6,706(0.58%)#39 | 1,051,999(0.00%)#2,064 |
| 40. | Cottage Grove | 35 | 6,706(0.52%)#40 | 1,051,999(0.00%)#2,167 |
| 41. | Thief River Falls | 33 | 6,706(0.49%)#41 | 1,051,999(0.00%)#2,245 |
| 42. | Minnetonka | 31 | 6,706(0.46%)#42 | 1,051,999(0.00%)#2,289 |
| 43. | Deephaven | 31 | 6,706(0.46%)#43 | 1,051,999(0.00%)#2,309 |
| 44. | Rogers | 30 | 6,706(0.45%)#44 | 1,051,999(0.00%)#2,325 |
| 45. | Long Prairie | 30 | 6,706(0.45%)#45 | 1,051,999(0.00%)#2,340 |
| 46. | Mounds View | 28 | 6,706(0.42%)#46 | 1,051,999(0.00%)#2,396 |
| 47. | Blaine | 27 | 6,706(0.40%)#47 | 1,051,999(0.00%)#2,419 |
| 48. | St Bonifacius | 27 | 6,706(0.40%)#48 | 1,051,999(0.00%)#2,448 |
| 49. | Henning | 27 | 6,706(0.40%)#49 | 1,051,999(0.00%)#2,454 |
| 50. | Woodbury | 26 | 6,706(0.39%)#50 | 1,051,999(0.00%)#2,457 |
| 51. | Sauk Rapids | 25 | 6,706(0.37%)#51 | 1,051,999(0.00%)#2,510 |
| 52. | Plainview | 24 | 6,706(0.36%)#52 | 1,051,999(0.00%)#2,562 |
| 53. | Morris | 23 | 6,706(0.34%)#53 | 1,051,999(0.00%)#2,612 |
| 54. | Mountain Lake | 23 | 6,706(0.34%)#54 | 1,051,999(0.00%)#2,619 |
| 55. | North St Paul | 22 | 6,706(0.33%)#55 | 1,051,999(0.00%)#2,643 |
| 56. | Rushmore | 22 | 6,706(0.33%)#56 | 1,051,999(0.00%)#2,667 |
| 57. | Brooklyn Park | 21 | 6,706(0.31%)#57 | 1,051,999(0.00%)#2,669 |
| 58. | Arden Hills | 21 | 6,706(0.31%)#58 | 1,051,999(0.00%)#2,689 |
| 59. | Adrian | 21 | 6,706(0.31%)#59 | 1,051,999(0.00%)#2,709 |
| 60. | Holland | 21 | 6,706(0.31%)#60 | 1,051,999(0.00%)#2,713 |
| 61. | Fridley | 20 | 6,706(0.30%)#61 | 1,051,999(0.00%)#2,720 |
| 62. | Rosemount | 20 | 6,706(0.30%)#62 | 1,051,999(0.00%)#2,723 |
| 63. | Madelia | 19 | 6,706(0.28%)#63 | 1,051,999(0.00%)#2,805 |
| 64. | Oakdale | 18 | 6,706(0.27%)#64 | 1,051,999(0.00%)#2,824 |
| 65. | Kasson | 18 | 6,706(0.27%)#65 | 1,051,999(0.00%)#2,848 |
| 66. | Litchfield | 18 | 6,706(0.27%)#66 | 1,051,999(0.00%)#2,849 |
| 67. | Slayton | 18 | 6,706(0.27%)#67 | 1,051,999(0.00%)#2,860 |
| 68. | Wolverton | 18 | 6,706(0.27%)#68 | 1,051,999(0.00%)#2,872 |
| 69. | Landfall | 17 | 6,706(0.25%)#69 | 1,051,999(0.00%)#2,925 |
| 70. | New Hope | 16 | 6,706(0.24%)#70 | 1,051,999(0.00%)#2,939 |
| 71. | Victoria | 16 | 6,706(0.24%)#71 | 1,051,999(0.00%)#2,957 |
| 72. | Eagan | 15 | 6,706(0.22%)#72 | 1,051,999(0.00%)#2,992 |
| 73. | Stillwater | 15 | 6,706(0.22%)#73 | 1,051,999(0.00%)#3,003 |
| 74. | Grand Marais | 15 | 6,706(0.22%)#74 | 1,051,999(0.00%)#3,043 |
| 75. | South St Paul | 14 | 6,706(0.21%)#75 | 1,051,999(0.00%)#3,072 |
| 76. | St Cloud | 13 | 6,706(0.19%)#76 | 1,051,999(0.00%)#3,128 |
| 77. | Braham | 13 | 6,706(0.19%)#77 | 1,051,999(0.00%)#3,180 |
| 78. | St Augusta | 12 | 6,706(0.18%)#78 | 1,051,999(0.00%)#3,238 |
| 79. | Two Harbors | 11 | 6,706(0.16%)#79 | 1,051,999(0.00%)#3,331 |
| 80. | Oronoco | 11 | 6,706(0.16%)#80 | 1,051,999(0.00%)#3,342 |
| 81. | Edina | 10 | 6,706(0.15%)#81 | 1,051,999(0.00%)#3,367 |
| 82. | Bellechester | 10 | 6,706(0.15%)#82 | 1,051,999(0.00%)#3,445 |
| 83. | North Mankato | 9 | 6,706(0.13%)#83 | 1,051,999(0.00%)#3,479 |
| 84. | Wadena | 9 | 6,706(0.13%)#84 | 1,051,999(0.00%)#3,508 |
| 85. | Minneota | 9 | 6,706(0.13%)#85 | 1,051,999(0.00%)#3,532 |
| 86. | Champlin | 8 | 6,706(0.12%)#86 | 1,051,999(0.00%)#3,567 |
| 87. | Waseca | 8 | 6,706(0.12%)#87 | 1,051,999(0.00%)#3,587 |
| 88. | Sandstone | 8 | 6,706(0.12%)#88 | 1,051,999(0.00%)#3,615 |
| 89. | Maple Lake | 8 | 6,706(0.12%)#89 | 1,051,999(0.00%)#3,616 |
| 90. | Maple Grove | 7 | 6,706(0.10%)#90 | 1,051,999(0.00%)#3,648 |
| 91. | Andover | 7 | 6,706(0.10%)#91 | 1,051,999(0.00%)#3,653 |
| 92. | Lino Lakes | 7 | 6,706(0.10%)#92 | 1,051,999(0.00%)#3,661 |
| 93. | West Concord | 7 | 6,706(0.10%)#93 | 1,051,999(0.00%)#3,725 |
| 94. | Northfield | 6 | 6,706(0.09%)#94 | 1,051,999(0.00%)#3,757 |
| 95. | Moose Lake | 6 | 6,706(0.09%)#95 | 1,051,999(0.00%)#3,796 |
| 96. | Cyrus | 6 | 6,706(0.09%)#96 | 1,051,999(0.00%)#3,849 |
| 97. | Beaver Creek | 6 | 6,706(0.09%)#97 | 1,051,999(0.00%)#3,850 |
| 98. | Wilder | 6 | 6,706(0.09%)#98 | 1,051,999(0.00%)#3,854 |
| 99. | Waite Park | 5 | 6,706(0.07%)#99 | 1,051,999(0.00%)#3,882 |
| 100. | Oak Park Heights | 5 | 6,706(0.07%)#100 | 1,051,999(0.00%)#3,894 |
Common Questions
What are the Top 10 Cities with the Most Immigrants from Guatemala in Minnesota?
Top 10 Cities with the Most Immigrants from Guatemala in Minnesota are:
#1
1,094
#2
619
#3
475
#4
310
#5
266
#6
203
#7
191
#8
146
#9
139
#10
120
What city has the Most Immigrants from Guatemala in Minnesota?
Worthington has the Most Immigrants from Guatemala in Minnesota with 1,094.
What is the Total Immigrants from Guatemala in the State of Minnesota?
Total Immigrants from Guatemala in Minnesota is 6,706.
What is the Total Immigrants from Guatemala in the United States?
Total Immigrants from Guatemala in the United States is 1,051,999.