Cities with the Most Immigrants from Guatemala in Tennessee
RELATED REPORTS & OPTIONS
Guatemala
Tennessee
Compare Cities
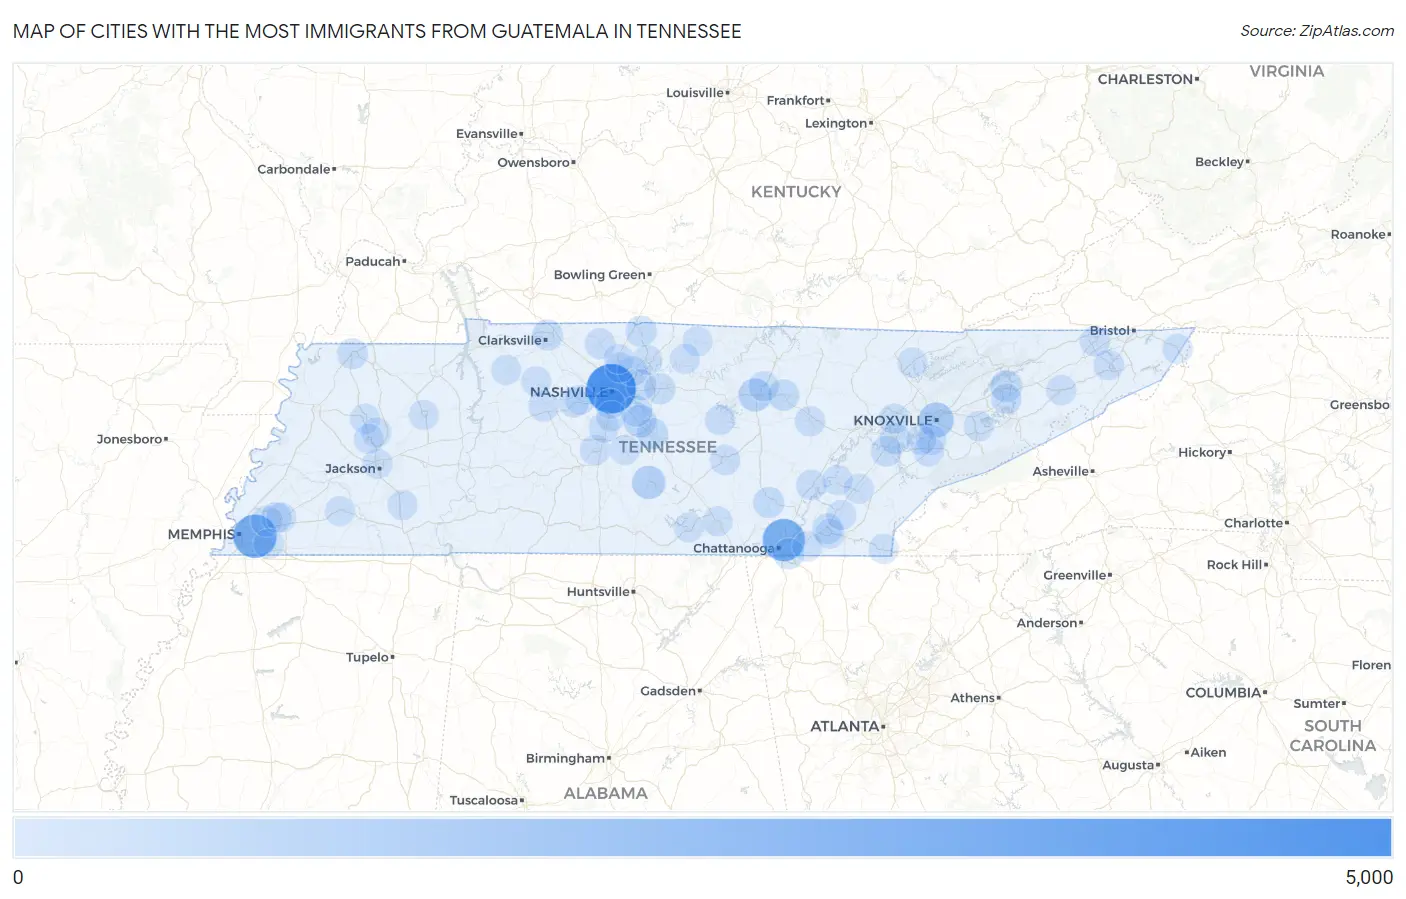
Map of Cities with the Most Immigrants from Guatemala in Tennessee
0
5,000
Cities with the Most Immigrants from Guatemala in Tennessee
| City | Guatemala | vs State | vs National | |
| 1. | Nashville | 4,644 | 21,286(21.82%)#1 | 1,051,999(0.44%)#18 |
| 2. | Memphis | 3,127 | 21,286(14.69%)#2 | 1,051,999(0.30%)#30 |
| 3. | Chattanooga | 2,897 | 21,286(13.61%)#3 | 1,051,999(0.28%)#36 |
| 4. | Knoxville | 1,132 | 21,286(5.32%)#4 | 1,051,999(0.11%)#145 |
| 5. | Shelbyville | 749 | 21,286(3.52%)#5 | 1,051,999(0.07%)#222 |
| 6. | Cookeville | 677 | 21,286(3.18%)#6 | 1,051,999(0.06%)#248 |
| 7. | Smyrna | 580 | 21,286(2.72%)#7 | 1,051,999(0.06%)#302 |
| 8. | Morristown | 401 | 21,286(1.88%)#8 | 1,051,999(0.04%)#401 |
| 9. | Murfreesboro | 316 | 21,286(1.48%)#9 | 1,051,999(0.03%)#496 |
| 10. | Dunlap | 257 | 21,286(1.21%)#10 | 1,051,999(0.02%)#578 |
| 11. | Monterey | 244 | 21,286(1.15%)#11 | 1,051,999(0.02%)#604 |
| 12. | La Vergne | 226 | 21,286(1.06%)#12 | 1,051,999(0.02%)#645 |
| 13. | Portland | 224 | 21,286(1.05%)#13 | 1,051,999(0.02%)#657 |
| 14. | East Ridge | 201 | 21,286(0.94%)#14 | 1,051,999(0.02%)#711 |
| 15. | Lebanon | 191 | 21,286(0.90%)#15 | 1,051,999(0.02%)#747 |
| 16. | Lenoir City | 182 | 21,286(0.86%)#16 | 1,051,999(0.02%)#783 |
| 17. | Clarksville | 177 | 21,286(0.83%)#17 | 1,051,999(0.02%)#796 |
| 18. | Bartlett | 164 | 21,286(0.77%)#18 | 1,051,999(0.02%)#850 |
| 19. | Union City | 162 | 21,286(0.76%)#19 | 1,051,999(0.02%)#861 |
| 20. | Loudon | 162 | 21,286(0.76%)#20 | 1,051,999(0.02%)#863 |
| 21. | Cleveland | 119 | 21,286(0.56%)#21 | 1,051,999(0.01%)#1,085 |
| 22. | Mount Juliet | 117 | 21,286(0.55%)#22 | 1,051,999(0.01%)#1,099 |
| 23. | Springfield | 110 | 21,286(0.52%)#23 | 1,051,999(0.01%)#1,139 |
| 24. | Kingsport | 97 | 21,286(0.46%)#24 | 1,051,999(0.01%)#1,232 |
| 25. | Dickson | 96 | 21,286(0.45%)#25 | 1,051,999(0.01%)#1,244 |
| 26. | Johnson City | 92 | 21,286(0.43%)#26 | 1,051,999(0.01%)#1,280 |
| 27. | Dayton | 90 | 21,286(0.42%)#27 | 1,051,999(0.01%)#1,310 |
| 28. | White Pine | 89 | 21,286(0.42%)#28 | 1,051,999(0.01%)#1,324 |
| 29. | Maryville | 81 | 21,286(0.38%)#29 | 1,051,999(0.01%)#1,383 |
| 30. | Spring Hill | 72 | 21,286(0.34%)#30 | 1,051,999(0.01%)#1,474 |
| 31. | Smithville | 72 | 21,286(0.34%)#31 | 1,051,999(0.01%)#1,481 |
| 32. | Mcminnville | 62 | 21,286(0.29%)#32 | 1,051,999(0.01%)#1,616 |
| 33. | Algood | 56 | 21,286(0.26%)#33 | 1,051,999(0.01%)#1,715 |
| 34. | Lakeland | 51 | 21,286(0.24%)#34 | 1,051,999(0.00%)#1,800 |
| 35. | Oak Ridge | 50 | 21,286(0.23%)#35 | 1,051,999(0.00%)#1,811 |
| 36. | Franklin | 48 | 21,286(0.23%)#36 | 1,051,999(0.00%)#1,846 |
| 37. | Crossville | 43 | 21,286(0.20%)#37 | 1,051,999(0.00%)#1,952 |
| 38. | Hendersonville | 36 | 21,286(0.17%)#38 | 1,051,999(0.00%)#2,131 |
| 39. | Greeneville | 36 | 21,286(0.17%)#39 | 1,051,999(0.00%)#2,147 |
| 40. | Trenton | 25 | 21,286(0.12%)#40 | 1,051,999(0.00%)#2,522 |
| 41. | Mountain City | 24 | 21,286(0.11%)#41 | 1,051,999(0.00%)#2,567 |
| 42. | Arlington | 23 | 21,286(0.11%)#42 | 1,051,999(0.00%)#2,595 |
| 43. | Alcoa | 23 | 21,286(0.11%)#43 | 1,051,999(0.00%)#2,604 |
| 44. | La Follette | 23 | 21,286(0.11%)#44 | 1,051,999(0.00%)#2,608 |
| 45. | Powell | 22 | 21,286(0.10%)#45 | 1,051,999(0.00%)#2,639 |
| 46. | Lafayette | 22 | 21,286(0.10%)#46 | 1,051,999(0.00%)#2,655 |
| 47. | Sevierville | 20 | 21,286(0.09%)#47 | 1,051,999(0.00%)#2,733 |
| 48. | Brentwood | 18 | 21,286(0.08%)#48 | 1,051,999(0.00%)#2,821 |
| 49. | Germantown | 18 | 21,286(0.08%)#49 | 1,051,999(0.00%)#2,822 |
| 50. | Decatur | 18 | 21,286(0.08%)#50 | 1,051,999(0.00%)#2,862 |
| 51. | Kingston Springs | 15 | 21,286(0.07%)#51 | 1,051,999(0.00%)#3,035 |
| 52. | East Cleveland | 15 | 21,286(0.07%)#52 | 1,051,999(0.00%)#3,040 |
| 53. | Louisville | 14 | 21,286(0.07%)#53 | 1,051,999(0.00%)#3,094 |
| 54. | Goodlettsville | 13 | 21,286(0.06%)#54 | 1,051,999(0.00%)#3,149 |
| 55. | Jackson | 11 | 21,286(0.05%)#55 | 1,051,999(0.00%)#3,269 |
| 56. | Hartsville Trousdale County | 10 | 21,286(0.05%)#56 | 1,051,999(0.00%)#3,395 |
| 57. | Lynchburg | 10 | 21,286(0.05%)#57 | 1,051,999(0.00%)#3,405 |
| 58. | Gibson | 10 | 21,286(0.05%)#58 | 1,051,999(0.00%)#3,439 |
| 59. | Gallatin | 9 | 21,286(0.04%)#59 | 1,051,999(0.00%)#3,453 |
| 60. | Millersville | 8 | 21,286(0.04%)#60 | 1,051,999(0.00%)#3,599 |
| 61. | Pegram | 8 | 21,286(0.04%)#61 | 1,051,999(0.00%)#3,618 |
| 62. | Winchester | 7 | 21,286(0.03%)#62 | 1,051,999(0.00%)#3,678 |
| 63. | Vanleer | 7 | 21,286(0.03%)#63 | 1,051,999(0.00%)#3,732 |
| 64. | Whiteville | 6 | 21,286(0.03%)#64 | 1,051,999(0.00%)#3,790 |
| 65. | Ducktown | 6 | 21,286(0.03%)#65 | 1,051,999(0.00%)#3,843 |
| 66. | Humboldt | 5 | 21,286(0.02%)#66 | 1,051,999(0.00%)#3,884 |
| 67. | Monteagle | 5 | 21,286(0.02%)#67 | 1,051,999(0.00%)#3,915 |
| 68. | Finger | 5 | 21,286(0.02%)#68 | 1,051,999(0.00%)#3,944 |
| 69. | Athens | 4 | 21,286(0.02%)#69 | 1,051,999(0.00%)#3,962 |
| 70. | Collegedale | 3 | 21,286(0.01%)#70 | 1,051,999(0.00%)#4,083 |
| 71. | Oak Hill | 3 | 21,286(0.01%)#71 | 1,051,999(0.00%)#4,088 |
| 72. | Huntingdon | 3 | 21,286(0.01%)#72 | 1,051,999(0.00%)#4,090 |
| 73. | Eagleville | 3 | 21,286(0.01%)#73 | 1,051,999(0.00%)#4,126 |
| 74. | Erin | 2 | 21,286(0.01%)#74 | 1,051,999(0.00%)#4,211 |
| 75. | Charleston | 2 | 21,286(0.01%)#75 | 1,051,999(0.00%)#4,239 |
Common Questions
What are the Top 10 Cities with the Most Immigrants from Guatemala in Tennessee?
Top 10 Cities with the Most Immigrants from Guatemala in Tennessee are:
#1
4,644
#2
3,127
#3
2,897
#4
1,132
#5
749
#6
677
#7
580
#8
401
#9
316
#10
257
What city has the Most Immigrants from Guatemala in Tennessee?
Nashville has the Most Immigrants from Guatemala in Tennessee with 4,644.
What is the Total Immigrants from Guatemala in the State of Tennessee?
Total Immigrants from Guatemala in Tennessee is 21,286.
What is the Total Immigrants from Guatemala in the United States?
Total Immigrants from Guatemala in the United States is 1,051,999.