Cities with the Most Immigrants from Guatemala in Kansas
RELATED REPORTS & OPTIONS
Guatemala
Kansas
Compare Cities
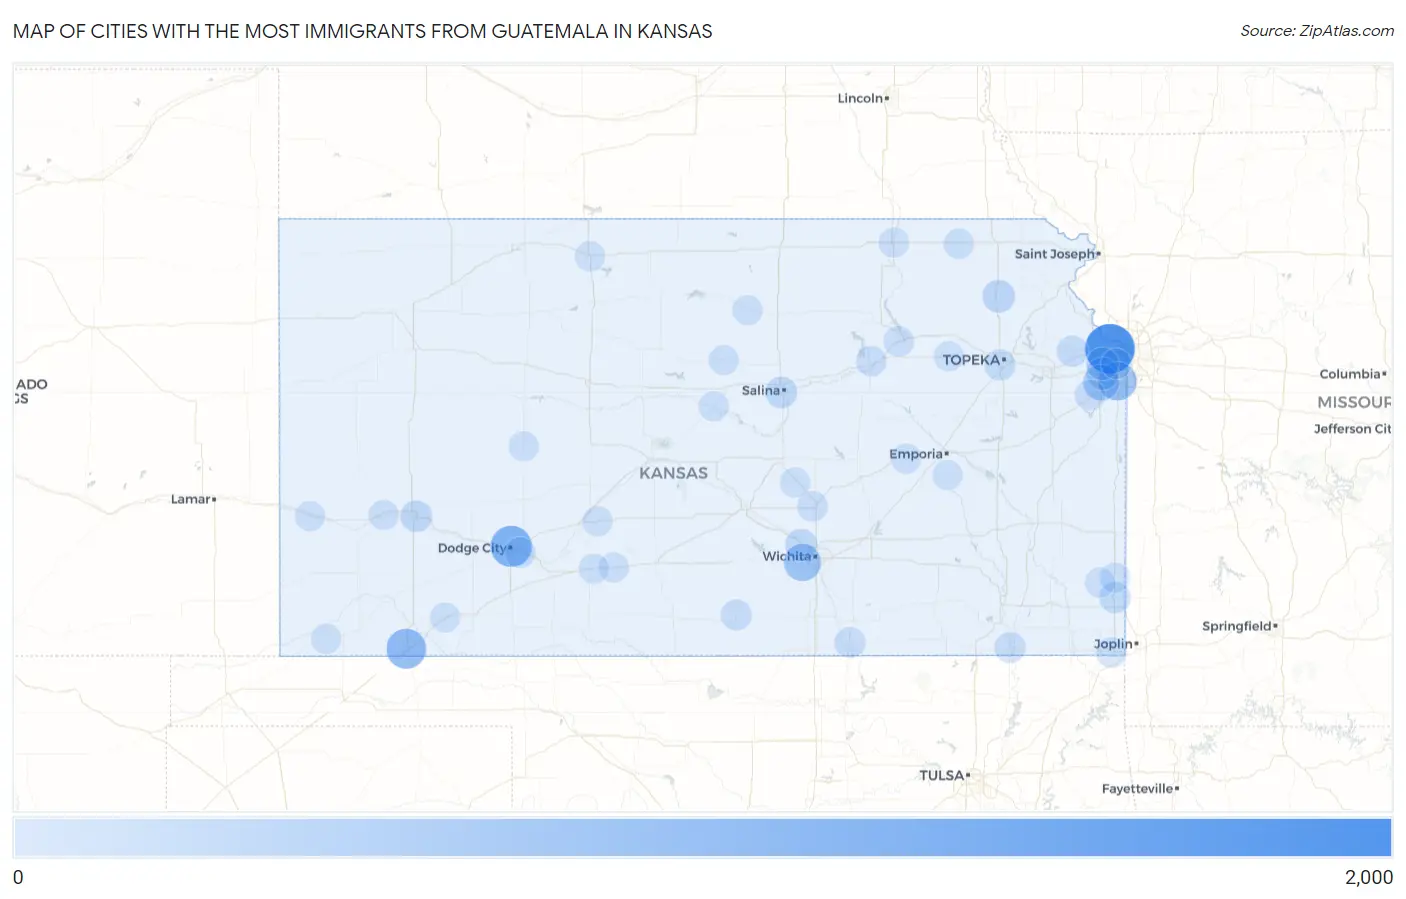
Map of Cities with the Most Immigrants from Guatemala in Kansas
0
2,000
Cities with the Most Immigrants from Guatemala in Kansas
| City | Guatemala | vs State | vs National | |
| 1. | Kansas City | 1,727 | 7,355(23.48%)#1 | 1,051,999(0.16%)#82 |
| 2. | Dodge City | 967 | 7,355(13.15%)#2 | 1,051,999(0.09%)#174 |
| 3. | Liberal | 841 | 7,355(11.43%)#3 | 1,051,999(0.08%)#193 |
| 4. | Overland Park | 730 | 7,355(9.93%)#4 | 1,051,999(0.07%)#223 |
| 5. | Wichita | 596 | 7,355(8.10%)#5 | 1,051,999(0.06%)#293 |
| 6. | Olathe | 502 | 7,355(6.83%)#6 | 1,051,999(0.05%)#347 |
| 7. | Holton | 209 | 7,355(2.84%)#7 | 1,051,999(0.02%)#689 |
| 8. | Lenexa | 206 | 7,355(2.80%)#8 | 1,051,999(0.02%)#697 |
| 9. | Shawnee | 201 | 7,355(2.73%)#9 | 1,051,999(0.02%)#710 |
| 10. | Maize | 156 | 7,355(2.12%)#10 | 1,051,999(0.01%)#889 |
| 11. | Salina | 132 | 7,355(1.79%)#11 | 1,051,999(0.01%)#1,012 |
| 12. | Garden City | 132 | 7,355(1.79%)#12 | 1,051,999(0.01%)#1,013 |
| 13. | Pittsburg | 104 | 7,355(1.41%)#13 | 1,051,999(0.01%)#1,177 |
| 14. | Tonganoxie | 95 | 7,355(1.29%)#14 | 1,051,999(0.01%)#1,253 |
| 15. | Topeka | 86 | 7,355(1.17%)#15 | 1,051,999(0.01%)#1,341 |
| 16. | Wilroads Gardens | 81 | 7,355(1.10%)#16 | 1,051,999(0.01%)#1,390 |
| 17. | Harper | 69 | 7,355(0.94%)#17 | 1,051,999(0.01%)#1,515 |
| 18. | Coffeyville | 61 | 7,355(0.83%)#18 | 1,051,999(0.01%)#1,634 |
| 19. | Arkansas City | 47 | 7,355(0.64%)#19 | 1,051,999(0.00%)#1,872 |
| 20. | Manhattan | 37 | 7,355(0.50%)#20 | 1,051,999(0.00%)#2,098 |
| 21. | Gardner | 35 | 7,355(0.48%)#21 | 1,051,999(0.00%)#2,170 |
| 22. | Newton | 34 | 7,355(0.46%)#22 | 1,051,999(0.00%)#2,206 |
| 23. | Baxter Springs | 27 | 7,355(0.37%)#23 | 1,051,999(0.00%)#2,445 |
| 24. | Junction City | 18 | 7,355(0.24%)#24 | 1,051,999(0.00%)#2,832 |
| 25. | Merriam | 18 | 7,355(0.24%)#25 | 1,051,999(0.00%)#2,843 |
| 26. | Seneca | 15 | 7,355(0.20%)#26 | 1,051,999(0.00%)#3,041 |
| 27. | Cottonwood Falls | 13 | 7,355(0.18%)#27 | 1,051,999(0.00%)#3,185 |
| 28. | Rolla | 11 | 7,355(0.15%)#28 | 1,051,999(0.00%)#3,349 |
| 29. | Ellsworth | 10 | 7,355(0.14%)#29 | 1,051,999(0.00%)#3,420 |
| 30. | Ness City | 9 | 7,355(0.12%)#30 | 1,051,999(0.00%)#3,535 |
| 31. | Marysville | 7 | 7,355(0.10%)#31 | 1,051,999(0.00%)#3,694 |
| 32. | Arma | 7 | 7,355(0.10%)#32 | 1,051,999(0.00%)#3,717 |
| 33. | Moundridge | 6 | 7,355(0.08%)#33 | 1,051,999(0.00%)#3,813 |
| 34. | Deerfield | 6 | 7,355(0.08%)#34 | 1,051,999(0.00%)#3,833 |
| 35. | Olpe | 6 | 7,355(0.08%)#35 | 1,051,999(0.00%)#3,844 |
| 36. | Lewis | 6 | 7,355(0.08%)#36 | 1,051,999(0.00%)#3,845 |
| 37. | Simpson | 6 | 7,355(0.08%)#37 | 1,051,999(0.00%)#3,853 |
| 38. | Girard | 5 | 7,355(0.07%)#38 | 1,051,999(0.00%)#3,907 |
| 39. | Phillipsburg | 5 | 7,355(0.07%)#39 | 1,051,999(0.00%)#3,911 |
| 40. | Syracuse | 4 | 7,355(0.05%)#40 | 1,051,999(0.00%)#4,013 |
| 41. | Plains | 2 | 7,355(0.03%)#41 | 1,051,999(0.00%)#4,213 |
| 42. | Lincoln Center | 1 | 7,355(0.01%)#42 | 1,051,999(0.00%)#4,356 |
| 43. | Haviland | 1 | 7,355(0.01%)#43 | 1,051,999(0.00%)#4,368 |
| 44. | Greensburg | 1 | 7,355(0.01%)#44 | 1,051,999(0.00%)#4,373 |
| 45. | Paxico | 1 | 7,355(0.01%)#45 | 1,051,999(0.00%)#4,397 |
Common Questions
What are the Top 10 Cities with the Most Immigrants from Guatemala in Kansas?
Top 10 Cities with the Most Immigrants from Guatemala in Kansas are:
#1
1,727
#2
967
#3
841
#4
730
#5
596
#6
502
#7
209
#8
206
#9
201
#10
156
What city has the Most Immigrants from Guatemala in Kansas?
Kansas City has the Most Immigrants from Guatemala in Kansas with 1,727.
What is the Total Immigrants from Guatemala in the State of Kansas?
Total Immigrants from Guatemala in Kansas is 7,355.
What is the Total Immigrants from Guatemala in the United States?
Total Immigrants from Guatemala in the United States is 1,051,999.