Cities with the Highest Percentage of Population with a Degree in Communications in Texas
RELATED REPORTS & OPTIONS
Communications
Texas
Compare Cities
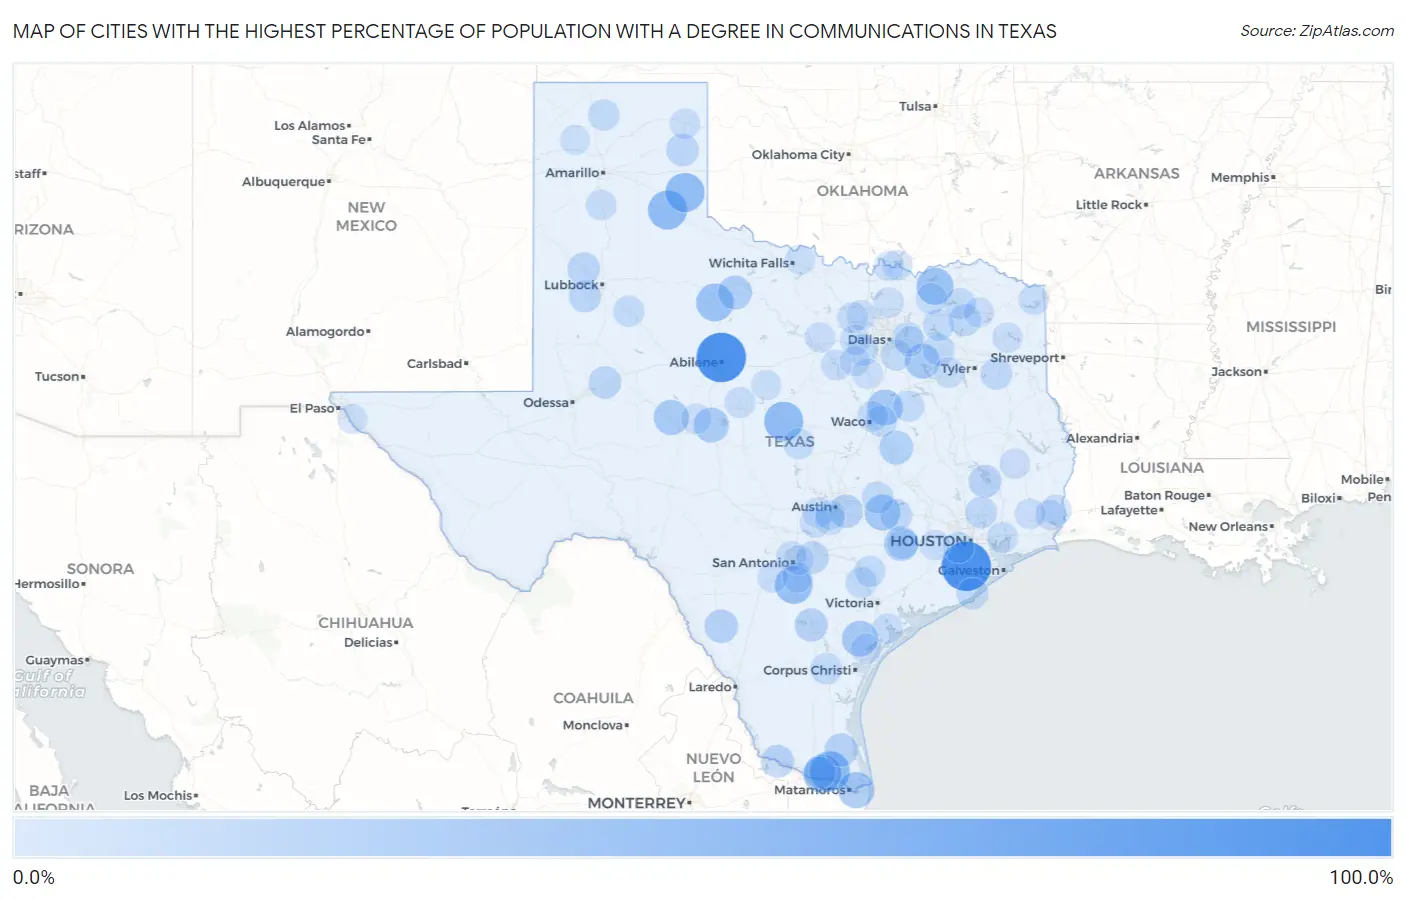
Map of Cities with the Highest Percentage of Population with a Degree in Communications in Texas
0.0%
100.0%
Cities with the Highest Percentage of Population with a Degree in Communications in Texas
| City | % Graduates | vs State | vs National | |
| 1. | Rosharon | 100.0% | 4.1%(+95.9)#1 | 4.1%(+95.9)#2 |
| 2. | Myra | 100.0% | 4.1%(+95.9)#2 | 4.1%(+95.9)#4 |
| 3. | Impact | 100.0% | 4.1%(+95.9)#3 | 4.1%(+95.9)#24 |
| 4. | Solis | 53.1% | 4.1%(+49.0)#4 | 4.1%(+49.0)#68 |
| 5. | Mullin | 50.0% | 4.1%(+45.9)#5 | 4.1%(+45.9)#77 |
| 6. | Lakeview | 50.0% | 4.1%(+45.9)#6 | 4.1%(+45.9)#90 |
| 7. | Quail | 50.0% | 4.1%(+45.9)#7 | 4.1%(+45.9)#93 |
| 8. | Llano Grande | 46.0% | 4.1%(+41.9)#8 | 4.1%(+41.8)#106 |
| 9. | Leming | 43.5% | 4.1%(+39.4)#9 | 4.1%(+39.3)#117 |
| 10. | Rochester | 42.9% | 4.1%(+38.8)#10 | 4.1%(+38.7)#121 |
| 11. | Hilltop Cdp Frio County | 41.9% | 4.1%(+37.8)#11 | 4.1%(+37.7)#128 |
| 12. | Windom | 40.0% | 4.1%(+35.9)#12 | 4.1%(+35.9)#137 |
| 13. | Whitharral | 40.0% | 4.1%(+35.9)#13 | 4.1%(+35.9)#139 |
| 14. | Paige | 38.1% | 4.1%(+34.0)#14 | 4.1%(+34.0)#144 |
| 15. | South Point | 36.8% | 4.1%(+32.8)#15 | 4.1%(+32.7)#154 |
| 16. | Woodsboro | 35.1% | 4.1%(+31.0)#16 | 4.1%(+31.0)#167 |
| 17. | Giddings | 34.1% | 4.1%(+30.0)#17 | 4.1%(+30.0)#170 |
| 18. | Mount Calm | 33.9% | 4.1%(+29.8)#18 | 4.1%(+29.8)#172 |
| 19. | Carlsbad | 31.7% | 4.1%(+27.6)#19 | 4.1%(+27.6)#205 |
| 20. | Kemp | 31.0% | 4.1%(+26.9)#20 | 4.1%(+26.9)#212 |
| 21. | Paint Rock | 30.8% | 4.1%(+26.7)#21 | 4.1%(+26.6)#215 |
| 22. | Glidden | 28.6% | 4.1%(+24.5)#22 | 4.1%(+24.4)#245 |
| 23. | Goree | 26.3% | 4.1%(+22.2)#23 | 4.1%(+22.2)#286 |
| 24. | Bremond | 26.0% | 4.1%(+22.0)#24 | 4.1%(+21.9)#291 |
| 25. | Asherton | 24.0% | 4.1%(+19.9)#25 | 4.1%(+19.9)#337 |
| 26. | Garfield | 23.5% | 4.1%(+19.4)#26 | 4.1%(+19.4)#350 |
| 27. | San Perlita | 22.7% | 4.1%(+18.6)#27 | 4.1%(+18.6)#366 |
| 28. | Three Rivers | 21.9% | 4.1%(+17.8)#28 | 4.1%(+17.8)#387 |
| 29. | El Refugio | 21.4% | 4.1%(+17.3)#29 | 4.1%(+17.3)#395 |
| 30. | Cape Royale | 20.5% | 4.1%(+16.4)#30 | 4.1%(+16.4)#431 |
| 31. | Mobeetie | 20.0% | 4.1%(+15.9)#31 | 4.1%(+15.9)#469 |
| 32. | Stanton | 19.9% | 4.1%(+15.8)#32 | 4.1%(+15.8)#476 |
| 33. | Anton | 19.7% | 4.1%(+15.6)#33 | 4.1%(+15.6)#479 |
| 34. | Zuehl | 19.6% | 4.1%(+15.5)#34 | 4.1%(+15.4)#484 |
| 35. | Ropesville | 18.6% | 4.1%(+14.5)#35 | 4.1%(+14.5)#520 |
| 36. | New London | 16.7% | 4.1%(+12.6)#36 | 4.1%(+12.5)#601 |
| 37. | Como | 16.7% | 4.1%(+12.6)#37 | 4.1%(+12.5)#604 |
| 38. | Carmine | 16.7% | 4.1%(+12.6)#38 | 4.1%(+12.5)#615 |
| 39. | Woodbranch | 15.9% | 4.1%(+11.8)#39 | 4.1%(+11.8)#677 |
| 40. | Myrtle Springs | 15.8% | 4.1%(+11.7)#40 | 4.1%(+11.7)#688 |
| 41. | Lexington | 15.5% | 4.1%(+11.4)#41 | 4.1%(+11.4)#711 |
| 42. | Midway South | 15.4% | 4.1%(+11.4)#42 | 4.1%(+11.3)#714 |
| 43. | Lone Oak | 15.3% | 4.1%(+11.2)#43 | 4.1%(+11.2)#727 |
| 44. | Freeport | 15.3% | 4.1%(+11.2)#44 | 4.1%(+11.1)#730 |
| 45. | Sunray | 14.7% | 4.1%(+10.6)#45 | 4.1%(+10.6)#778 |
| 46. | Tira | 14.6% | 4.1%(+10.5)#46 | 4.1%(+10.5)#786 |
| 47. | Agua Dulce | 14.5% | 4.1%(+10.5)#47 | 4.1%(+10.4)#794 |
| 48. | Hallsburg | 14.3% | 4.1%(+10.2)#48 | 4.1%(+10.2)#819 |
| 49. | Cuero | 14.1% | 4.1%(+10.0)#49 | 4.1%(+10.00)#855 |
| 50. | Post | 14.0% | 4.1%(+9.95)#50 | 4.1%(+9.90)#861 |
| 51. | Wolfe City | 14.0% | 4.1%(+9.95)#51 | 4.1%(+9.90)#862 |
| 52. | Wortham | 13.8% | 4.1%(+9.66)#52 | 4.1%(+9.61)#889 |
| 53. | Everman | 13.7% | 4.1%(+9.58)#53 | 4.1%(+9.54)#895 |
| 54. | Travis Ranch | 13.6% | 4.1%(+9.52)#54 | 4.1%(+9.48)#903 |
| 55. | Lometa | 13.4% | 4.1%(+9.33)#55 | 4.1%(+9.28)#918 |
| 56. | Ferris | 13.0% | 4.1%(+8.92)#56 | 4.1%(+8.88)#981 |
| 57. | Yoakum | 13.0% | 4.1%(+8.92)#57 | 4.1%(+8.87)#983 |
| 58. | Meadows Place | 12.8% | 4.1%(+8.72)#58 | 4.1%(+8.67)#1,012 |
| 59. | Columbus | 12.3% | 4.1%(+8.17)#59 | 4.1%(+8.12)#1,096 |
| 60. | Cove | 12.0% | 4.1%(+7.91)#60 | 4.1%(+7.86)#1,137 |
| 61. | Lacy Lakeview | 12.0% | 4.1%(+7.87)#61 | 4.1%(+7.82)#1,144 |
| 62. | Coleman | 12.0% | 4.1%(+7.86)#62 | 4.1%(+7.82)#1,146 |
| 63. | Happy | 11.8% | 4.1%(+7.73)#63 | 4.1%(+7.68)#1,170 |
| 64. | Murchison | 11.8% | 4.1%(+7.68)#64 | 4.1%(+7.63)#1,182 |
| 65. | Heartland | 11.7% | 4.1%(+7.62)#65 | 4.1%(+7.57)#1,200 |
| 66. | New Fairview | 11.5% | 4.1%(+7.38)#66 | 4.1%(+7.33)#1,238 |
| 67. | Canyon Creek | 11.5% | 4.1%(+7.36)#67 | 4.1%(+7.32)#1,243 |
| 68. | Mauriceville | 11.3% | 4.1%(+7.23)#68 | 4.1%(+7.19)#1,261 |
| 69. | Austwell | 11.1% | 4.1%(+7.02)#69 | 4.1%(+6.98)#1,317 |
| 70. | Canadian | 10.8% | 4.1%(+6.67)#70 | 4.1%(+6.63)#1,391 |
| 71. | Pinewood Estates | 10.7% | 4.1%(+6.64)#71 | 4.1%(+6.60)#1,395 |
| 72. | Bayside | 10.7% | 4.1%(+6.62)#72 | 4.1%(+6.58)#1,404 |
| 73. | Vidor | 10.5% | 4.1%(+6.36)#73 | 4.1%(+6.32)#1,466 |
| 74. | Redwater | 10.4% | 4.1%(+6.31)#74 | 4.1%(+6.26)#1,479 |
| 75. | Grandview | 10.4% | 4.1%(+6.30)#75 | 4.1%(+6.25)#1,481 |
| 76. | Simonton | 10.4% | 4.1%(+6.29)#76 | 4.1%(+6.25)#1,483 |
| 77. | Chester | 10.3% | 4.1%(+6.17)#77 | 4.1%(+6.12)#1,516 |
| 78. | Forney | 10.3% | 4.1%(+6.17)#78 | 4.1%(+6.12)#1,518 |
| 79. | Miles | 10.2% | 4.1%(+6.15)#79 | 4.1%(+6.11)#1,519 |
| 80. | Preston | 10.2% | 4.1%(+6.09)#80 | 4.1%(+6.04)#1,534 |
| 81. | Cool | 10.0% | 4.1%(+5.91)#81 | 4.1%(+5.86)#1,595 |
| 82. | Woodcreek | 9.9% | 4.1%(+5.82)#82 | 4.1%(+5.77)#1,614 |
| 83. | Mount Vernon | 9.9% | 4.1%(+5.81)#83 | 4.1%(+5.77)#1,616 |
| 84. | River Oaks | 9.9% | 4.1%(+5.79)#84 | 4.1%(+5.75)#1,621 |
| 85. | Castle Hills | 9.7% | 4.1%(+5.61)#85 | 4.1%(+5.56)#1,676 |
| 86. | Ore City | 9.7% | 4.1%(+5.59)#86 | 4.1%(+5.54)#1,681 |
| 87. | Natalia | 9.6% | 4.1%(+5.53)#87 | 4.1%(+5.48)#1,703 |
| 88. | Sandy Oaks | 9.6% | 4.1%(+5.50)#88 | 4.1%(+5.45)#1,716 |
| 89. | Dripping Springs | 9.5% | 4.1%(+5.45)#89 | 4.1%(+5.41)#1,724 |
| 90. | Rising Star | 9.5% | 4.1%(+5.43)#90 | 4.1%(+5.39)#1,733 |
| 91. | Celina | 9.4% | 4.1%(+5.31)#91 | 4.1%(+5.27)#1,777 |
| 92. | Dish | 9.2% | 4.1%(+5.15)#92 | 4.1%(+5.11)#1,828 |
| 93. | Buda | 9.2% | 4.1%(+5.08)#93 | 4.1%(+5.03)#1,842 |
| 94. | Dean | 9.1% | 4.1%(+5.00)#94 | 4.1%(+4.96)#1,875 |
| 95. | Manchaca | 9.0% | 4.1%(+4.95)#95 | 4.1%(+4.90)#1,906 |
| 96. | Sherwood Shores | 9.0% | 4.1%(+4.93)#96 | 4.1%(+4.88)#1,914 |
| 97. | Joshua | 9.0% | 4.1%(+4.86)#97 | 4.1%(+4.82)#1,935 |
| 98. | Channing | 8.9% | 4.1%(+4.84)#98 | 4.1%(+4.79)#1,943 |
| 99. | Kirby | 8.9% | 4.1%(+4.76)#99 | 4.1%(+4.72)#1,971 |
| 100. | Clint | 8.7% | 4.1%(+4.63)#100 | 4.1%(+4.58)#2,022 |
Common Questions
What are the Top 10 Cities with the Highest Percentage of Population with a Degree in Communications in Texas?
Top 10 Cities with the Highest Percentage of Population with a Degree in Communications in Texas are:
What city has the Highest Percentage of Population with a Degree in Communications in Texas?
Rosharon has the Highest Percentage of Population with a Degree in Communications in Texas with 100.0%.
What is the Percentage of Population with a Degree in Communications in the State of Texas?
Percentage of Population with a Degree in Communications in Texas is 4.1%.
What is the Percentage of Population with a Degree in Communications in the United States?
Percentage of Population with a Degree in Communications in the United States is 4.1%.