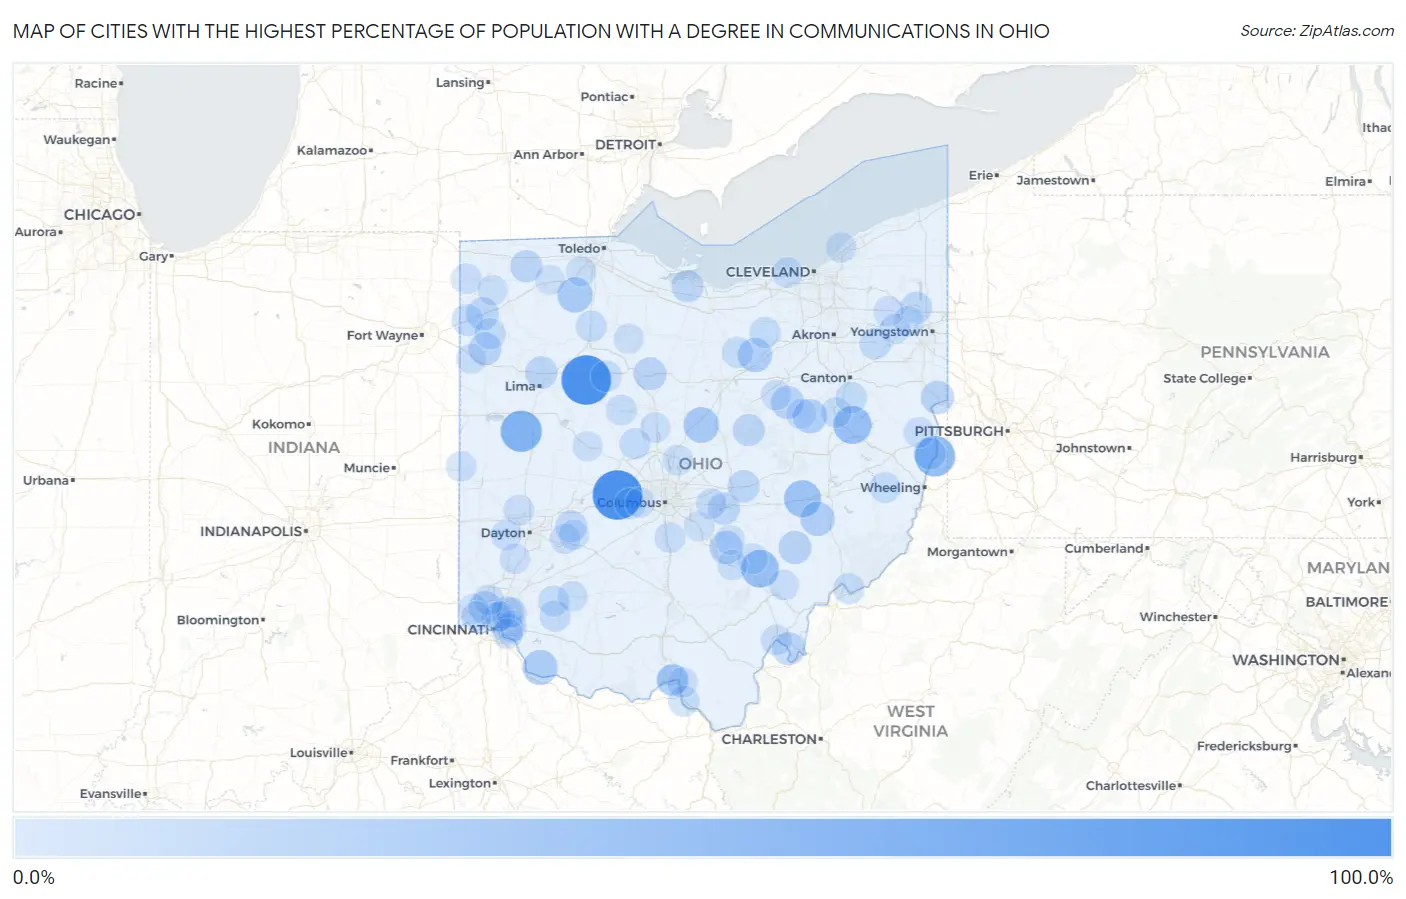
Cities with the Highest Percentage of Population with a Degree in Communications in Ohio
RELATED REPORTS & OPTIONS
Communications
Ohio
Compare Cities
Map of Cities with the Highest Percentage of Population with a Degree in Communications in Ohio
0.0%
100.0%
Cities with the Highest Percentage of Population with a Degree in Communications in Ohio
| City | % Graduates | vs State | vs National | |
| 1. | Plumwood | 100.0% | 4.3%(+95.7)#1 | 4.1%(+95.9)#5 |
| 2. | Dola | 100.0% | 4.3%(+95.7)#2 | 4.1%(+95.9)#13 |
| 3. | New Haven Cdp Hamilton County | 100.0% | 4.3%(+95.7)#3 | 4.1%(+95.9)#16 |
| 4. | South Mount Vernon | 62.7% | 4.3%(+58.4)#4 | 4.1%(+58.5)#49 |
| 5. | Kettlersville | 60.0% | 4.3%(+55.7)#5 | 4.1%(+55.9)#53 |
| 6. | Brilliant | 56.5% | 4.3%(+52.1)#6 | 4.1%(+52.3)#57 |
| 7. | Roswell | 44.4% | 4.3%(+40.1)#7 | 4.1%(+40.3)#111 |
| 8. | Murray City | 43.8% | 4.3%(+39.4)#8 | 4.1%(+39.6)#115 |
| 9. | Norwich | 40.0% | 4.3%(+35.7)#9 | 4.1%(+35.9)#138 |
| 10. | Chesterville | 33.3% | 4.3%(+29.0)#10 | 4.1%(+29.2)#183 |
| 11. | Weston | 31.5% | 4.3%(+27.2)#11 | 4.1%(+27.3)#207 |
| 12. | Felicity | 30.4% | 4.3%(+26.1)#12 | 4.1%(+26.3)#223 |
| 13. | Brunersburg | 30.0% | 4.3%(+25.7)#13 | 4.1%(+25.9)#230 |
| 14. | Polk | 27.7% | 4.3%(+23.4)#14 | 4.1%(+23.5)#260 |
| 15. | Cumberland | 27.6% | 4.3%(+23.3)#15 | 4.1%(+23.5)#264 |
| 16. | Walnut Creek | 26.8% | 4.3%(+22.5)#16 | 4.1%(+22.7)#273 |
| 17. | Hide A Way Hills | 23.7% | 4.3%(+19.4)#17 | 4.1%(+19.6)#345 |
| 18. | Glenmoor | 23.1% | 4.3%(+18.8)#18 | 4.1%(+18.9)#361 |
| 19. | Holmesville | 22.2% | 4.3%(+17.9)#19 | 4.1%(+18.1)#374 |
| 20. | Malta | 21.6% | 4.3%(+17.3)#20 | 4.1%(+17.5)#392 |
| 21. | Scott | 21.4% | 4.3%(+17.1)#21 | 4.1%(+17.3)#397 |
| 22. | Northbrook | 21.3% | 4.3%(+17.0)#22 | 4.1%(+17.2)#404 |
| 23. | Nevada | 20.8% | 4.3%(+16.5)#23 | 4.1%(+16.7)#419 |
| 24. | Racine | 20.4% | 4.3%(+16.1)#24 | 4.1%(+16.3)#434 |
| 25. | Cecil | 20.0% | 4.3%(+15.7)#25 | 4.1%(+15.9)#466 |
| 26. | Cairo | 19.0% | 4.3%(+14.7)#26 | 4.1%(+14.9)#495 |
| 27. | Fairfield Beach | 18.9% | 4.3%(+14.6)#27 | 4.1%(+14.8)#501 |
| 28. | New Boston | 18.0% | 4.3%(+13.7)#28 | 4.1%(+13.8)#543 |
| 29. | Pettisville | 17.9% | 4.3%(+13.5)#29 | 4.1%(+13.7)#548 |
| 30. | Castalia | 17.6% | 4.3%(+13.3)#30 | 4.1%(+13.5)#562 |
| 31. | Marne | 17.3% | 4.3%(+13.0)#31 | 4.1%(+13.2)#575 |
| 32. | Danville | 17.1% | 4.3%(+12.8)#32 | 4.1%(+13.0)#588 |
| 33. | New Alexandria | 16.7% | 4.3%(+12.4)#33 | 4.1%(+12.5)#607 |
| 34. | Rossmoyne | 16.4% | 4.3%(+12.1)#34 | 4.1%(+12.3)#637 |
| 35. | Clifton | 16.3% | 4.3%(+12.0)#35 | 4.1%(+12.2)#652 |
| 36. | Morgandale | 16.0% | 4.3%(+11.7)#36 | 4.1%(+11.9)#670 |
| 37. | Antwerp | 15.4% | 4.3%(+11.1)#37 | 4.1%(+11.2)#715 |
| 38. | East Sparta | 15.1% | 4.3%(+10.8)#38 | 4.1%(+10.9)#746 |
| 39. | Oakwood Village Cuyahoga County | 14.9% | 4.3%(+10.6)#39 | 4.1%(+10.8)#756 |
| 40. | Atwater | 14.3% | 4.3%(+9.98)#40 | 4.1%(+10.2)#815 |
| 41. | Broughton | 14.3% | 4.3%(+9.98)#41 | 4.1%(+10.2)#845 |
| 42. | Suffield | 13.9% | 4.3%(+9.55)#42 | 4.1%(+9.73)#876 |
| 43. | Forest | 13.8% | 4.3%(+9.45)#43 | 4.1%(+9.63)#887 |
| 44. | Reno | 13.3% | 4.3%(+9.02)#44 | 4.1%(+9.20)#924 |
| 45. | Van Buren | 13.3% | 4.3%(+9.02)#45 | 4.1%(+9.20)#927 |
| 46. | West Jefferson | 13.3% | 4.3%(+8.98)#46 | 4.1%(+9.15)#947 |
| 47. | Savannah | 13.2% | 4.3%(+8.90)#47 | 4.1%(+9.07)#964 |
| 48. | Spencer | 13.0% | 4.3%(+8.65)#48 | 4.1%(+8.83)#988 |
| 49. | Magnetic Springs | 12.9% | 4.3%(+8.59)#49 | 4.1%(+8.77)#998 |
| 50. | Morristown | 12.9% | 4.3%(+8.59)#50 | 4.1%(+8.77)#999 |
| 51. | Lake Lorelei | 12.8% | 4.3%(+8.48)#51 | 4.1%(+8.66)#1,015 |
| 52. | Blanchester | 12.6% | 4.3%(+8.33)#52 | 4.1%(+8.50)#1,033 |
| 53. | Franklin Furnace | 12.5% | 4.3%(+8.24)#53 | 4.1%(+8.41)#1,040 |
| 54. | Newtown | 12.2% | 4.3%(+7.89)#54 | 4.1%(+8.07)#1,109 |
| 55. | Turpin Hills | 11.9% | 4.3%(+7.59)#55 | 4.1%(+7.76)#1,154 |
| 56. | Pomeroy | 11.8% | 4.3%(+7.46)#56 | 4.1%(+7.63)#1,175 |
| 57. | New Straitsville | 11.8% | 4.3%(+7.46)#57 | 4.1%(+7.63)#1,180 |
| 58. | Portsmouth | 11.7% | 4.3%(+7.40)#58 | 4.1%(+7.57)#1,201 |
| 59. | Bay Village | 11.6% | 4.3%(+7.30)#59 | 4.1%(+7.48)#1,213 |
| 60. | La Rue | 11.5% | 4.3%(+7.23)#60 | 4.1%(+7.40)#1,225 |
| 61. | Ashville | 11.5% | 4.3%(+7.19)#61 | 4.1%(+7.36)#1,234 |
| 62. | Elmwood Place | 11.5% | 4.3%(+7.14)#62 | 4.1%(+7.32)#1,244 |
| 63. | Kirkersville | 11.1% | 4.3%(+6.80)#63 | 4.1%(+6.98)#1,293 |
| 64. | Parral | 11.1% | 4.3%(+6.80)#64 | 4.1%(+6.98)#1,303 |
| 65. | New Lebanon | 11.0% | 4.3%(+6.65)#65 | 4.1%(+6.82)#1,339 |
| 66. | Richmond | 10.9% | 4.3%(+6.63)#66 | 4.1%(+6.80)#1,348 |
| 67. | Union | 10.9% | 4.3%(+6.57)#67 | 4.1%(+6.74)#1,365 |
| 68. | Sunbury | 10.9% | 4.3%(+6.57)#68 | 4.1%(+6.74)#1,366 |
| 69. | Gomer | 10.9% | 4.3%(+6.56)#69 | 4.1%(+6.73)#1,369 |
| 70. | Edgerton | 10.8% | 4.3%(+6.49)#70 | 4.1%(+6.66)#1,383 |
| 71. | Concorde Hills | 10.8% | 4.3%(+6.46)#71 | 4.1%(+6.63)#1,392 |
| 72. | Lakeline | 10.5% | 4.3%(+6.22)#72 | 4.1%(+6.39)#1,450 |
| 73. | Amesville | 10.5% | 4.3%(+6.22)#73 | 4.1%(+6.39)#1,451 |
| 74. | Lordstown | 10.4% | 4.3%(+6.12)#74 | 4.1%(+6.30)#1,469 |
| 75. | Carlisle | 10.4% | 4.3%(+6.05)#75 | 4.1%(+6.23)#1,486 |
| 76. | Logan | 10.3% | 4.3%(+5.99)#76 | 4.1%(+6.16)#1,501 |
| 77. | Windham | 10.2% | 4.3%(+5.92)#77 | 4.1%(+6.09)#1,521 |
| 78. | Wilberforce | 10.2% | 4.3%(+5.88)#78 | 4.1%(+6.05)#1,533 |
| 79. | Wheelersburg | 10.1% | 4.3%(+5.84)#79 | 4.1%(+6.01)#1,545 |
| 80. | Waldo | 10.1% | 4.3%(+5.84)#80 | 4.1%(+6.01)#1,547 |
| 81. | Shreve | 10.0% | 4.3%(+5.69)#81 | 4.1%(+5.86)#1,568 |
| 82. | Union City | 10.0% | 4.3%(+5.69)#82 | 4.1%(+5.86)#1,570 |
| 83. | Salem Heights | 9.9% | 4.3%(+5.59)#83 | 4.1%(+5.77)#1,615 |
| 84. | Craig Beach | 9.8% | 4.3%(+5.45)#84 | 4.1%(+5.62)#1,652 |
| 85. | Martinsville | 9.8% | 4.3%(+5.45)#85 | 4.1%(+5.62)#1,653 |
| 86. | Pleasant Run Farm | 9.7% | 4.3%(+5.42)#86 | 4.1%(+5.59)#1,661 |
| 87. | Golf Manor | 9.7% | 4.3%(+5.41)#87 | 4.1%(+5.58)#1,666 |
| 88. | Waterville | 9.7% | 4.3%(+5.40)#88 | 4.1%(+5.57)#1,670 |
| 89. | Lake Darby | 9.6% | 4.3%(+5.31)#89 | 4.1%(+5.49)#1,702 |
| 90. | Cedarville | 9.6% | 4.3%(+5.30)#90 | 4.1%(+5.47)#1,710 |
| 91. | Ney | 9.5% | 4.3%(+5.22)#91 | 4.1%(+5.39)#1,740 |
| 92. | New Riegel | 9.4% | 4.3%(+5.07)#92 | 4.1%(+5.24)#1,788 |
| 93. | Berlin | 9.1% | 4.3%(+4.78)#93 | 4.1%(+4.96)#1,864 |
| 94. | Convoy | 9.1% | 4.3%(+4.78)#94 | 4.1%(+4.96)#1,866 |
| 95. | Taylor Creek | 9.0% | 4.3%(+4.67)#95 | 4.1%(+4.85)#1,924 |
| 96. | Carroll | 9.0% | 4.3%(+4.67)#96 | 4.1%(+4.84)#1,928 |
| 97. | Bremen | 8.9% | 4.3%(+4.58)#97 | 4.1%(+4.75)#1,954 |
| 98. | Zanesfield | 8.9% | 4.3%(+4.58)#98 | 4.1%(+4.75)#1,959 |
| 99. | Dent | 8.7% | 4.3%(+4.37)#99 | 4.1%(+4.55)#2,047 |
| 100. | Liberty Center | 8.7% | 4.3%(+4.36)#100 | 4.1%(+4.54)#2,052 |
Common Questions
What are the Top 10 Cities with the Highest Percentage of Population with a Degree in Communications in Ohio?
Top 10 Cities with the Highest Percentage of Population with a Degree in Communications in Ohio are:
#1
100.0%
#2
100.0%
#3
60.0%
#4
56.5%
#5
44.4%
#6
43.8%
#7
40.0%
#8
33.3%
#9
31.5%
#10
30.4%
What city has the Highest Percentage of Population with a Degree in Communications in Ohio?
Plumwood has the Highest Percentage of Population with a Degree in Communications in Ohio with 100.0%.
What is the Percentage of Population with a Degree in Communications in the State of Ohio?
Percentage of Population with a Degree in Communications in Ohio is 4.3%.
What is the Percentage of Population with a Degree in Communications in the United States?
Percentage of Population with a Degree in Communications in the United States is 4.1%.