Cities with the Highest Percentage of Population with a Degree in Communications in Georgia
RELATED REPORTS & OPTIONS
Communications
Georgia
Compare Cities
Map of Cities with the Highest Percentage of Population with a Degree in Communications in Georgia
0.0%
100.0%
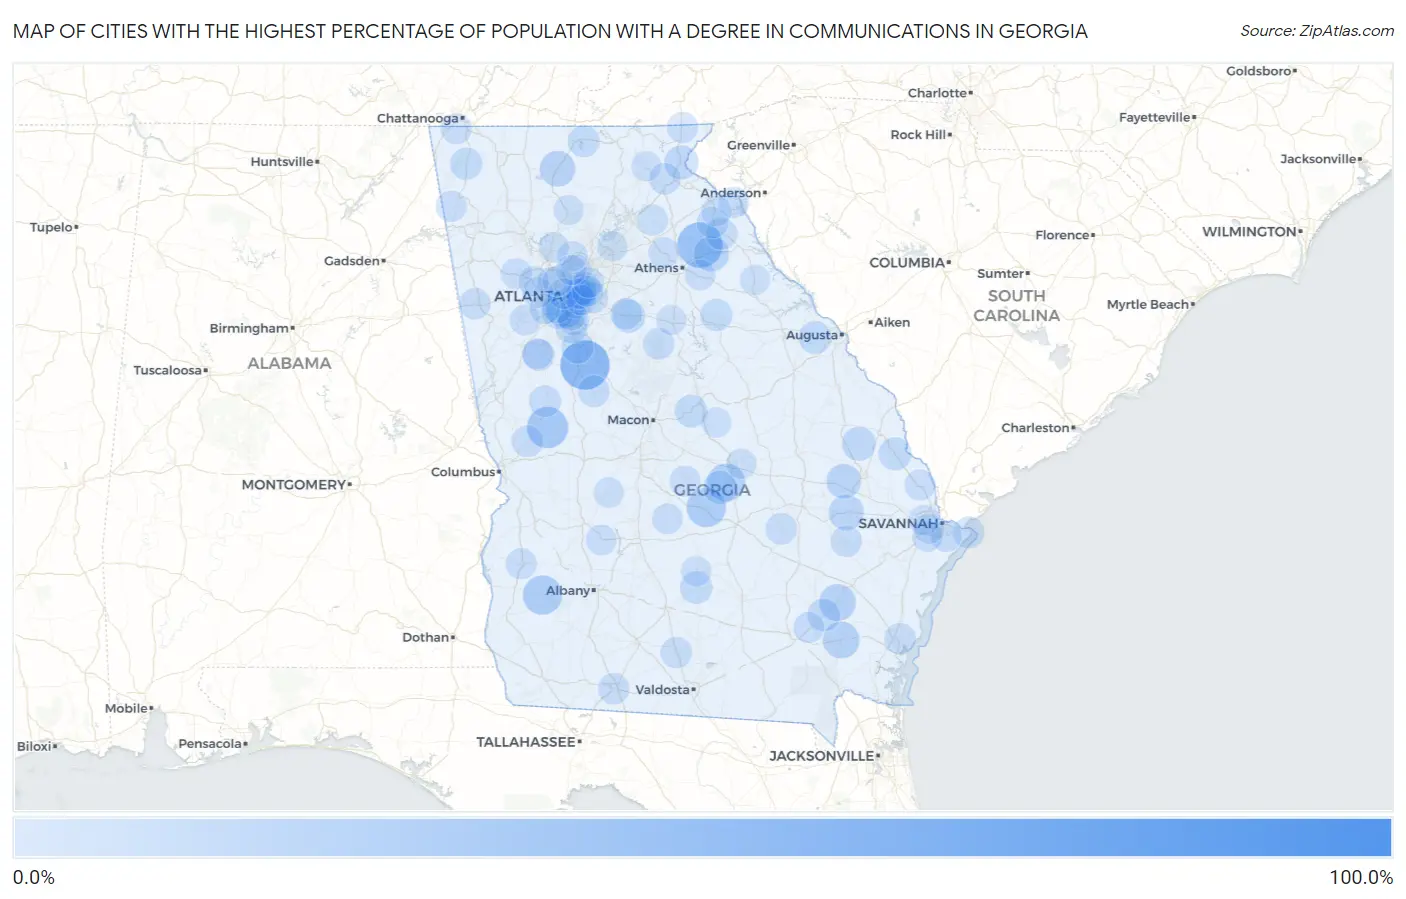
Cities with the Highest Percentage of Population with a Degree in Communications in Georgia
| City | % Graduates | vs State | vs National | |
| 1. | Box Springs | 100.0% | 4.5% (+95.5)#1 | 4.1% (+95.9)#6 |
| 2. | East Griffin | 50.0% | 4.5% (+45.5)#2 | 4.1% (+45.9)#72 |
| 3. | Danielsville | 40.8% | 4.5% (+36.3)#3 | 4.1% (+36.7)#133 |
| 4. | Eulonia | 33.3% | 4.5% (+28.8)#4 | 4.1% (+29.2)#175 |
| 5. | Woodland | 31.2% | 4.5% (+26.7)#5 | 4.1% (+27.1)#210 |
| 6. | Eastman | 26.5% | 4.5% (+22.0)#6 | 4.1% (+22.4)#280 |
| 7. | Morgan | 26.3% | 4.5% (+21.7)#7 | 4.1% (+22.1)#289 |
| 8. | Hapeville | 23.8% | 4.5% (+19.3)#8 | 4.1% (+19.6)#344 |
| 9. | Rentz | 23.5% | 4.5% (+19.0)#9 | 4.1% (+19.4)#352 |
| 10. | Nahunta | 20.6% | 4.5% (+16.1)#10 | 4.1% (+16.5)#426 |
| 11. | Screven | 20.4% | 4.5% (+15.9)#11 | 4.1% (+16.3)#435 |
| 12. | Ellijay | 18.3% | 4.5% (+13.8)#12 | 4.1% (+14.2)#529 |
| 13. | Comer | 17.7% | 4.5% (+13.2)#13 | 4.1% (+13.5)#554 |
| 14. | Hagan | 17.2% | 4.5% (+12.7)#14 | 4.1% (+13.1)#581 |
| 15. | Pulaski | 16.2% | 4.5% (+11.7)#15 | 4.1% (+12.1)#659 |
| 16. | Rocky Ford | 14.3% | 4.5% (+9.78)#16 | 4.1% (+10.2)#831 |
| 17. | Tallulah Falls | 14.3% | 4.5% (+9.78)#17 | 4.1% (+10.2)#832 |
| 18. | Cadwell | 13.9% | 4.5% (+9.38)#18 | 4.1% (+9.75)#875 |
| 19. | Covington | 12.5% | 4.5% (+7.95)#19 | 4.1% (+8.33)#1,074 |
| 20. | Newington | 12.3% | 4.5% (+7.82)#20 | 4.1% (+8.19)#1,088 |
| 21. | Patterson | 11.9% | 4.5% (+7.34)#21 | 4.1% (+7.72)#1,165 |
| 22. | Ivey | 11.8% | 4.5% (+7.26)#22 | 4.1% (+7.63)#1,176 |
| 23. | Grovetown | 11.6% | 4.5% (+7.10)#23 | 4.1% (+7.47)#1,214 |
| 24. | Ocilla | 11.4% | 4.5% (+6.94)#24 | 4.1% (+7.31)#1,245 |
| 25. | College Park | 11.4% | 4.5% (+6.86)#25 | 4.1% (+7.24)#1,252 |
| 26. | Hampton | 11.2% | 4.5% (+6.72)#26 | 4.1% (+7.09)#1,275 |
| 27. | Union Point | 10.5% | 4.5% (+6.02)#27 | 4.1% (+6.39)#1,441 |
| 28. | Lafayette | 10.4% | 4.5% (+5.88)#28 | 4.1% (+6.25)#1,482 |
| 29. | Morganton | 10.0% | 4.5% (+5.49)#29 | 4.1% (+5.86)#1,584 |
| 30. | Turin | 9.9% | 4.5% (+5.39)#30 | 4.1% (+5.77)#1,618 |
| 31. | Jonesboro | 9.9% | 4.5% (+5.35)#31 | 4.1% (+5.72)#1,632 |
| 32. | Bowman | 9.8% | 4.5% (+5.33)#32 | 4.1% (+5.70)#1,640 |
| 33. | Woodbury | 9.8% | 4.5% (+5.33)#33 | 4.1% (+5.70)#1,641 |
| 34. | Clarkston | 9.8% | 4.5% (+5.25)#34 | 4.1% (+5.62)#1,651 |
| 35. | Waverly Hall | 9.5% | 4.5% (+5.02)#35 | 4.1% (+5.39)#1,732 |
| 36. | Barnesville | 9.5% | 4.5% (+5.00)#36 | 4.1% (+5.37)#1,745 |
| 37. | Uvalda | 9.5% | 4.5% (+4.95)#37 | 4.1% (+5.32)#1,763 |
| 38. | Tybee Island | 9.4% | 4.5% (+4.92)#38 | 4.1% (+5.29)#1,772 |
| 39. | Clarkesville | 9.4% | 4.5% (+4.85)#39 | 4.1% (+5.23)#1,791 |
| 40. | Oxford | 9.3% | 4.5% (+4.78)#40 | 4.1% (+5.15)#1,815 |
| 41. | Royston | 9.1% | 4.5% (+4.58)#41 | 4.1% (+4.96)#1,861 |
| 42. | Shady Dale | 9.1% | 4.5% (+4.58)#42 | 4.1% (+4.96)#1,881 |
| 43. | Gresham Park | 9.0% | 4.5% (+4.52)#43 | 4.1% (+4.89)#1,911 |
| 44. | Thomasville | 8.8% | 4.5% (+4.32)#44 | 4.1% (+4.70)#1,975 |
| 45. | Country Club Estates | 8.8% | 4.5% (+4.32)#45 | 4.1% (+4.69)#1,979 |
| 46. | Adel | 8.8% | 4.5% (+4.25)#46 | 4.1% (+4.62)#2,008 |
| 47. | Redan | 8.7% | 4.5% (+4.23)#47 | 4.1% (+4.60)#2,016 |
| 48. | Waco | 8.6% | 4.5% (+4.06)#48 | 4.1% (+4.44)#2,089 |
| 49. | Scottdale | 8.6% | 4.5% (+4.05)#49 | 4.1% (+4.43)#2,096 |
| 50. | Glennville | 8.5% | 4.5% (+3.99)#50 | 4.1% (+4.36)#2,122 |
| 51. | Isle Of Hope | 8.5% | 4.5% (+3.95)#51 | 4.1% (+4.32)#2,143 |
| 52. | Morrow | 8.3% | 4.5% (+3.83)#52 | 4.1% (+4.20)#2,186 |
| 53. | Cuthbert | 8.2% | 4.5% (+3.65)#53 | 4.1% (+4.02)#2,287 |
| 54. | East Point | 8.1% | 4.5% (+3.61)#54 | 4.1% (+3.98)#2,302 |
| 55. | Dallas | 8.1% | 4.5% (+3.54)#55 | 4.1% (+3.92)#2,330 |
| 56. | Dillard | 8.0% | 4.5% (+3.54)#56 | 4.1% (+3.91)#2,335 |
| 57. | Forest Park | 8.0% | 4.5% (+3.53)#57 | 4.1% (+3.90)#2,337 |
| 58. | Cochran | 8.0% | 4.5% (+3.53)#58 | 4.1% (+3.90)#2,339 |
| 59. | Lookout Mountain | 8.0% | 4.5% (+3.52)#59 | 4.1% (+3.89)#2,344 |
| 60. | Lyerly | 8.0% | 4.5% (+3.49)#60 | 4.1% (+3.86)#2,357 |
| 61. | Springfield | 8.0% | 4.5% (+3.47)#61 | 4.1% (+3.85)#2,371 |
| 62. | Blackshear | 7.8% | 4.5% (+3.32)#62 | 4.1% (+3.69)#2,456 |
| 63. | Cataula | 7.7% | 4.5% (+3.18)#63 | 4.1% (+3.56)#2,513 |
| 64. | Gillsville | 7.7% | 4.5% (+3.18)#64 | 4.1% (+3.56)#2,532 |
| 65. | Dunwoody | 7.7% | 4.5% (+3.18)#65 | 4.1% (+3.55)#2,551 |
| 66. | Arcade | 7.6% | 4.5% (+3.13)#66 | 4.1% (+3.50)#2,575 |
| 67. | Decatur | 7.6% | 4.5% (+3.08)#67 | 4.1% (+3.45)#2,599 |
| 68. | Sharpsburg | 7.6% | 4.5% (+3.07)#68 | 4.1% (+3.44)#2,606 |
| 69. | Reed Creek | 7.5% | 4.5% (+3.04)#69 | 4.1% (+3.41)#2,623 |
| 70. | Arnoldsville | 7.5% | 4.5% (+3.04)#70 | 4.1% (+3.41)#2,626 |
| 71. | Chattahoochee Hills | 7.5% | 4.5% (+3.00)#71 | 4.1% (+3.37)#2,645 |
| 72. | Smyrna | 7.5% | 4.5% (+3.00)#72 | 4.1% (+3.37)#2,647 |
| 73. | Pineview | 7.3% | 4.5% (+2.81)#73 | 4.1% (+3.18)#2,789 |
| 74. | Georgetown | 7.3% | 4.5% (+2.80)#74 | 4.1% (+3.18)#2,798 |
| 75. | Leslie | 7.1% | 4.5% (+2.64)#75 | 4.1% (+3.01)#2,918 |
| 76. | Avondale Estates | 7.1% | 4.5% (+2.56)#76 | 4.1% (+2.93)#2,977 |
| 77. | Lithia Springs | 7.0% | 4.5% (+2.46)#77 | 4.1% (+2.84)#3,068 |
| 78. | Atlanta | 6.9% | 4.5% (+2.42)#78 | 4.1% (+2.79)#3,096 |
| 79. | Candler Mcafee | 6.9% | 4.5% (+2.36)#79 | 4.1% (+2.73)#3,143 |
| 80. | Pine Lake | 6.9% | 4.5% (+2.35)#80 | 4.1% (+2.72)#3,154 |
| 81. | Montezuma | 6.8% | 4.5% (+2.27)#81 | 4.1% (+2.64)#3,237 |
| 82. | Antioch | 6.8% | 4.5% (+2.27)#82 | 4.1% (+2.64)#3,240 |
| 83. | Powder Springs | 6.7% | 4.5% (+2.24)#83 | 4.1% (+2.61)#3,268 |
| 84. | Tucker | 6.7% | 4.5% (+2.23)#84 | 4.1% (+2.60)#3,276 |
| 85. | Bowersville | 6.7% | 4.5% (+2.16)#85 | 4.1% (+2.53)#3,340 |
| 86. | East Dublin | 6.6% | 4.5% (+2.14)#86 | 4.1% (+2.51)#3,371 |
| 87. | South Fulton | 6.6% | 4.5% (+2.11)#87 | 4.1% (+2.49)#3,391 |
| 88. | Fitzgerald | 6.6% | 4.5% (+2.10)#88 | 4.1% (+2.47)#3,411 |
| 89. | Pooler | 6.6% | 4.5% (+2.10)#89 | 4.1% (+2.47)#3,412 |
| 90. | Roswell | 6.6% | 4.5% (+2.07)#90 | 4.1% (+2.44)#3,438 |
| 91. | Vinings | 6.6% | 4.5% (+2.06)#91 | 4.1% (+2.43)#3,444 |
| 92. | Woodstock | 6.5% | 4.5% (+2.03)#92 | 4.1% (+2.40)#3,471 |
| 93. | Tignall | 6.5% | 4.5% (+2.01)#93 | 4.1% (+2.39)#3,480 |
| 94. | Nelson | 6.5% | 4.5% (+1.99)#94 | 4.1% (+2.36)#3,508 |
| 95. | Savannah | 6.3% | 4.5% (+1.80)#95 | 4.1% (+2.18)#3,681 |
| 96. | Toomsboro | 6.2% | 4.5% (+1.74)#96 | 4.1% (+2.11)#3,757 |
| 97. | Madison | 6.2% | 4.5% (+1.68)#97 | 4.1% (+2.05)#3,827 |
| 98. | Buford | 6.2% | 4.5% (+1.65)#98 | 4.1% (+2.03)#3,847 |
| 99. | Sandy Springs | 6.1% | 4.5% (+1.56)#99 | 4.1% (+1.93)#3,959 |
| 100. | Sautee Nacoochee | 6.1% | 4.5% (+1.55)#100 | 4.1% (+1.93)#3,967 |
Common Questions
What are the Top 10 Cities with the Highest Percentage of Population with a Degree in Communications in Georgia?
Top 10 Cities with the Highest Percentage of Population with a Degree in Communications in Georgia are:
#1
50.0%
#2
40.8%
#3
31.2%
#4
26.5%
#5
26.3%
#6
23.8%
#7
23.5%
#8
20.6%
#9
20.4%
#10
18.3%
What city has the Highest Percentage of Population with a Degree in Communications in Georgia?
East Griffin has the Highest Percentage of Population with a Degree in Communications in Georgia with 50.0%.
What is the Percentage of Population with a Degree in Communications in the State of Georgia?
Percentage of Population with a Degree in Communications in Georgia is 4.5%.
What is the Percentage of Population with a Degree in Communications in the United States?
Percentage of Population with a Degree in Communications in the United States is 4.1%.