Cities with the Highest Percentage of Population with a Degree in Communications in Minnesota
RELATED REPORTS & OPTIONS
Communications
Minnesota
Compare Cities
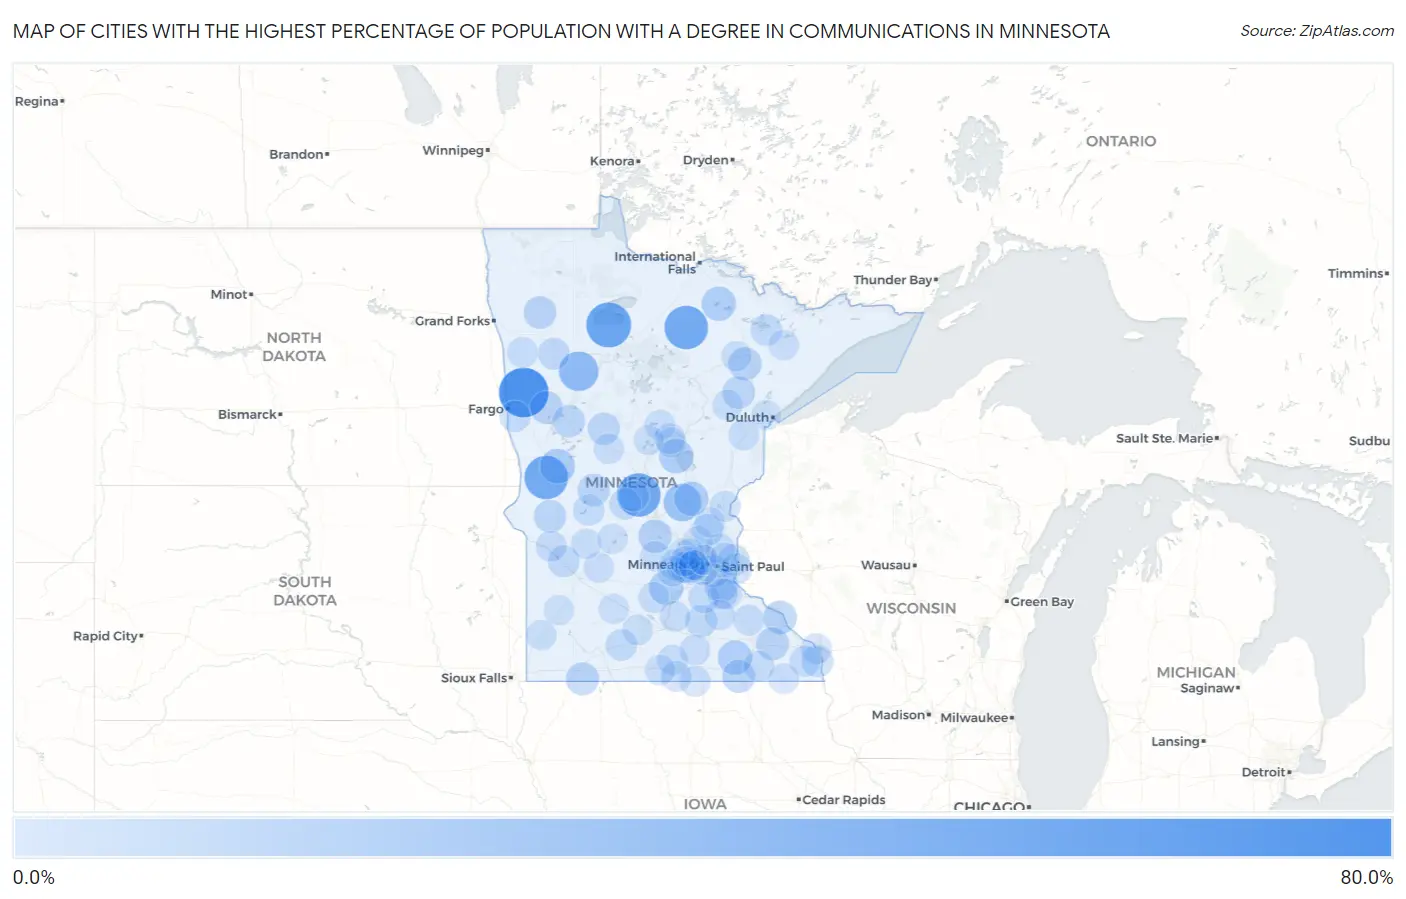
Map of Cities with the Highest Percentage of Population with a Degree in Communications in Minnesota
0.0%
80.0%
Cities with the Highest Percentage of Population with a Degree in Communications in Minnesota
| City | % Graduates | vs State | vs National | |
| 1. | Felton | 70.0% | 4.8%(+65.2)#1 | 4.1%(+65.9)#40 |
| 2. | Red Lake | 54.2% | 4.8%(+49.4)#2 | 4.1%(+50.0)#64 |
| 3. | Elmdale | 50.0% | 4.8%(+45.2)#3 | 4.1%(+45.9)#76 |
| 4. | Wendell | 50.0% | 4.8%(+45.2)#4 | 4.1%(+45.9)#79 |
| 5. | Effie | 50.0% | 4.8%(+45.2)#5 | 4.1%(+45.9)#83 |
| 6. | Roy Lake | 36.4% | 4.8%(+31.6)#6 | 4.1%(+32.2)#160 |
| 7. | Foreston | 30.3% | 4.8%(+25.5)#7 | 4.1%(+26.2)#226 |
| 8. | Dalton | 22.2% | 4.8%(+17.4)#8 | 4.1%(+18.1)#371 |
| 9. | Green Isle | 20.4% | 4.8%(+15.6)#9 | 4.1%(+16.2)#437 |
| 10. | Nett Lake | 20.0% | 4.8%(+15.2)#10 | 4.1%(+15.9)#461 |
| 11. | Garrison | 20.0% | 4.8%(+15.2)#11 | 4.1%(+15.9)#464 |
| 12. | Bock | 20.0% | 4.8%(+15.2)#12 | 4.1%(+15.9)#473 |
| 13. | Sargeant | 20.0% | 4.8%(+15.2)#13 | 4.1%(+15.9)#474 |
| 14. | Fairhaven | 17.4% | 4.8%(+12.6)#14 | 4.1%(+13.3)#571 |
| 15. | Kellogg | 17.3% | 4.8%(+12.5)#15 | 4.1%(+13.2)#578 |
| 16. | Coates | 16.7% | 4.8%(+11.9)#16 | 4.1%(+12.5)#627 |
| 17. | Iron Junction | 16.7% | 4.8%(+11.9)#17 | 4.1%(+12.5)#630 |
| 18. | Round Lake | 15.9% | 4.8%(+11.1)#18 | 4.1%(+11.8)#678 |
| 19. | Adams | 15.7% | 4.8%(+10.9)#19 | 4.1%(+11.6)#696 |
| 20. | Dover | 15.6% | 4.8%(+10.8)#20 | 4.1%(+11.4)#703 |
| 21. | St Hilaire | 15.4% | 4.8%(+10.6)#21 | 4.1%(+11.2)#722 |
| 22. | Lake Park | 15.1% | 4.8%(+10.3)#22 | 4.1%(+11.0)#742 |
| 23. | Frazee | 14.6% | 4.8%(+9.81)#23 | 4.1%(+10.4)#790 |
| 24. | Meadowlands | 14.3% | 4.8%(+9.51)#24 | 4.1%(+10.2)#839 |
| 25. | Alberta | 14.3% | 4.8%(+9.51)#25 | 4.1%(+10.2)#842 |
| 26. | Nelson | 14.3% | 4.8%(+9.51)#26 | 4.1%(+10.2)#843 |
| 27. | Sebeka | 13.6% | 4.8%(+8.78)#27 | 4.1%(+9.42)#908 |
| 28. | Watson | 12.5% | 4.8%(+7.72)#28 | 4.1%(+8.36)#1,060 |
| 29. | Mendota | 12.5% | 4.8%(+7.72)#29 | 4.1%(+8.36)#1,066 |
| 30. | St Anthony City Stearns County | 12.5% | 4.8%(+7.72)#30 | 4.1%(+8.36)#1,071 |
| 31. | Bethel | 12.2% | 4.8%(+7.47)#31 | 4.1%(+8.11)#1,099 |
| 32. | Warsaw | 12.2% | 4.8%(+7.44)#32 | 4.1%(+8.09)#1,105 |
| 33. | Winger | 12.0% | 4.8%(+7.22)#33 | 4.1%(+7.86)#1,140 |
| 34. | Tonka Bay | 11.9% | 4.8%(+7.11)#34 | 4.1%(+7.75)#1,156 |
| 35. | Hokah | 11.8% | 4.8%(+6.99)#35 | 4.1%(+7.63)#1,181 |
| 36. | Soudan | 11.5% | 4.8%(+6.76)#36 | 4.1%(+7.40)#1,226 |
| 37. | Oak Park Heights | 11.3% | 4.8%(+6.53)#37 | 4.1%(+7.18)#1,263 |
| 38. | Butterfield | 11.1% | 4.8%(+6.33)#38 | 4.1%(+6.98)#1,294 |
| 39. | St Rosa | 11.1% | 4.8%(+6.33)#39 | 4.1%(+6.98)#1,320 |
| 40. | St Anthony City Hennepin And Ramsey Counties | 10.9% | 4.8%(+6.11)#40 | 4.1%(+6.75)#1,363 |
| 41. | Lake St Croix Beach | 10.7% | 4.8%(+5.96)#41 | 4.1%(+6.60)#1,393 |
| 42. | Sabin | 10.6% | 4.8%(+5.79)#42 | 4.1%(+6.43)#1,432 |
| 43. | Elko New Market | 10.5% | 4.8%(+5.77)#43 | 4.1%(+6.41)#1,438 |
| 44. | Watertown | 10.5% | 4.8%(+5.74)#44 | 4.1%(+6.38)#1,452 |
| 45. | Minnetrista | 10.5% | 4.8%(+5.69)#45 | 4.1%(+6.33)#1,464 |
| 46. | Glenwood | 10.4% | 4.8%(+5.63)#46 | 4.1%(+6.28)#1,477 |
| 47. | Gaylord | 9.7% | 4.8%(+4.95)#47 | 4.1%(+5.59)#1,659 |
| 48. | Emmons | 9.7% | 4.8%(+4.90)#48 | 4.1%(+5.54)#1,686 |
| 49. | Dakota | 9.7% | 4.8%(+4.90)#49 | 4.1%(+5.54)#1,687 |
| 50. | Appleton | 9.6% | 4.8%(+4.84)#50 | 4.1%(+5.48)#1,705 |
| 51. | Houston | 9.6% | 4.8%(+4.80)#51 | 4.1%(+5.44)#1,720 |
| 52. | Mazeppa | 9.5% | 4.8%(+4.75)#52 | 4.1%(+5.39)#1,729 |
| 53. | Cleveland | 9.5% | 4.8%(+4.75)#53 | 4.1%(+5.39)#1,730 |
| 54. | Rush City | 9.5% | 4.8%(+4.70)#54 | 4.1%(+5.34)#1,757 |
| 55. | Long Lake | 9.2% | 4.8%(+4.47)#55 | 4.1%(+5.11)#1,827 |
| 56. | Easton | 9.1% | 4.8%(+4.31)#56 | 4.1%(+4.96)#1,890 |
| 57. | Beltrami | 9.1% | 4.8%(+4.31)#57 | 4.1%(+4.96)#1,891 |
| 58. | New Trier | 9.1% | 4.8%(+4.31)#58 | 4.1%(+4.96)#1,892 |
| 59. | Spring Valley | 9.0% | 4.8%(+4.23)#59 | 4.1%(+4.87)#1,915 |
| 60. | Bricelyn | 8.9% | 4.8%(+4.11)#60 | 4.1%(+4.75)#1,956 |
| 61. | Cuyuna | 8.9% | 4.8%(+4.11)#61 | 4.1%(+4.75)#1,958 |
| 62. | Mahtowa | 8.8% | 4.8%(+4.05)#62 | 4.1%(+4.69)#1,984 |
| 63. | Floodwood | 8.7% | 4.8%(+3.92)#63 | 4.1%(+4.56)#2,035 |
| 64. | Hanska | 8.7% | 4.8%(+3.92)#64 | 4.1%(+4.56)#2,038 |
| 65. | Mound | 8.7% | 4.8%(+3.90)#65 | 4.1%(+4.55)#2,046 |
| 66. | Canton | 8.6% | 4.8%(+3.84)#66 | 4.1%(+4.49)#2,071 |
| 67. | Crosslake | 8.5% | 4.8%(+3.76)#67 | 4.1%(+4.40)#2,103 |
| 68. | Upsala | 8.5% | 4.8%(+3.73)#68 | 4.1%(+4.38)#2,119 |
| 69. | Verndale | 8.5% | 4.8%(+3.70)#69 | 4.1%(+4.34)#2,135 |
| 70. | New Richland | 8.4% | 4.8%(+3.63)#70 | 4.1%(+4.28)#2,168 |
| 71. | New Hope | 8.3% | 4.8%(+3.57)#71 | 4.1%(+4.21)#2,184 |
| 72. | Woodland | 8.3% | 4.8%(+3.49)#72 | 4.1%(+4.13)#2,231 |
| 73. | Babbitt | 8.2% | 4.8%(+3.45)#73 | 4.1%(+4.09)#2,253 |
| 74. | St. John's University | 8.2% | 4.8%(+3.42)#74 | 4.1%(+4.06)#2,267 |
| 75. | Hampton | 8.1% | 4.8%(+3.33)#75 | 4.1%(+3.97)#2,306 |
| 76. | Edina | 8.0% | 4.8%(+3.23)#76 | 4.1%(+3.87)#2,352 |
| 77. | Blue Earth | 8.0% | 4.8%(+3.21)#77 | 4.1%(+3.85)#2,369 |
| 78. | Cokato | 7.9% | 4.8%(+3.13)#78 | 4.1%(+3.78)#2,400 |
| 79. | Minnetonka Beach | 7.7% | 4.8%(+2.94)#79 | 4.1%(+3.59)#2,501 |
| 80. | Buhl | 7.7% | 4.8%(+2.91)#80 | 4.1%(+3.56)#2,517 |
| 81. | Prinsburg | 7.7% | 4.8%(+2.91)#81 | 4.1%(+3.56)#2,525 |
| 82. | Murdock | 7.7% | 4.8%(+2.91)#82 | 4.1%(+3.56)#2,533 |
| 83. | Holland | 7.7% | 4.8%(+2.91)#83 | 4.1%(+3.56)#2,535 |
| 84. | Nerstrand | 7.7% | 4.8%(+2.91)#84 | 4.1%(+3.56)#2,538 |
| 85. | Ramsey | 7.6% | 4.8%(+2.86)#85 | 4.1%(+3.50)#2,576 |
| 86. | Nisswa | 7.6% | 4.8%(+2.84)#86 | 4.1%(+3.49)#2,581 |
| 87. | Corcoran | 7.6% | 4.8%(+2.79)#87 | 4.1%(+3.44)#2,609 |
| 88. | New London | 7.6% | 4.8%(+2.79)#88 | 4.1%(+3.43)#2,610 |
| 89. | Morgan | 7.6% | 4.8%(+2.78)#89 | 4.1%(+3.43)#2,612 |
| 90. | Greenfield | 7.5% | 4.8%(+2.74)#90 | 4.1%(+3.39)#2,639 |
| 91. | Mayer | 7.4% | 4.8%(+2.63)#91 | 4.1%(+3.27)#2,698 |
| 92. | Deerwood | 7.4% | 4.8%(+2.60)#92 | 4.1%(+3.24)#2,733 |
| 93. | Maple Plain | 7.4% | 4.8%(+2.59)#93 | 4.1%(+3.23)#2,739 |
| 94. | Wayzata | 7.4% | 4.8%(+2.59)#94 | 4.1%(+3.23)#2,748 |
| 95. | Lynd | 7.4% | 4.8%(+2.57)#95 | 4.1%(+3.22)#2,756 |
| 96. | Hermantown | 7.3% | 4.8%(+2.55)#96 | 4.1%(+3.20)#2,770 |
| 97. | Centerville | 7.3% | 4.8%(+2.54)#97 | 4.1%(+3.19)#2,780 |
| 98. | Robbinsdale | 7.2% | 4.8%(+2.45)#98 | 4.1%(+3.09)#2,848 |
| 99. | Isanti | 7.2% | 4.8%(+2.39)#99 | 4.1%(+3.03)#2,893 |
| 100. | Willernie | 7.1% | 4.8%(+2.36)#100 | 4.1%(+3.01)#2,921 |
Common Questions
What are the Top 10 Cities with the Highest Percentage of Population with a Degree in Communications in Minnesota?
Top 10 Cities with the Highest Percentage of Population with a Degree in Communications in Minnesota are:
What city has the Highest Percentage of Population with a Degree in Communications in Minnesota?
Felton has the Highest Percentage of Population with a Degree in Communications in Minnesota with 70.0%.
What is the Percentage of Population with a Degree in Communications in the State of Minnesota?
Percentage of Population with a Degree in Communications in Minnesota is 4.8%.
What is the Percentage of Population with a Degree in Communications in the United States?
Percentage of Population with a Degree in Communications in the United States is 4.1%.