Cities with the Highest Percentage of Population with a Degree in Communications in Alaska
RELATED REPORTS & OPTIONS
Communications
Alaska
Compare Cities
Map of Cities with the Highest Percentage of Population with a Degree in Communications in Alaska
0.0%
60.0%
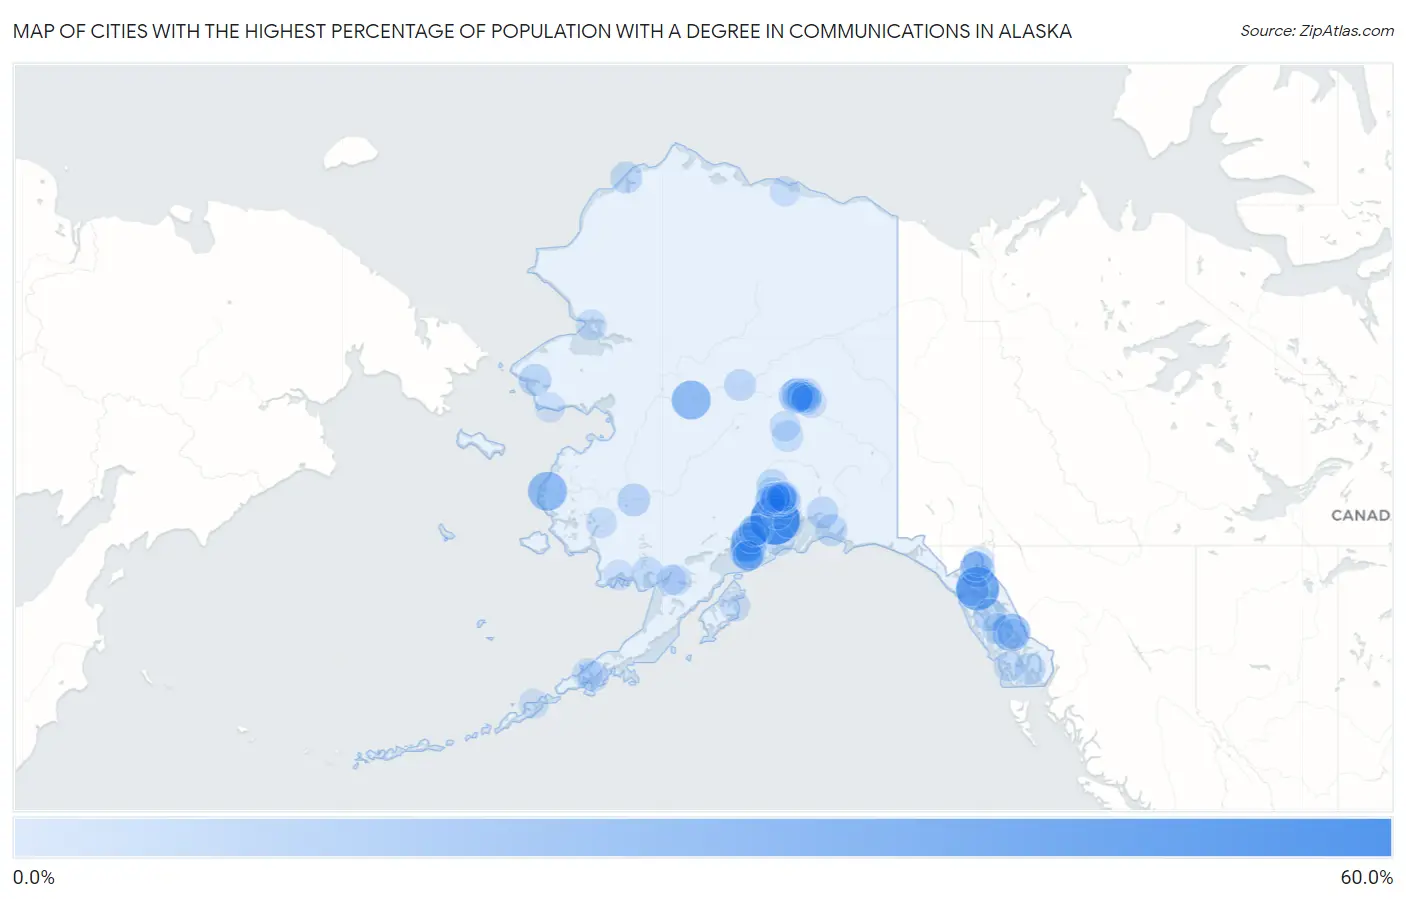
Cities with the Highest Percentage of Population with a Degree in Communications in Alaska
| City | % Graduates | vs State | vs National | |
| 1. | Hope | 56.1% | 2.5% (+53.6)#1 | 4.1% (+52.0)#58 |
| 2. | Excursion Inlet | 37.5% | 2.5% (+35.0)#2 | 4.1% (+33.4)#150 |
| 3. | Scammon Bay | 25.0% | 2.5% (+22.5)#3 | 4.1% (+20.9)#306 |
| 4. | Ruby | 25.0% | 2.5% (+22.5)#4 | 4.1% (+20.9)#314 |
| 5. | Kupreanof | 22.2% | 2.5% (+19.7)#5 | 4.1% (+18.1)#381 |
| 6. | Ninilchik | 17.2% | 2.5% (+14.6)#6 | 4.1% (+13.0)#587 |
| 7. | Ester | 13.5% | 2.5% (+11.0)#7 | 4.1% (+9.37)#910 |
| 8. | Mud Bay | 13.5% | 2.5% (+10.9)#8 | 4.1% (+9.33)#914 |
| 9. | Clam Gulch | 12.2% | 2.5% (+9.71)#9 | 4.1% (+8.11)#1,100 |
| 10. | Gustavus | 7.5% | 2.5% (+4.95)#10 | 4.1% (+3.36)#2,656 |
| 11. | Diamond Ridge | 7.4% | 2.5% (+4.83)#11 | 4.1% (+3.23)#2,746 |
| 12. | Aniak | 7.3% | 2.5% (+4.78)#12 | 4.1% (+3.18)#2,790 |
| 13. | Angoon | 7.1% | 2.5% (+4.61)#13 | 4.1% (+3.01)#2,922 |
| 14. | Brevig Mission | 6.7% | 2.5% (+4.13)#14 | 4.1% (+2.53)#3,334 |
| 15. | Susitna North | 5.4% | 2.5% (+2.84)#15 | 4.1% (+1.25)#4,864 |
| 16. | Cordova | 5.4% | 2.5% (+2.84)#16 | 4.1% (+1.24)#4,872 |
| 17. | Anchor Point | 5.3% | 2.5% (+2.76)#17 | 4.1% (+1.16)#4,978 |
| 18. | Knik River | 5.3% | 2.5% (+2.73)#18 | 4.1% (+1.13)#5,036 |
| 19. | Tanana | 5.3% | 2.5% (+2.73)#19 | 4.1% (+1.13)#5,059 |
| 20. | Valdez | 5.0% | 2.5% (+2.51)#20 | 4.1% (+0.912)#5,385 |
| 21. | Goldstream | 5.0% | 2.5% (+2.50)#21 | 4.1% (+0.902)#5,400 |
| 22. | Wainwright | 4.8% | 2.5% (+2.23)#22 | 4.1% (+0.627)#5,889 |
| 23. | Utqiagvik | 4.6% | 2.5% (+2.09)#23 | 4.1% (+0.495)#6,163 |
| 24. | Ketchikan | 4.4% | 2.5% (+1.87)#24 | 4.1% (+0.276)#6,630 |
| 25. | Palmer | 3.9% | 2.5% (+1.38)#25 | 4.1% (-0.216)#7,730 |
| 26. | Steele Creek | 3.8% | 2.5% (+1.24)#26 | 4.1% (-0.362)#8,092 |
| 27. | Fairbanks | 3.6% | 2.5% (+1.03)#27 | 4.1% (-0.568)#8,573 |
| 28. | Denali Park | 3.6% | 2.5% (+1.02)#28 | 4.1% (-0.582)#8,596 |
| 29. | Bear Creek | 3.5% | 2.5% (+0.999)#29 | 4.1% (-0.600)#8,633 |
| 30. | Willow | 3.4% | 2.5% (+0.858)#30 | 4.1% (-0.740)#8,988 |
| 31. | Kake | 3.4% | 2.5% (+0.853)#31 | 4.1% (-0.745)#9,010 |
| 32. | Happy Valley | 3.3% | 2.5% (+0.769)#32 | 4.1% (-0.829)#9,232 |
| 33. | Knik Fairview | 3.3% | 2.5% (+0.728)#33 | 4.1% (-0.871)#9,330 |
| 34. | Tanaina | 3.1% | 2.5% (+0.533)#34 | 4.1% (-1.07)#9,814 |
| 35. | Dillingham | 3.0% | 2.5% (+0.475)#35 | 4.1% (-1.12)#9,959 |
| 36. | Juneau City And Borough | 3.0% | 2.5% (+0.430)#36 | 4.1% (-1.17)#10,090 |
| 37. | Ridgeway | 2.9% | 2.5% (+0.412)#37 | 4.1% (-1.19)#10,139 |
| 38. | Farmers Loop | 2.9% | 2.5% (+0.411)#38 | 4.1% (-1.19)#10,140 |
| 39. | Kachemak | 2.8% | 2.5% (+0.275)#39 | 4.1% (-1.32)#10,507 |
| 40. | Anchorage | 2.7% | 2.5% (+0.144)#40 | 4.1% (-1.45)#10,843 |
| 41. | Butte | 2.6% | 2.5% (+0.082)#41 | 4.1% (-1.52)#10,999 |
| 42. | Kotzebue | 2.5% | 2.5% (-0.018)#42 | 4.1% (-1.62)#11,243 |
| 43. | Fritz Creek | 2.5% | 2.5% (-0.086)#43 | 4.1% (-1.68)#11,411 |
| 44. | Houston | 2.4% | 2.5% (-0.127)#44 | 4.1% (-1.73)#11,527 |
| 45. | Healy | 2.4% | 2.5% (-0.133)#45 | 4.1% (-1.73)#11,547 |
| 46. | Cohoe | 2.4% | 2.5% (-0.146)#46 | 4.1% (-1.74)#11,585 |
| 47. | Sitka City And Borough | 2.4% | 2.5% (-0.168)#47 | 4.1% (-1.77)#11,638 |
| 48. | Skagway | 2.4% | 2.5% (-0.184)#48 | 4.1% (-1.78)#11,680 |
| 49. | King Salmon | 2.4% | 2.5% (-0.184)#49 | 4.1% (-1.78)#11,687 |
| 50. | Gateway | 2.3% | 2.5% (-0.242)#50 | 4.1% (-1.84)#11,821 |
| 51. | Soldotna | 2.2% | 2.5% (-0.325)#51 | 4.1% (-1.92)#12,033 |
| 52. | Bethel | 2.2% | 2.5% (-0.348)#52 | 4.1% (-1.95)#12,090 |
| 53. | South Lakes | 2.0% | 2.5% (-0.487)#53 | 4.1% (-2.09)#12,442 |
| 54. | Eielson Afb | 2.0% | 2.5% (-0.554)#54 | 4.1% (-2.15)#12,600 |
| 55. | College | 1.9% | 2.5% (-0.602)#55 | 4.1% (-2.20)#12,699 |
| 56. | Whittier | 1.9% | 2.5% (-0.685)#56 | 4.1% (-2.28)#12,901 |
| 57. | Lazy Mountain | 1.7% | 2.5% (-0.842)#57 | 4.1% (-2.44)#13,219 |
| 58. | Wasilla | 1.7% | 2.5% (-0.860)#58 | 4.1% (-2.46)#13,265 |
| 59. | North Lakes | 1.6% | 2.5% (-0.959)#59 | 4.1% (-2.56)#13,488 |
| 60. | Badger | 1.5% | 2.5% (-0.998)#60 | 4.1% (-2.60)#13,563 |
| 61. | Farm Loop | 1.4% | 2.5% (-1.13)#61 | 4.1% (-2.73)#13,815 |
| 62. | North Pole | 1.2% | 2.5% (-1.29)#62 | 4.1% (-2.89)#14,116 |
| 63. | Sterling | 1.2% | 2.5% (-1.29)#63 | 4.1% (-2.89)#14,118 |
| 64. | Togiak | 1.2% | 2.5% (-1.35)#64 | 4.1% (-2.94)#14,211 |
| 65. | King Cove | 1.2% | 2.5% (-1.36)#65 | 4.1% (-2.96)#14,240 |
| 66. | Cold Bay | 1.2% | 2.5% (-1.37)#66 | 4.1% (-2.97)#14,273 |
| 67. | Chena Ridge | 1.1% | 2.5% (-1.41)#67 | 4.1% (-3.01)#14,335 |
| 68. | Homer | 1.1% | 2.5% (-1.44)#68 | 4.1% (-3.04)#14,384 |
| 69. | Naknek | 1.1% | 2.5% (-1.46)#69 | 4.1% (-3.06)#14,427 |
| 70. | Kodiak | 1.1% | 2.5% (-1.47)#70 | 4.1% (-3.06)#14,432 |
| 71. | Craig | 1.1% | 2.5% (-1.48)#71 | 4.1% (-3.08)#14,468 |
| 72. | Prudhoe Bay | 1.0% | 2.5% (-1.52)#72 | 4.1% (-3.12)#14,523 |
| 73. | Big Lake | 0.88% | 2.5% (-1.66)#73 | 4.1% (-3.26)#14,726 |
| 74. | Buffalo Soapstone | 0.85% | 2.5% (-1.68)#74 | 4.1% (-3.28)#14,755 |
| 75. | Meadow Lakes | 0.83% | 2.5% (-1.70)#75 | 4.1% (-3.30)#14,784 |
| 76. | Petersburg | 0.77% | 2.5% (-1.77)#76 | 4.1% (-3.37)#14,867 |
| 77. | Nome | 0.59% | 2.5% (-1.95)#77 | 4.1% (-3.55)#15,038 |
| 78. | Haines | 0.53% | 2.5% (-2.00)#78 | 4.1% (-3.60)#15,078 |
| 79. | Unalaska | 0.36% | 2.5% (-2.18)#79 | 4.1% (-3.78)#15,176 |
| 80. | Wrangell City And Borough | 0.31% | 2.5% (-2.22)#80 | 4.1% (-3.82)#15,198 |
Common Questions
What are the Top 10 Cities with the Highest Percentage of Population with a Degree in Communications in Alaska?
Top 10 Cities with the Highest Percentage of Population with a Degree in Communications in Alaska are:
#1
56.1%
#2
37.5%
#3
25.0%
#4
25.0%
#5
22.2%
#6
17.2%
#7
13.5%
#8
13.5%
#9
12.2%
#10
7.5%
What city has the Highest Percentage of Population with a Degree in Communications in Alaska?
Hope has the Highest Percentage of Population with a Degree in Communications in Alaska with 56.1%.
What is the Percentage of Population with a Degree in Communications in the State of Alaska?
Percentage of Population with a Degree in Communications in Alaska is 2.5%.
What is the Percentage of Population with a Degree in Communications in the United States?
Percentage of Population with a Degree in Communications in the United States is 4.1%.