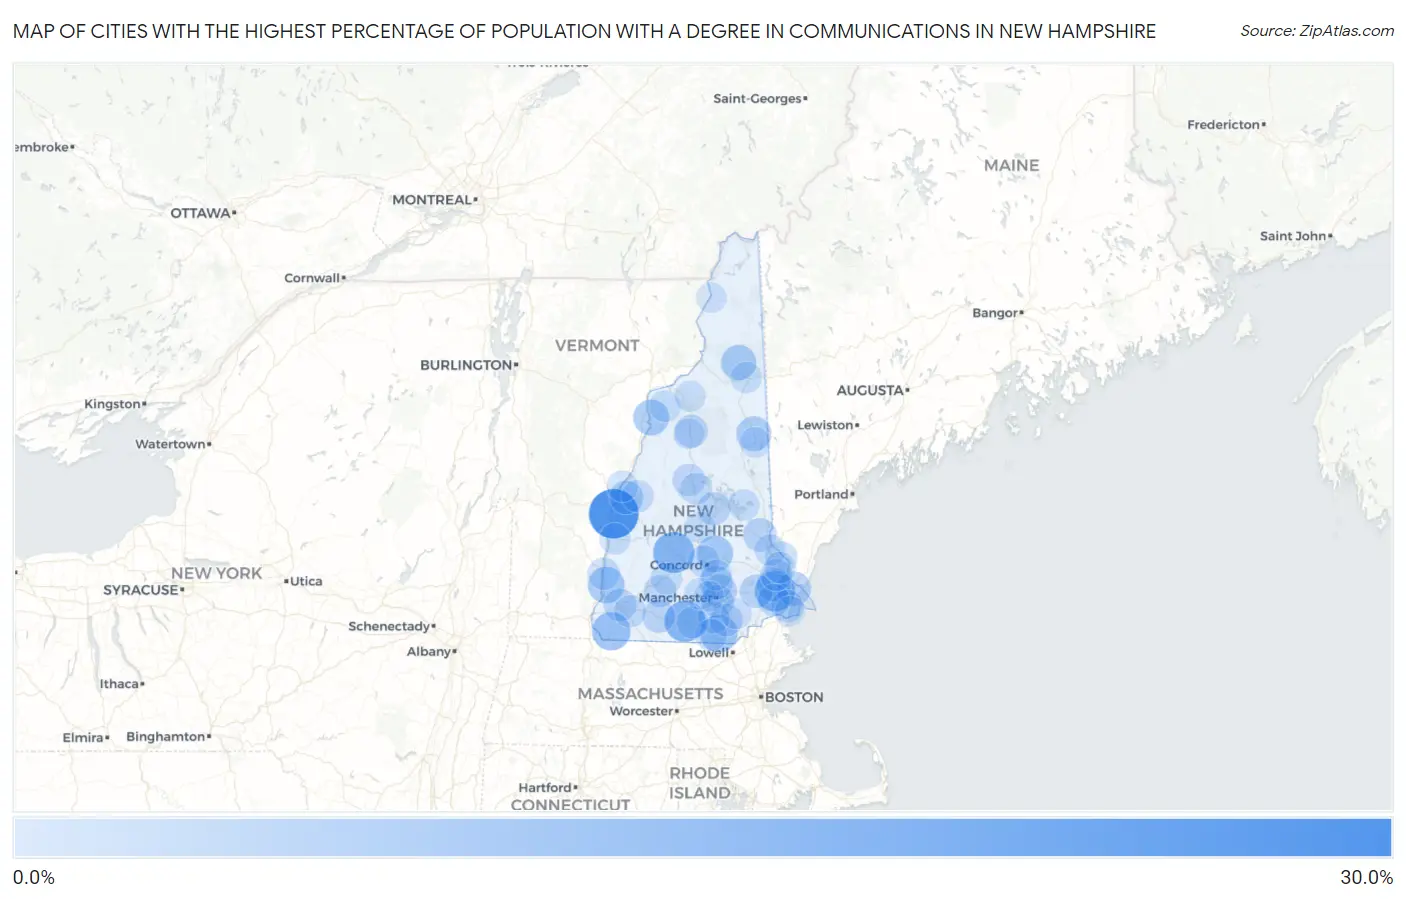
Cities with the Highest Percentage of Population with a Degree in Communications in New Hampshire
RELATED REPORTS & OPTIONS
Communications
New Hampshire
Compare Cities
Map of Cities with the Highest Percentage of Population with a Degree in Communications in New Hampshire
0.0%
30.0%

Cities with the Highest Percentage of Population with a Degree in Communications in New Hampshire
| City | % Graduates | vs State | vs National | |
| 1. | Plainfield | 28.3% | 3.0%(+25.3)#1 | 4.1%(+24.2)#252 |
| 2. | Wilton | 15.8% | 3.0%(+12.8)#2 | 4.1%(+11.7)#685 |
| 3. | Warner | 15.8% | 3.0%(+12.8)#3 | 4.1%(+11.7)#692 |
| 4. | Newfields | 14.7% | 3.0%(+11.7)#4 | 4.1%(+10.6)#776 |
| 5. | Winchester | 11.7% | 3.0%(+8.67)#5 | 4.1%(+7.55)#1,205 |
| 6. | Hudson | 10.4% | 3.0%(+7.42)#6 | 4.1%(+6.30)#1,468 |
| 7. | Walpole | 9.2% | 3.0%(+6.15)#7 | 4.1%(+5.04)#1,841 |
| 8. | Loudon | 8.6% | 3.0%(+5.59)#8 | 4.1%(+4.48)#2,073 |
| 9. | Woodsville | 8.2% | 3.0%(+5.13)#9 | 4.1%(+4.02)#2,288 |
| 10. | Berlin | 7.3% | 3.0%(+4.24)#10 | 4.1%(+3.13)#2,826 |
| 11. | North Conway | 6.9% | 3.0%(+3.83)#11 | 4.1%(+2.72)#3,155 |
| 12. | Portsmouth | 6.3% | 3.0%(+3.29)#12 | 4.1%(+2.18)#3,676 |
| 13. | South Hooksett | 5.3% | 3.0%(+2.32)#13 | 4.1%(+1.21)#4,912 |
| 14. | Hooksett | 5.0% | 3.0%(+1.99)#14 | 4.1%(+0.879)#5,433 |
| 15. | Lebanon | 4.8% | 3.0%(+1.80)#15 | 4.1%(+0.690)#5,786 |
| 16. | Newmarket | 4.7% | 3.0%(+1.65)#16 | 4.1%(+0.537)#6,068 |
| 17. | Farmington | 4.6% | 3.0%(+1.61)#17 | 4.1%(+0.495)#6,165 |
| 18. | Epping | 4.6% | 3.0%(+1.57)#18 | 4.1%(+0.457)#6,241 |
| 19. | Laconia | 4.4% | 3.0%(+1.36)#19 | 4.1%(+0.242)#6,701 |
| 20. | Peterborough | 4.2% | 3.0%(+1.21)#20 | 4.1%(+0.094)#7,045 |
| 21. | Lincoln | 4.1% | 3.0%(+1.10)#21 | 4.1%(-0.015)#7,299 |
| 22. | Keene | 3.9% | 3.0%(+0.841)#22 | 4.1%(-0.274)#7,871 |
| 23. | Manchester | 3.7% | 3.0%(+0.633)#23 | 4.1%(-0.481)#8,361 |
| 24. | Londonderry | 3.5% | 3.0%(+0.475)#24 | 4.1%(-0.639)#8,750 |
| 25. | Plymouth | 3.4% | 3.0%(+0.363)#25 | 4.1%(-0.751)#9,020 |
| 26. | Antrim | 3.2% | 3.0%(+0.226)#26 | 4.1%(-0.888)#9,375 |
| 27. | Hampton | 3.0% | 3.0%(-0.001)#27 | 4.1%(-1.12)#9,947 |
| 28. | Marlborough | 3.0% | 3.0%(-0.018)#28 | 4.1%(-1.13)#9,988 |
| 29. | North Walpole | 3.0% | 3.0%(-0.036)#29 | 4.1%(-1.15)#10,036 |
| 30. | Somersworth | 2.9% | 3.0%(-0.131)#30 | 4.1%(-1.25)#10,295 |
| 31. | Exeter | 2.9% | 3.0%(-0.163)#31 | 4.1%(-1.28)#10,364 |
| 32. | Enfield | 2.8% | 3.0%(-0.206)#32 | 4.1%(-1.32)#10,502 |
| 33. | Francestown | 2.8% | 3.0%(-0.243)#33 | 4.1%(-1.36)#10,606 |
| 34. | Durham | 2.6% | 3.0%(-0.400)#34 | 4.1%(-1.51)#10,996 |
| 35. | Concord | 2.6% | 3.0%(-0.434)#35 | 4.1%(-1.55)#11,083 |
| 36. | East Merrimack | 2.6% | 3.0%(-0.458)#36 | 4.1%(-1.57)#11,150 |
| 37. | Nashua | 2.6% | 3.0%(-0.460)#37 | 4.1%(-1.57)#11,154 |
| 38. | Ashland | 2.5% | 3.0%(-0.558)#38 | 4.1%(-1.67)#11,381 |
| 39. | Milford | 2.4% | 3.0%(-0.572)#39 | 4.1%(-1.69)#11,415 |
| 40. | Hillsborough | 2.2% | 3.0%(-0.831)#40 | 4.1%(-1.95)#12,087 |
| 41. | Lisbon | 2.1% | 3.0%(-0.966)#41 | 4.1%(-2.08)#12,425 |
| 42. | Goffstown | 2.0% | 3.0%(-1.02)#42 | 4.1%(-2.14)#12,559 |
| 43. | Rochester | 1.9% | 3.0%(-1.07)#43 | 4.1%(-2.19)#12,667 |
| 44. | Claremont | 1.9% | 3.0%(-1.09)#44 | 4.1%(-2.20)#12,701 |
| 45. | Dover | 1.9% | 3.0%(-1.12)#45 | 4.1%(-2.23)#12,767 |
| 46. | Hanover | 1.9% | 3.0%(-1.15)#46 | 4.1%(-2.26)#12,847 |
| 47. | Wolfeboro | 1.9% | 3.0%(-1.16)#47 | 4.1%(-2.27)#12,873 |
| 48. | Gorham | 1.8% | 3.0%(-1.27)#48 | 4.1%(-2.38)#13,108 |
| 49. | Tilton Northfield | 1.7% | 3.0%(-1.33)#49 | 4.1%(-2.44)#13,231 |
| 50. | Bethlehem | 1.4% | 3.0%(-1.63)#50 | 4.1%(-2.75)#13,854 |
| 51. | Suncook | 1.2% | 3.0%(-1.85)#51 | 4.1%(-2.97)#14,259 |
| 52. | North Woodstock | 1.1% | 3.0%(-1.94)#52 | 4.1%(-3.05)#14,411 |
| 53. | Conway | 0.91% | 3.0%(-2.11)#53 | 4.1%(-3.22)#14,670 |
| 54. | Derry | 0.80% | 3.0%(-2.22)#54 | 4.1%(-3.33)#14,820 |
| 55. | Colebrook | 0.75% | 3.0%(-2.27)#55 | 4.1%(-3.39)#14,893 |
| 56. | Pinardville | 0.65% | 3.0%(-2.37)#56 | 4.1%(-3.49)#14,989 |
| 57. | Hampton Beach | 0.45% | 3.0%(-2.57)#57 | 4.1%(-3.69)#15,139 |
1
Common Questions
What are the Top 10 Cities with the Highest Percentage of Population with a Degree in Communications in New Hampshire?
Top 10 Cities with the Highest Percentage of Population with a Degree in Communications in New Hampshire are:
#1
28.3%
#2
15.8%
#3
15.8%
#4
14.7%
#5
11.7%
#6
10.4%
#7
9.2%
#8
8.6%
#9
8.2%
#10
7.3%
What city has the Highest Percentage of Population with a Degree in Communications in New Hampshire?
Plainfield has the Highest Percentage of Population with a Degree in Communications in New Hampshire with 28.3%.
What is the Percentage of Population with a Degree in Communications in the State of New Hampshire?
Percentage of Population with a Degree in Communications in New Hampshire is 3.0%.
What is the Percentage of Population with a Degree in Communications in the United States?
Percentage of Population with a Degree in Communications in the United States is 4.1%.