Cities with the Highest Percentage of Population with a Degree in Communications in West Virginia
RELATED REPORTS & OPTIONS
Communications
West Virginia
Compare Cities
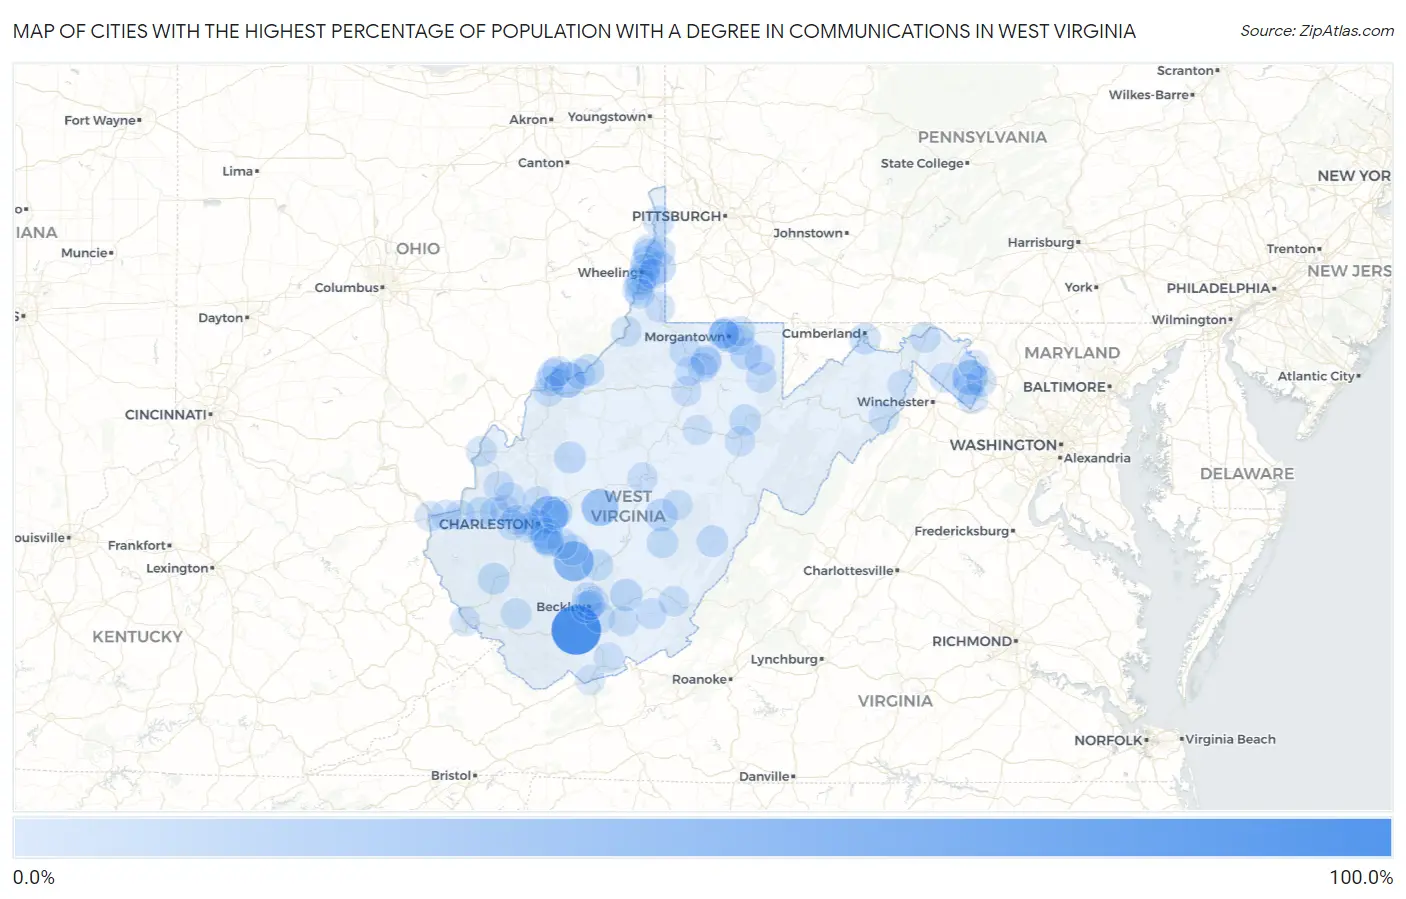
Map of Cities with the Highest Percentage of Population with a Degree in Communications in West Virginia
0.0%
100.0%
Cities with the Highest Percentage of Population with a Degree in Communications in West Virginia
| City | % Graduates | vs State | vs National | |
| 1. | Rhodell | 100.0% | 3.1%(+96.9)#1 | 4.1%(+95.9)#14 |
| 2. | Sprague | 64.0% | 3.1%(+60.9)#2 | 4.1%(+59.9)#47 |
| 3. | Powellton | 50.0% | 3.1%(+46.9)#3 | 4.1%(+45.9)#73 |
| 4. | Big Chimney | 40.9% | 3.1%(+37.9)#4 | 4.1%(+36.8)#132 |
| 5. | Clay | 35.1% | 3.1%(+32.1)#5 | 4.1%(+31.0)#166 |
| 6. | Waverly | 28.6% | 3.1%(+25.5)#6 | 4.1%(+24.4)#246 |
| 7. | Shenandoah Junction | 26.5% | 3.1%(+23.5)#7 | 4.1%(+22.4)#279 |
| 8. | Cowen | 14.3% | 3.1%(+11.2)#8 | 4.1%(+10.2)#816 |
| 9. | Meadow Bridge | 13.2% | 3.1%(+10.1)#9 | 4.1%(+9.02)#969 |
| 10. | Reedsville | 12.5% | 3.1%(+9.45)#10 | 4.1%(+8.36)#1,049 |
| 11. | Elkview | 12.3% | 3.1%(+9.20)#11 | 4.1%(+8.12)#1,095 |
| 12. | Boaz | 11.2% | 3.1%(+8.14)#12 | 4.1%(+7.06)#1,278 |
| 13. | Valley Grove | 11.1% | 3.1%(+8.06)#13 | 4.1%(+6.98)#1,295 |
| 14. | Rand | 10.5% | 3.1%(+7.43)#14 | 4.1%(+6.35)#1,460 |
| 15. | Marlinton | 10.3% | 3.1%(+7.26)#15 | 4.1%(+6.18)#1,497 |
| 16. | Spencer | 10.1% | 3.1%(+7.09)#16 | 4.1%(+6.01)#1,546 |
| 17. | Chapmanville | 10.1% | 3.1%(+7.06)#17 | 4.1%(+5.98)#1,557 |
| 18. | Montrose | 9.1% | 3.1%(+6.04)#18 | 4.1%(+4.96)#1,880 |
| 19. | Fayetteville | 8.7% | 3.1%(+5.64)#19 | 4.1%(+4.56)#2,028 |
| 20. | St Marys | 8.2% | 3.1%(+5.19)#20 | 4.1%(+4.11)#2,241 |
| 21. | Westover | 8.2% | 3.1%(+5.15)#21 | 4.1%(+4.07)#2,266 |
| 22. | Mcmechen | 8.0% | 3.1%(+4.91)#22 | 4.1%(+3.83)#2,376 |
| 23. | Milton | 7.9% | 3.1%(+4.83)#23 | 4.1%(+3.75)#2,419 |
| 24. | Mabscott | 7.8% | 3.1%(+4.79)#24 | 4.1%(+3.71)#2,438 |
| 25. | Charleston | 7.8% | 3.1%(+4.78)#25 | 4.1%(+3.70)#2,450 |
| 26. | Wiley Ford | 7.8% | 3.1%(+4.71)#26 | 4.1%(+3.63)#2,484 |
| 27. | Beech Bottom | 7.7% | 3.1%(+4.64)#27 | 4.1%(+3.56)#2,520 |
| 28. | Belle | 7.6% | 3.1%(+4.56)#28 | 4.1%(+3.48)#2,582 |
| 29. | Richwood | 7.6% | 3.1%(+4.54)#29 | 4.1%(+3.46)#2,592 |
| 30. | Clearview | 7.4% | 3.1%(+4.31)#30 | 4.1%(+3.23)#2,751 |
| 31. | Mannington | 7.3% | 3.1%(+4.23)#31 | 4.1%(+3.15)#2,808 |
| 32. | Montgomery | 6.6% | 3.1%(+3.54)#32 | 4.1%(+2.46)#3,414 |
| 33. | Bethlehem | 6.3% | 3.1%(+3.22)#33 | 4.1%(+2.14)#3,713 |
| 34. | Marmet | 6.2% | 3.1%(+3.20)#34 | 4.1%(+2.11)#3,748 |
| 35. | Brookhaven | 6.2% | 3.1%(+3.19)#35 | 4.1%(+2.11)#3,785 |
| 36. | Charles Town | 6.2% | 3.1%(+3.16)#36 | 4.1%(+2.08)#3,800 |
| 37. | Prosperity | 6.0% | 3.1%(+2.95)#37 | 4.1%(+1.87)#4,027 |
| 38. | Bath Berkeley Springs | 6.0% | 3.1%(+2.91)#38 | 4.1%(+1.83)#4,084 |
| 39. | Alderson | 5.9% | 3.1%(+2.89)#39 | 4.1%(+1.81)#4,107 |
| 40. | Weirton | 5.7% | 3.1%(+2.65)#40 | 4.1%(+1.57)#4,392 |
| 41. | Rowlesburg | 5.7% | 3.1%(+2.61)#41 | 4.1%(+1.53)#4,453 |
| 42. | Windsor Heights | 5.6% | 3.1%(+2.50)#42 | 4.1%(+1.42)#4,608 |
| 43. | Harpers Ferry | 5.6% | 3.1%(+2.50)#43 | 4.1%(+1.42)#4,617 |
| 44. | Point Pleasant | 5.5% | 3.1%(+2.47)#44 | 4.1%(+1.39)#4,664 |
| 45. | Belmont | 5.5% | 3.1%(+2.45)#45 | 4.1%(+1.37)#4,691 |
| 46. | Mallory | 5.4% | 3.1%(+2.30)#46 | 4.1%(+1.22)#4,895 |
| 47. | Shady Spring | 5.2% | 3.1%(+2.19)#47 | 4.1%(+1.11)#5,080 |
| 48. | Hurricane | 5.2% | 3.1%(+2.17)#48 | 4.1%(+1.09)#5,102 |
| 49. | Glasgow | 5.1% | 3.1%(+2.07)#49 | 4.1%(+0.993)#5,238 |
| 50. | Lewisburg | 5.0% | 3.1%(+1.97)#50 | 4.1%(+0.890)#5,414 |
| 51. | Bethany | 5.0% | 3.1%(+1.91)#51 | 4.1%(+0.830)#5,525 |
| 52. | Star City | 4.9% | 3.1%(+1.84)#52 | 4.1%(+0.764)#5,642 |
| 53. | Pleasant Valley | 4.9% | 3.1%(+1.84)#53 | 4.1%(+0.755)#5,663 |
| 54. | Dunbar | 4.8% | 3.1%(+1.78)#54 | 4.1%(+0.696)#5,768 |
| 55. | New Martinsville | 4.8% | 3.1%(+1.70)#55 | 4.1%(+0.620)#5,917 |
| 56. | Kingwood | 4.7% | 3.1%(+1.67)#56 | 4.1%(+0.587)#5,978 |
| 57. | Huntington | 4.7% | 3.1%(+1.65)#57 | 4.1%(+0.569)#6,004 |
| 58. | Parkersburg | 4.7% | 3.1%(+1.64)#58 | 4.1%(+0.560)#6,018 |
| 59. | Teays Valley | 4.5% | 3.1%(+1.43)#59 | 4.1%(+0.353)#6,457 |
| 60. | Morgantown | 4.5% | 3.1%(+1.43)#60 | 4.1%(+0.352)#6,464 |
| 61. | Tornado | 4.3% | 3.1%(+1.29)#61 | 4.1%(+0.213)#6,764 |
| 62. | Benwood | 4.3% | 3.1%(+1.20)#62 | 4.1%(+0.120)#6,982 |
| 63. | Ranson Corporation | 4.1% | 3.1%(+1.08)#63 | 4.1%(-0.001)#7,264 |
| 64. | Shepherdstown | 4.0% | 3.1%(+0.982)#64 | 4.1%(-0.098)#7,493 |
| 65. | Kenova | 4.0% | 3.1%(+0.915)#65 | 4.1%(-0.165)#7,635 |
| 66. | Vienna | 3.9% | 3.1%(+0.803)#66 | 4.1%(-0.277)#7,882 |
| 67. | Winfield | 3.8% | 3.1%(+0.716)#67 | 4.1%(-0.364)#8,098 |
| 68. | Williamstown | 3.7% | 3.1%(+0.692)#68 | 4.1%(-0.388)#8,144 |
| 69. | Stanaford | 3.7% | 3.1%(+0.635)#69 | 4.1%(-0.445)#8,276 |
| 70. | Wheeling | 3.6% | 3.1%(+0.536)#70 | 4.1%(-0.544)#8,495 |
| 71. | Glen Dale | 3.5% | 3.1%(+0.439)#71 | 4.1%(-0.642)#8,752 |
| 72. | Triadelphia | 3.5% | 3.1%(+0.423)#72 | 4.1%(-0.657)#8,786 |
| 73. | Fairmont | 3.5% | 3.1%(+0.418)#73 | 4.1%(-0.662)#8,796 |
| 74. | Cheat Lake | 3.5% | 3.1%(+0.408)#74 | 4.1%(-0.672)#8,827 |
| 75. | Buffalo | 3.4% | 3.1%(+0.364)#75 | 4.1%(-0.716)#8,934 |
| 76. | White Hall | 3.4% | 3.1%(+0.343)#76 | 4.1%(-0.737)#8,980 |
| 77. | Shannondale | 3.4% | 3.1%(+0.335)#77 | 4.1%(-0.745)#9,000 |
| 78. | Hinton | 3.3% | 3.1%(+0.290)#78 | 4.1%(-0.791)#9,123 |
| 79. | Wardensville | 3.3% | 3.1%(+0.278)#79 | 4.1%(-0.802)#9,161 |
| 80. | Addison Webster Springs | 3.3% | 3.1%(+0.242)#80 | 4.1%(-0.838)#9,254 |
| 81. | Sutton | 3.3% | 3.1%(+0.197)#81 | 4.1%(-0.883)#9,360 |
| 82. | Cameron | 3.2% | 3.1%(+0.171)#82 | 4.1%(-0.909)#9,436 |
| 83. | Williamson | 3.2% | 3.1%(+0.137)#83 | 4.1%(-0.944)#9,521 |
| 84. | Nutter Fort | 3.1% | 3.1%(+0.082)#84 | 4.1%(-0.998)#9,638 |
| 85. | Elkins | 3.1% | 3.1%(+0.070)#85 | 4.1%(-1.01)#9,660 |
| 86. | Pea Ridge | 3.1% | 3.1%(+0.057)#86 | 4.1%(-1.02)#9,712 |
| 87. | Inwood | 3.0% | 3.1%(-0.035)#87 | 4.1%(-1.12)#9,946 |
| 88. | Beckley | 3.0% | 3.1%(-0.059)#88 | 4.1%(-1.14)#10,002 |
| 89. | Sissonville | 2.9% | 3.1%(-0.162)#89 | 4.1%(-1.24)#10,286 |
| 90. | Capon Bridge | 2.8% | 3.1%(-0.277)#90 | 4.1%(-1.36)#10,600 |
| 91. | Granville | 2.5% | 3.1%(-0.555)#91 | 4.1%(-1.64)#11,286 |
| 92. | Shinnston | 2.4% | 3.1%(-0.631)#92 | 4.1%(-1.71)#11,486 |
| 93. | Athens | 2.4% | 3.1%(-0.633)#93 | 4.1%(-1.71)#11,494 |
| 94. | Buckhannon | 2.4% | 3.1%(-0.702)#94 | 4.1%(-1.78)#11,674 |
| 95. | South Charleston | 2.3% | 3.1%(-0.803)#95 | 4.1%(-1.88)#11,943 |
| 96. | Chesapeake | 2.1% | 3.1%(-0.916)#96 | 4.1%(-2.00)#12,206 |
| 97. | St Albans | 2.1% | 3.1%(-0.926)#97 | 4.1%(-2.01)#12,225 |
| 98. | Moundsville | 2.1% | 3.1%(-0.946)#98 | 4.1%(-2.03)#12,278 |
| 99. | Bluefield | 2.1% | 3.1%(-0.992)#99 | 4.1%(-2.07)#12,405 |
| 100. | Pinch | 2.0% | 3.1%(-1.01)#100 | 4.1%(-2.09)#12,447 |
Common Questions
What are the Top 10 Cities with the Highest Percentage of Population with a Degree in Communications in West Virginia?
Top 10 Cities with the Highest Percentage of Population with a Degree in Communications in West Virginia are:
#1
100.0%
#2
50.0%
#3
40.9%
#4
35.1%
#5
28.6%
#6
26.5%
#7
14.3%
#8
13.2%
#9
12.5%
#10
12.3%
What city has the Highest Percentage of Population with a Degree in Communications in West Virginia?
Rhodell has the Highest Percentage of Population with a Degree in Communications in West Virginia with 100.0%.
What is the Percentage of Population with a Degree in Communications in the State of West Virginia?
Percentage of Population with a Degree in Communications in West Virginia is 3.1%.
What is the Percentage of Population with a Degree in Communications in the United States?
Percentage of Population with a Degree in Communications in the United States is 4.1%.