Cities with the Highest Percentage of Population with a Degree in Communications in South Carolina
RELATED REPORTS & OPTIONS
Communications
South Carolina
Compare Cities
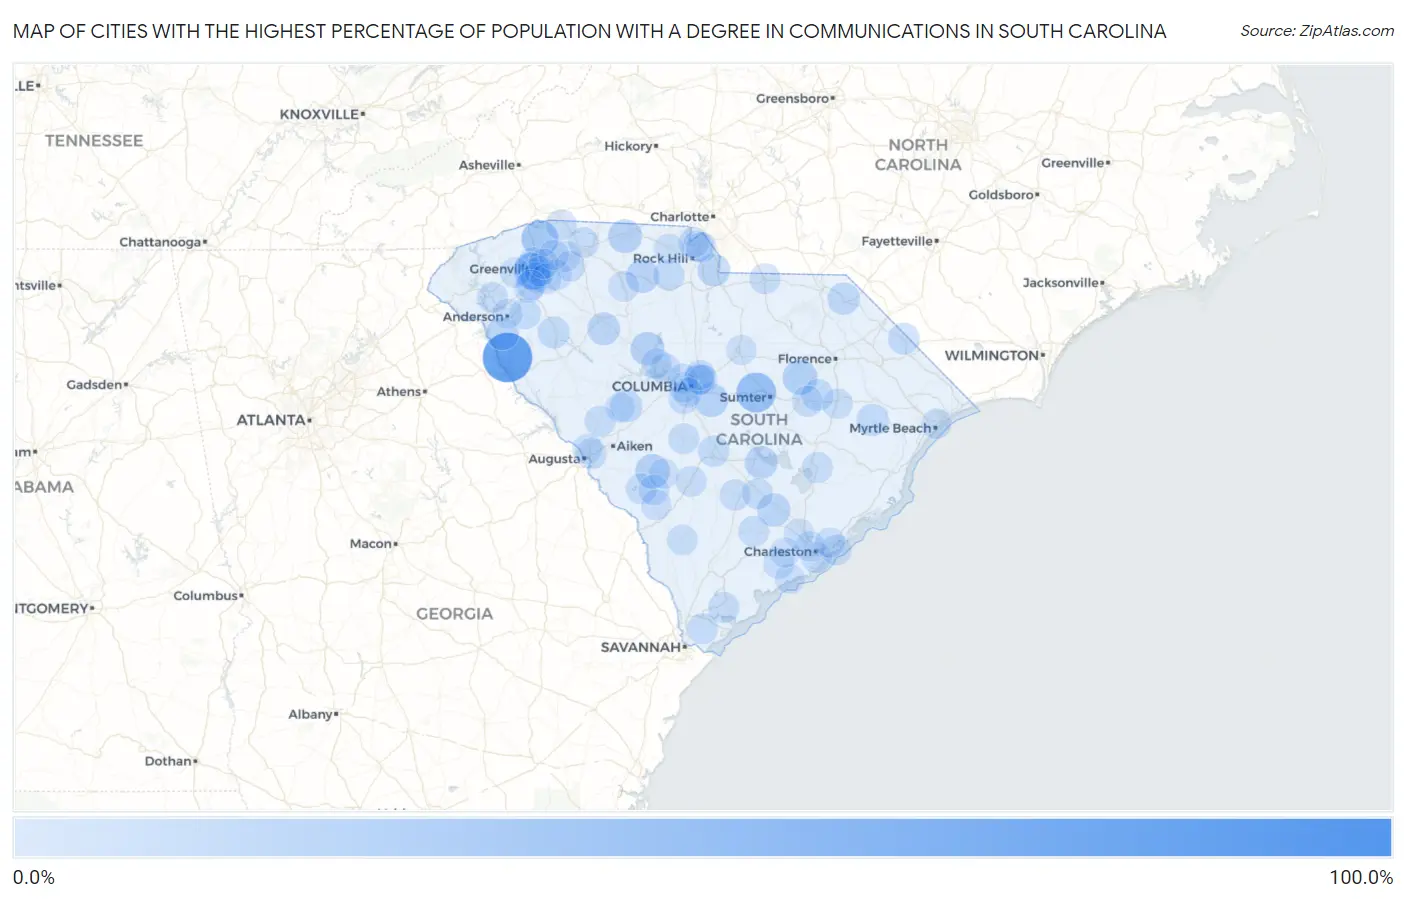
Map of Cities with the Highest Percentage of Population with a Degree in Communications in South Carolina
0.0%
100.0%
Cities with the Highest Percentage of Population with a Degree in Communications in South Carolina
| City | % Graduates | vs State | vs National | |
| 1. | Pauline | 100.0% | 3.3%(+96.7)#1 | 4.1%(+95.9)#7 |
| 2. | Lowndesville | 81.2% | 3.3%(+77.9)#2 | 4.1%(+77.1)#29 |
| 3. | Clemson University | 76.2% | 3.3%(+72.9)#3 | 4.1%(+72.1)#32 |
| 4. | Cherryvale | 41.3% | 3.3%(+38.0)#4 | 4.1%(+37.1)#130 |
| 5. | Dovesville | 30.4% | 3.3%(+27.1)#5 | 4.1%(+26.3)#222 |
| 6. | Tigerville | 30.3% | 3.3%(+27.0)#6 | 4.1%(+26.2)#225 |
| 7. | Judson | 29.4% | 3.3%(+26.1)#7 | 4.1%(+25.3)#236 |
| 8. | Olympia | 27.0% | 3.3%(+23.7)#8 | 4.1%(+22.9)#271 |
| 9. | Lynchburg | 21.4% | 3.3%(+18.1)#9 | 4.1%(+17.3)#396 |
| 10. | Elko | 20.0% | 3.3%(+16.7)#10 | 4.1%(+15.9)#460 |
| 11. | Hopkins | 18.7% | 3.3%(+15.4)#11 | 4.1%(+14.5)#516 |
| 12. | Pomaria | 17.9% | 3.3%(+14.6)#12 | 4.1%(+13.7)#549 |
| 13. | East Gaffney | 17.5% | 3.3%(+14.2)#13 | 4.1%(+13.4)#567 |
| 14. | Lockhart | 15.8% | 3.3%(+12.5)#14 | 4.1%(+11.7)#690 |
| 15. | Ridgeville | 15.7% | 3.3%(+12.4)#15 | 4.1%(+11.5)#700 |
| 16. | Vance | 14.3% | 3.3%(+11.0)#16 | 4.1%(+10.2)#844 |
| 17. | Starr | 13.8% | 3.3%(+10.5)#17 | 4.1%(+9.66)#884 |
| 18. | Joanna | 13.4% | 3.3%(+10.1)#18 | 4.1%(+9.29)#915 |
| 19. | Van Wyck | 12.8% | 3.3%(+9.52)#19 | 4.1%(+8.69)#1,008 |
| 20. | Elliott | 12.4% | 3.3%(+9.11)#20 | 4.1%(+8.28)#1,079 |
| 21. | Bennettsville | 12.1% | 3.3%(+8.79)#21 | 4.1%(+7.96)#1,119 |
| 22. | Monetta | 11.8% | 3.3%(+8.46)#22 | 4.1%(+7.63)#1,190 |
| 23. | Pimlico | 11.1% | 3.3%(+7.81)#23 | 4.1%(+6.98)#1,288 |
| 24. | Ware Shoals | 10.7% | 3.3%(+7.36)#24 | 4.1%(+6.53)#1,415 |
| 25. | Hemingway | 10.5% | 3.3%(+7.22)#25 | 4.1%(+6.39)#1,446 |
| 26. | Olanta | 9.6% | 3.3%(+6.31)#26 | 4.1%(+5.48)#1,706 |
| 27. | Arthurtown | 9.4% | 3.3%(+6.12)#27 | 4.1%(+5.29)#1,773 |
| 28. | Lake View | 9.4% | 3.3%(+6.07)#28 | 4.1%(+5.24)#1,784 |
| 29. | Brookdale | 8.6% | 3.3%(+5.27)#29 | 4.1%(+4.44)#2,084 |
| 30. | Dunean | 8.5% | 3.3%(+5.22)#30 | 4.1%(+4.39)#2,115 |
| 31. | Debordieu Colony | 8.4% | 3.3%(+5.08)#31 | 4.1%(+4.25)#2,179 |
| 32. | Capitol View | 7.9% | 3.3%(+4.58)#32 | 4.1%(+3.75)#2,416 |
| 33. | Belton | 7.9% | 3.3%(+4.56)#33 | 4.1%(+3.73)#2,424 |
| 34. | Lowrys | 7.7% | 3.3%(+4.39)#34 | 4.1%(+3.56)#2,531 |
| 35. | Reevesville | 7.5% | 3.3%(+4.16)#35 | 4.1%(+3.33)#2,672 |
| 36. | Riverview | 7.3% | 3.3%(+4.01)#36 | 4.1%(+3.18)#2,782 |
| 37. | Shell Point | 7.2% | 3.3%(+3.86)#37 | 4.1%(+3.03)#2,895 |
| 38. | Trenton | 7.1% | 3.3%(+3.84)#38 | 4.1%(+3.01)#2,928 |
| 39. | Snelling | 7.1% | 3.3%(+3.84)#39 | 4.1%(+3.01)#2,930 |
| 40. | Turbeville | 7.0% | 3.3%(+3.71)#40 | 4.1%(+2.88)#3,017 |
| 41. | Clearwater | 6.9% | 3.3%(+3.56)#41 | 4.1%(+2.73)#3,148 |
| 42. | Cottageville | 6.9% | 3.3%(+3.56)#42 | 4.1%(+2.73)#3,150 |
| 43. | North | 6.8% | 3.3%(+3.51)#43 | 4.1%(+2.68)#3,187 |
| 44. | Landrum | 6.8% | 3.3%(+3.49)#44 | 4.1%(+2.66)#3,226 |
| 45. | Lake Murray Of Richland | 6.7% | 3.3%(+3.39)#45 | 4.1%(+2.56)#3,312 |
| 46. | St Stephen | 6.7% | 3.3%(+3.36)#46 | 4.1%(+2.53)#3,322 |
| 47. | Bamberg | 6.6% | 3.3%(+3.32)#47 | 4.1%(+2.49)#3,390 |
| 48. | Sans Souci | 6.6% | 3.3%(+3.30)#48 | 4.1%(+2.47)#3,413 |
| 49. | Chapin | 6.6% | 3.3%(+3.27)#49 | 4.1%(+2.44)#3,441 |
| 50. | James Island | 6.4% | 3.3%(+3.13)#50 | 4.1%(+2.30)#3,570 |
| 51. | Arcadia Lakes | 6.4% | 3.3%(+3.07)#51 | 4.1%(+2.24)#3,622 |
| 52. | Bluffton | 6.3% | 3.3%(+2.95)#52 | 4.1%(+2.12)#3,735 |
| 53. | Harleyville | 6.2% | 3.3%(+2.95)#53 | 4.1%(+2.11)#3,754 |
| 54. | Tega Cay | 6.2% | 3.3%(+2.86)#54 | 4.1%(+2.03)#3,844 |
| 55. | Pageland | 6.2% | 3.3%(+2.86)#55 | 4.1%(+2.03)#3,849 |
| 56. | Pendleton | 6.1% | 3.3%(+2.84)#56 | 4.1%(+2.00)#3,875 |
| 57. | Pine Ridge | 6.1% | 3.3%(+2.81)#57 | 4.1%(+1.98)#3,902 |
| 58. | Duncan | 6.1% | 3.3%(+2.76)#58 | 4.1%(+1.93)#3,957 |
| 59. | Isle Of Palms | 6.0% | 3.3%(+2.73)#59 | 4.1%(+1.90)#4,002 |
| 60. | Union | 6.0% | 3.3%(+2.66)#60 | 4.1%(+1.83)#4,083 |
| 61. | Five Forks | 5.9% | 3.3%(+2.62)#61 | 4.1%(+1.79)#4,121 |
| 62. | Meggett | 5.8% | 3.3%(+2.51)#62 | 4.1%(+1.67)#4,272 |
| 63. | Reidville | 5.7% | 3.3%(+2.39)#63 | 4.1%(+1.56)#4,405 |
| 64. | Homewood | 5.6% | 3.3%(+2.35)#64 | 4.1%(+1.51)#4,475 |
| 65. | Hampton | 5.6% | 3.3%(+2.27)#65 | 4.1%(+1.44)#4,575 |
| 66. | Parker | 5.6% | 3.3%(+2.25)#66 | 4.1%(+1.42)#4,625 |
| 67. | Ben Avon | 5.5% | 3.3%(+2.23)#67 | 4.1%(+1.40)#4,648 |
| 68. | Gantt | 5.5% | 3.3%(+2.23)#68 | 4.1%(+1.40)#4,651 |
| 69. | Boiling Springs | 5.4% | 3.3%(+2.13)#69 | 4.1%(+1.30)#4,784 |
| 70. | Kline | 5.3% | 3.3%(+1.96)#70 | 4.1%(+1.13)#5,060 |
| 71. | Mauldin | 5.1% | 3.3%(+1.80)#71 | 4.1%(+0.967)#5,291 |
| 72. | Piedmont | 5.1% | 3.3%(+1.77)#72 | 4.1%(+0.939)#5,340 |
| 73. | Barnwell | 5.0% | 3.3%(+1.70)#73 | 4.1%(+0.865)#5,448 |
| 74. | Forest Acres | 5.0% | 3.3%(+1.69)#74 | 4.1%(+0.858)#5,478 |
| 75. | St Andrews | 4.8% | 3.3%(+1.53)#75 | 4.1%(+0.697)#5,766 |
| 76. | Lake City | 4.7% | 3.3%(+1.38)#76 | 4.1%(+0.548)#6,041 |
| 77. | Greenville | 4.7% | 3.3%(+1.37)#77 | 4.1%(+0.534)#6,074 |
| 78. | Myrtle Beach | 4.6% | 3.3%(+1.33)#78 | 4.1%(+0.503)#6,145 |
| 79. | Charleston | 4.6% | 3.3%(+1.31)#79 | 4.1%(+0.482)#6,186 |
| 80. | Baxter | 4.5% | 3.3%(+1.19)#80 | 4.1%(+0.355)#6,453 |
| 81. | Fort Mill | 4.5% | 3.3%(+1.17)#81 | 4.1%(+0.343)#6,482 |
| 82. | Easley | 4.4% | 3.3%(+1.11)#82 | 4.1%(+0.283)#6,611 |
| 83. | Greer | 4.4% | 3.3%(+1.07)#83 | 4.1%(+0.234)#6,718 |
| 84. | Seabrook Island | 4.4% | 3.3%(+1.06)#84 | 4.1%(+0.230)#6,733 |
| 85. | Blackville | 4.3% | 3.3%(+0.965)#85 | 4.1%(+0.133)#6,954 |
| 86. | Anderson | 4.2% | 3.3%(+0.899)#86 | 4.1%(+0.068)#7,103 |
| 87. | West Columbia | 4.2% | 3.3%(+0.889)#87 | 4.1%(+0.057)#7,123 |
| 88. | Columbia | 4.2% | 3.3%(+0.887)#88 | 4.1%(+0.055)#7,129 |
| 89. | Belvedere | 4.2% | 3.3%(+0.885)#89 | 4.1%(+0.053)#7,131 |
| 90. | Wade Hampton | 4.2% | 3.3%(+0.860)#90 | 4.1%(+0.028)#7,205 |
| 91. | North Charleston | 4.1% | 3.3%(+0.839)#91 | 4.1%(+0.008)#7,249 |
| 92. | Dentsville | 4.1% | 3.3%(+0.769)#92 | 4.1%(-0.062)#7,420 |
| 93. | White Knoll | 4.0% | 3.3%(+0.735)#93 | 4.1%(-0.096)#7,485 |
| 94. | Cayce | 3.9% | 3.3%(+0.642)#94 | 4.1%(-0.189)#7,691 |
| 95. | Mount Pleasant | 3.9% | 3.3%(+0.633)#95 | 4.1%(-0.198)#7,698 |
| 96. | York | 3.9% | 3.3%(+0.561)#96 | 4.1%(-0.271)#7,864 |
| 97. | Ridge Spring | 3.8% | 3.3%(+0.522)#97 | 4.1%(-0.310)#7,979 |
| 98. | Ravenel | 3.7% | 3.3%(+0.428)#98 | 4.1%(-0.404)#8,167 |
| 99. | Golden Grove | 3.7% | 3.3%(+0.361)#99 | 4.1%(-0.471)#8,337 |
| 100. | Camden | 3.6% | 3.3%(+0.345)#100 | 4.1%(-0.487)#8,372 |
Common Questions
What are the Top 10 Cities with the Highest Percentage of Population with a Degree in Communications in South Carolina?
Top 10 Cities with the Highest Percentage of Population with a Degree in Communications in South Carolina are:
#1
81.2%
#2
41.3%
#3
30.3%
#4
29.4%
#5
21.4%
#6
20.0%
#7
18.7%
#8
17.9%
#9
17.5%
#10
15.8%
What city has the Highest Percentage of Population with a Degree in Communications in South Carolina?
Lowndesville has the Highest Percentage of Population with a Degree in Communications in South Carolina with 81.2%.
What is the Percentage of Population with a Degree in Communications in the State of South Carolina?
Percentage of Population with a Degree in Communications in South Carolina is 3.3%.
What is the Percentage of Population with a Degree in Communications in the United States?
Percentage of Population with a Degree in Communications in the United States is 4.1%.