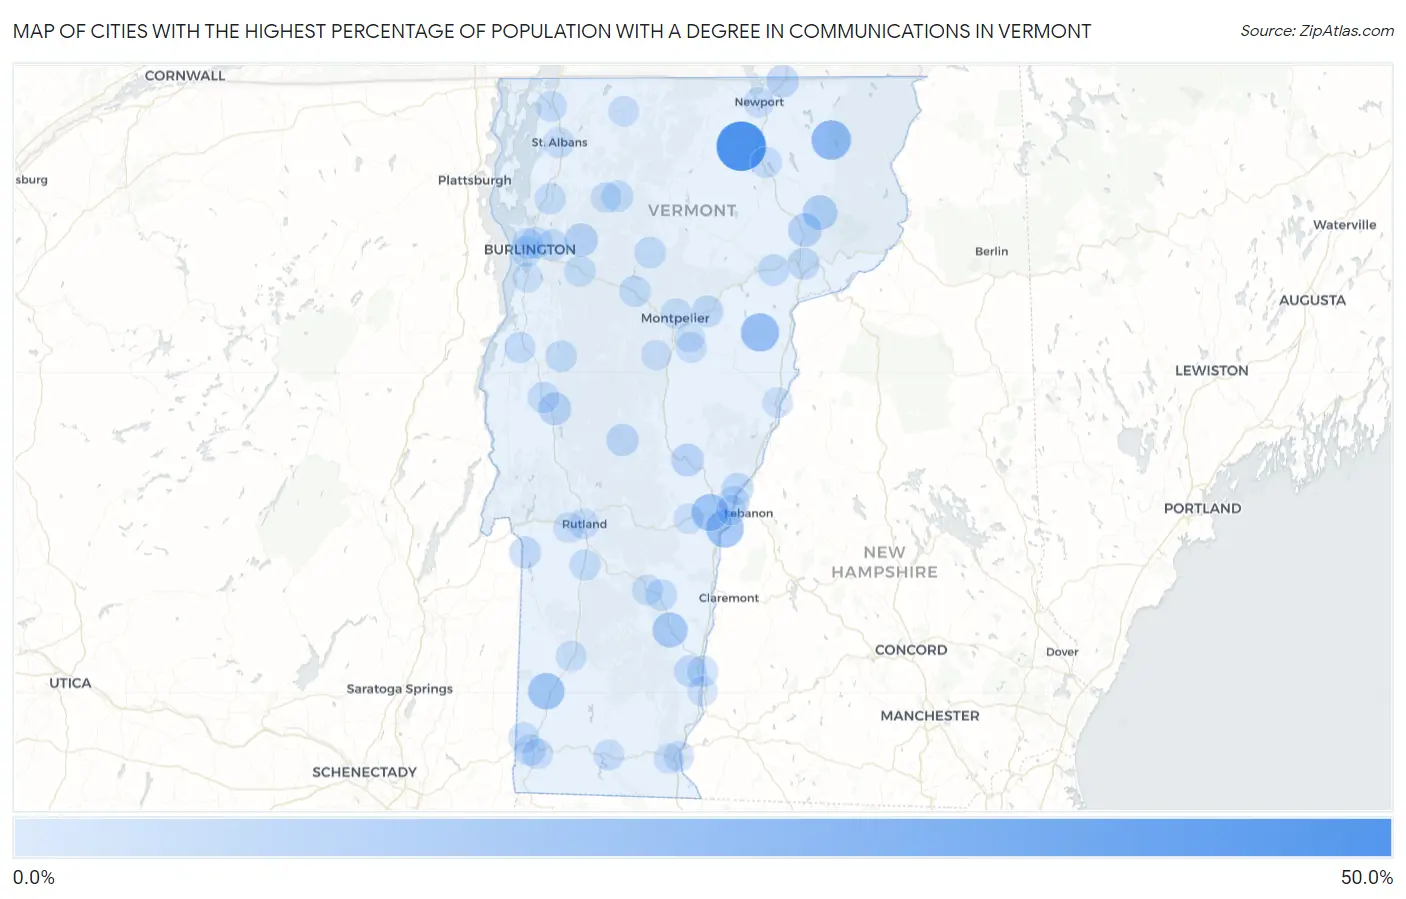
Cities with the Highest Percentage of Population with a Degree in Communications in Vermont
RELATED REPORTS & OPTIONS
Communications
Vermont
Compare Cities
Map of Cities with the Highest Percentage of Population with a Degree in Communications in Vermont
0.0%
50.0%
Cities with the Highest Percentage of Population with a Degree in Communications in Vermont
| City | % Graduates | vs State | vs National | |
| 1. | Irasburg | 50.0% | 2.7%(+47.3)#1 | 4.1%(+45.9)#78 |
| 2. | Island Pond | 23.6% | 2.7%(+20.9)#2 | 4.1%(+19.5)#349 |
| 3. | Groton | 20.0% | 2.7%(+17.3)#3 | 4.1%(+15.9)#453 |
| 4. | North Hartland | 18.9% | 2.7%(+16.2)#4 | 4.1%(+14.7)#507 |
| 5. | Sheffield | 18.5% | 2.7%(+15.8)#5 | 4.1%(+14.4)#523 |
| 6. | Quechee | 17.2% | 2.7%(+14.5)#6 | 4.1%(+13.1)#583 |
| 7. | West Charlotte | 16.7% | 2.7%(+14.0)#7 | 4.1%(+12.5)#617 |
| 8. | East Charlotte | 16.2% | 2.7%(+13.5)#8 | 4.1%(+12.1)#660 |
| 9. | Arlington | 16.0% | 2.7%(+13.3)#9 | 4.1%(+11.8)#674 |
| 10. | Weston | 14.7% | 2.7%(+12.0)#10 | 4.1%(+10.6)#777 |
| 11. | St. George | 13.3% | 2.7%(+10.7)#11 | 4.1%(+9.20)#929 |
| 12. | Harmonyville | 13.2% | 2.7%(+10.6)#12 | 4.1%(+9.10)#958 |
| 13. | Chester | 12.4% | 2.7%(+9.70)#13 | 4.1%(+8.24)#1,083 |
| 14. | East Burke | 11.0% | 2.7%(+8.28)#14 | 4.1%(+6.82)#1,342 |
| 15. | Huntington | 9.9% | 2.7%(+7.23)#15 | 4.1%(+5.77)#1,617 |
| 16. | Lyndonville | 9.0% | 2.7%(+6.33)#16 | 4.1%(+4.87)#1,918 |
| 17. | Bakersfield | 8.7% | 2.7%(+6.07)#17 | 4.1%(+4.61)#2,012 |
| 18. | Jericho | 7.7% | 2.7%(+5.06)#18 | 4.1%(+3.60)#2,496 |
| 19. | New Haven | 7.7% | 2.7%(+5.02)#19 | 4.1%(+3.56)#2,543 |
| 20. | East Middlebury | 7.0% | 2.7%(+4.37)#20 | 4.1%(+2.91)#2,996 |
| 21. | Stamford | 7.0% | 2.7%(+4.32)#21 | 4.1%(+2.86)#3,046 |
| 22. | South Royalton | 6.6% | 2.7%(+3.94)#22 | 4.1%(+2.48)#3,394 |
| 23. | Derby Line | 6.5% | 2.7%(+3.81)#23 | 4.1%(+2.35)#3,519 |
| 24. | Bolton Valley | 6.2% | 2.7%(+3.57)#24 | 4.1%(+2.11)#3,777 |
| 25. | Rochester | 5.2% | 2.7%(+2.54)#25 | 4.1%(+1.08)#5,112 |
| 26. | Norwich | 4.8% | 2.7%(+2.15)#26 | 4.1%(+0.694)#5,776 |
| 27. | Poultney | 4.8% | 2.7%(+2.15)#27 | 4.1%(+0.693)#5,779 |
| 28. | Saxtons River | 4.6% | 2.7%(+1.91)#28 | 4.1%(+0.452)#6,251 |
| 29. | St Johnsbury | 4.6% | 2.7%(+1.90)#29 | 4.1%(+0.443)#6,268 |
| 30. | Plainfield | 4.4% | 2.7%(+1.72)#30 | 4.1%(+0.261)#6,661 |
| 31. | Danville | 4.0% | 2.7%(+1.28)#31 | 4.1%(-0.180)#7,662 |
| 32. | Proctorsville | 3.9% | 2.7%(+1.25)#32 | 4.1%(-0.213)#7,726 |
| 33. | Jeffersonville | 3.9% | 2.7%(+1.21)#33 | 4.1%(-0.252)#7,822 |
| 34. | Winooski | 3.9% | 2.7%(+1.19)#34 | 4.1%(-0.269)#7,861 |
| 35. | Bristol | 3.9% | 2.7%(+1.18)#35 | 4.1%(-0.282)#7,897 |
| 36. | Stowe | 3.7% | 2.7%(+0.980)#36 | 4.1%(-0.479)#8,356 |
| 37. | Essex Junction | 3.6% | 2.7%(+0.963)#37 | 4.1%(-0.496)#8,389 |
| 38. | Waterbury | 3.6% | 2.7%(+0.886)#38 | 4.1%(-0.573)#8,581 |
| 39. | Underhill Flats | 3.5% | 2.7%(+0.813)#39 | 4.1%(-0.647)#8,763 |
| 40. | Lincoln | 3.4% | 2.7%(+0.772)#40 | 4.1%(-0.687)#8,879 |
| 41. | Middlebury | 3.3% | 2.7%(+0.593)#41 | 4.1%(-0.866)#9,318 |
| 42. | Bellows Falls | 3.3% | 2.7%(+0.592)#42 | 4.1%(-0.867)#9,321 |
| 43. | Huntington Center | 3.1% | 2.7%(+0.449)#43 | 4.1%(-1.01)#9,687 |
| 44. | Wilder | 3.0% | 2.7%(+0.292)#44 | 4.1%(-1.17)#10,088 |
| 45. | Old Bennington | 2.9% | 2.7%(+0.237)#45 | 4.1%(-1.22)#10,233 |
| 46. | South Burlington | 2.9% | 2.7%(+0.226)#46 | 4.1%(-1.23)#10,258 |
| 47. | Barton | 2.9% | 2.7%(+0.181)#47 | 4.1%(-1.28)#10,374 |
| 48. | Richmond | 2.7% | 2.7%(+0.064)#48 | 4.1%(-1.40)#10,696 |
| 49. | Burlington | 2.7% | 2.7%(+0.061)#49 | 4.1%(-1.40)#10,705 |
| 50. | Vergennes | 2.7% | 2.7%(+0.023)#50 | 4.1%(-1.44)#10,805 |
| 51. | Milton | 2.6% | 2.7%(-0.068)#51 | 4.1%(-1.53)#11,027 |
| 52. | Wallingford | 2.6% | 2.7%(-0.101)#52 | 4.1%(-1.56)#11,113 |
| 53. | Swanton | 2.5% | 2.7%(-0.133)#53 | 4.1%(-1.59)#11,193 |
| 54. | South Barre | 2.4% | 2.7%(-0.266)#54 | 4.1%(-1.73)#11,528 |
| 55. | Cambridge | 2.4% | 2.7%(-0.295)#55 | 4.1%(-1.75)#11,621 |
| 56. | West Rutland | 2.3% | 2.7%(-0.342)#56 | 4.1%(-1.80)#11,727 |
| 57. | Ludlow | 2.2% | 2.7%(-0.473)#57 | 4.1%(-1.93)#12,054 |
| 58. | Manchester Center | 2.1% | 2.7%(-0.605)#58 | 4.1%(-2.06)#12,384 |
| 59. | St Albans | 2.0% | 2.7%(-0.647)#59 | 4.1%(-2.11)#12,482 |
| 60. | Enosburg Falls | 2.0% | 2.7%(-0.676)#60 | 4.1%(-2.14)#12,543 |
| 61. | Wilmington | 2.0% | 2.7%(-0.676)#61 | 4.1%(-2.14)#12,554 |
| 62. | North Bennington | 2.0% | 2.7%(-0.693)#62 | 4.1%(-2.15)#12,599 |
| 63. | Bennington | 1.9% | 2.7%(-0.821)#63 | 4.1%(-2.28)#12,886 |
| 64. | Montpelier | 1.8% | 2.7%(-0.886)#64 | 4.1%(-2.35)#13,033 |
| 65. | Newport | 1.6% | 2.7%(-1.09)#65 | 4.1%(-2.55)#13,475 |
| 66. | Brattleboro | 1.6% | 2.7%(-1.12)#66 | 4.1%(-2.58)#13,532 |
| 67. | Rutland | 1.5% | 2.7%(-1.16)#67 | 4.1%(-2.62)#13,618 |
| 68. | Bradford | 1.4% | 2.7%(-1.26)#68 | 4.1%(-2.72)#13,802 |
| 69. | Northfield | 1.2% | 2.7%(-1.51)#69 | 4.1%(-2.97)#14,262 |
| 70. | Westminster | 1.1% | 2.7%(-1.56)#70 | 4.1%(-3.02)#14,356 |
| 71. | White River Junction | 1.1% | 2.7%(-1.60)#71 | 4.1%(-3.06)#14,421 |
| 72. | Woodstock | 1.0% | 2.7%(-1.67)#72 | 4.1%(-3.13)#14,543 |
| 73. | Proctor | 0.94% | 2.7%(-1.74)#73 | 4.1%(-3.19)#14,627 |
| 74. | West Brattleboro | 0.47% | 2.7%(-2.20)#74 | 4.1%(-3.66)#15,124 |
| 75. | Shelburne | 0.46% | 2.7%(-2.22)#75 | 4.1%(-3.68)#15,133 |
| 76. | Barre | 0.36% | 2.7%(-2.31)#76 | 4.1%(-3.77)#15,174 |
1
2Common Questions
What are the Top 10 Cities with the Highest Percentage of Population with a Degree in Communications in Vermont?
Top 10 Cities with the Highest Percentage of Population with a Degree in Communications in Vermont are:
#1
50.0%
#2
23.6%
#3
20.0%
#4
18.9%
#5
17.2%
#6
16.0%
#7
12.4%
#8
11.0%
#9
9.0%
#10
7.7%
What city has the Highest Percentage of Population with a Degree in Communications in Vermont?
Irasburg has the Highest Percentage of Population with a Degree in Communications in Vermont with 50.0%.
What is the Percentage of Population with a Degree in Communications in the State of Vermont?
Percentage of Population with a Degree in Communications in Vermont is 2.7%.
What is the Percentage of Population with a Degree in Communications in the United States?
Percentage of Population with a Degree in Communications in the United States is 4.1%.