Cities with the Highest Percentage of Population with a Degree in Communications in Iowa
RELATED REPORTS & OPTIONS
Communications
Iowa
Compare Cities
Map of Cities with the Highest Percentage of Population with a Degree in Communications in Iowa
0.0%
50.0%
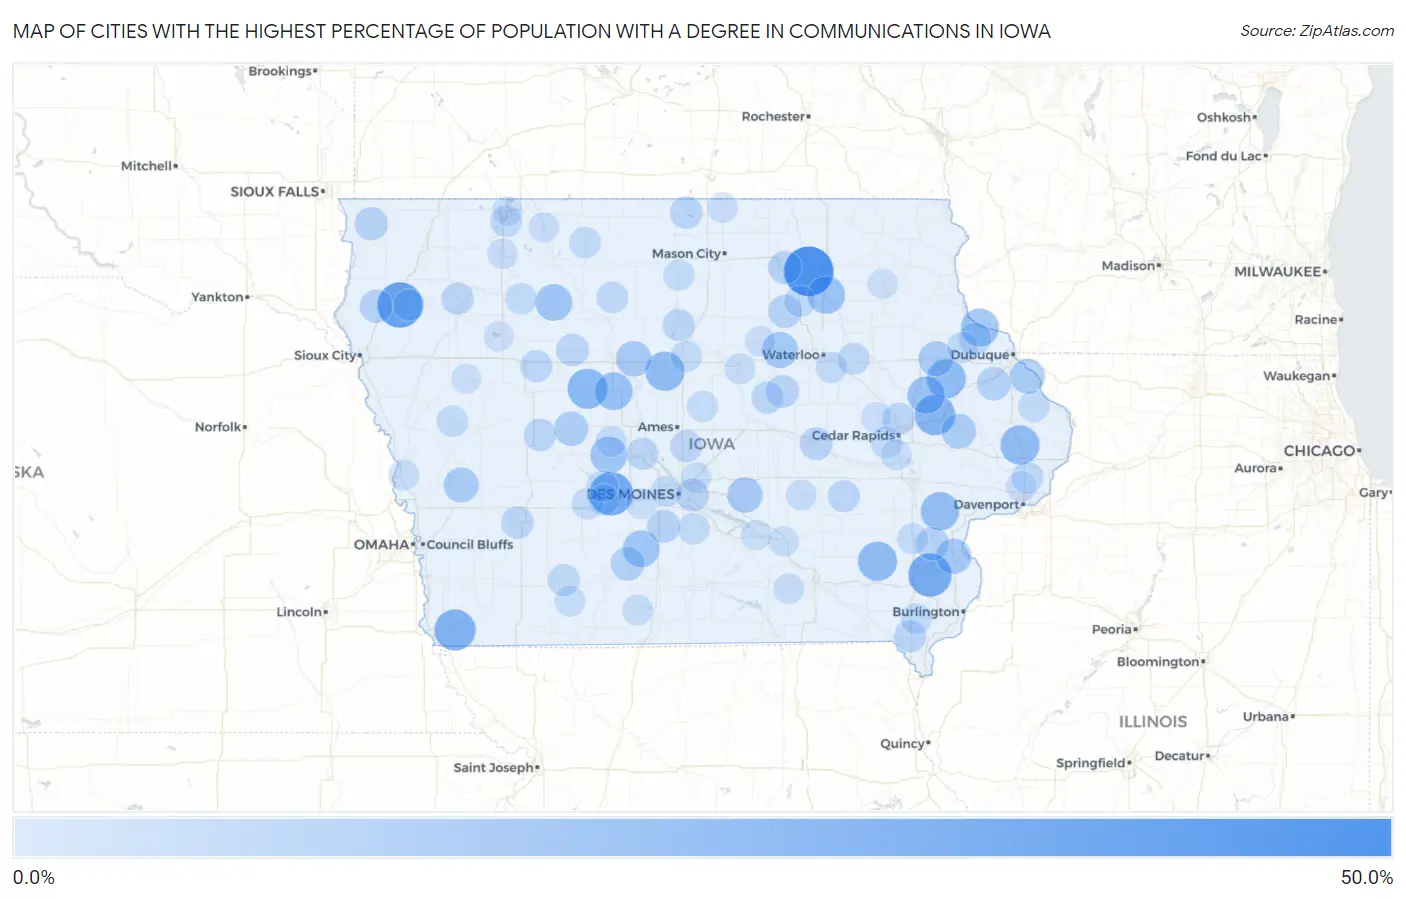
Cities with the Highest Percentage of Population with a Degree in Communications in Iowa
| City | % Graduates | vs State | vs National | |
| 1. | Ionia | 46.2% | 3.9%(+42.3)#1 | 4.1%(+42.0)#103 |
| 2. | Oyens | 37.5% | 3.9%(+33.6)#2 | 4.1%(+33.4)#149 |
| 3. | Redfield | 33.9% | 3.9%(+30.0)#3 | 4.1%(+29.8)#173 |
| 4. | Mount Union | 33.3% | 3.9%(+29.4)#4 | 4.1%(+29.2)#185 |
| 5. | Riverton | 29.2% | 3.9%(+25.3)#5 | 4.1%(+25.0)#240 |
| 6. | Fairport | 29.0% | 3.9%(+25.1)#6 | 4.1%(+24.9)#242 |
| 7. | Stone City | 27.9% | 3.9%(+24.0)#7 | 4.1%(+23.8)#257 |
| 8. | Farnhamville | 26.5% | 3.9%(+22.6)#8 | 4.1%(+22.3)#281 |
| 9. | Hopkinton | 25.0% | 3.9%(+21.1)#9 | 4.1%(+20.9)#305 |
| 10. | Kamrar | 25.0% | 3.9%(+21.1)#10 | 4.1%(+20.9)#317 |
| 11. | Welton | 25.0% | 3.9%(+21.1)#11 | 4.1%(+20.9)#318 |
| 12. | Pleasant Plain | 25.0% | 3.9%(+21.1)#12 | 4.1%(+20.9)#321 |
| 13. | Nichols | 23.3% | 3.9%(+19.4)#13 | 4.1%(+19.2)#356 |
| 14. | Harcourt | 22.2% | 3.9%(+18.3)#14 | 4.1%(+18.1)#376 |
| 15. | North Buena Vista | 22.2% | 3.9%(+18.3)#15 | 4.1%(+18.1)#379 |
| 16. | Frederika | 21.7% | 3.9%(+17.9)#16 | 4.1%(+17.6)#391 |
| 17. | Prairieburg | 21.4% | 3.9%(+17.5)#17 | 4.1%(+17.3)#398 |
| 18. | East Peru | 20.0% | 3.9%(+16.1)#18 | 4.1%(+15.9)#462 |
| 19. | Havelock | 20.0% | 3.9%(+16.1)#19 | 4.1%(+15.9)#463 |
| 20. | Dawson | 20.0% | 3.9%(+16.1)#20 | 4.1%(+15.9)#467 |
| 21. | Stout | 18.4% | 3.9%(+14.5)#21 | 4.1%(+14.3)#526 |
| 22. | Duncombe | 17.6% | 3.9%(+13.8)#22 | 4.1%(+13.5)#558 |
| 23. | Reasnor | 17.4% | 3.9%(+13.5)#23 | 4.1%(+13.3)#572 |
| 24. | Wapello | 17.3% | 3.9%(+13.5)#24 | 4.1%(+13.2)#576 |
| 25. | Portsmouth | 16.7% | 3.9%(+12.8)#25 | 4.1%(+12.5)#623 |
| 26. | Delaware | 16.7% | 3.9%(+12.8)#26 | 4.1%(+12.5)#625 |
| 27. | St Donatus | 16.7% | 3.9%(+12.8)#27 | 4.1%(+12.5)#626 |
| 28. | Olin | 16.0% | 3.9%(+12.1)#28 | 4.1%(+11.9)#672 |
| 29. | Scranton | 15.4% | 3.9%(+11.5)#29 | 4.1%(+11.2)#720 |
| 30. | Lorimor | 14.3% | 3.9%(+10.4)#30 | 4.1%(+10.2)#823 |
| 31. | Bernard | 13.6% | 3.9%(+9.75)#31 | 4.1%(+9.50)#900 |
| 32. | Clarksville | 13.3% | 3.9%(+9.45)#32 | 4.1%(+9.20)#923 |
| 33. | Columbus City | 13.3% | 3.9%(+9.45)#33 | 4.1%(+9.20)#933 |
| 34. | Alvord | 13.3% | 3.9%(+9.45)#34 | 4.1%(+9.20)#935 |
| 35. | Brunsville | 13.3% | 3.9%(+9.45)#35 | 4.1%(+9.20)#938 |
| 36. | Charles City | 13.1% | 3.9%(+9.25)#36 | 4.1%(+9.00)#971 |
| 37. | Martensdale | 13.0% | 3.9%(+9.08)#37 | 4.1%(+8.83)#987 |
| 38. | Chelsea | 12.5% | 3.9%(+8.61)#38 | 4.1%(+8.36)#1,052 |
| 39. | Lincoln | 12.5% | 3.9%(+8.61)#39 | 4.1%(+8.36)#1,067 |
| 40. | Pleasant Hill | 12.4% | 3.9%(+8.49)#40 | 4.1%(+8.24)#1,084 |
| 41. | Lake Mills | 12.0% | 3.9%(+8.15)#41 | 4.1%(+7.91)#1,123 |
| 42. | Manson | 11.9% | 3.9%(+8.06)#42 | 4.1%(+7.81)#1,147 |
| 43. | Holy Cross | 11.9% | 3.9%(+8.02)#43 | 4.1%(+7.77)#1,153 |
| 44. | Willey | 11.8% | 3.9%(+7.88)#44 | 4.1%(+7.63)#1,192 |
| 45. | Atlantic | 11.8% | 3.9%(+7.87)#45 | 4.1%(+7.62)#1,195 |
| 46. | Donnellson | 11.2% | 3.9%(+7.29)#46 | 4.1%(+7.05)#1,283 |
| 47. | Larrabee | 11.1% | 3.9%(+7.22)#47 | 4.1%(+6.98)#1,312 |
| 48. | Beaman | 11.1% | 3.9%(+7.22)#48 | 4.1%(+6.98)#1,315 |
| 49. | Galt | 11.1% | 3.9%(+7.22)#49 | 4.1%(+6.98)#1,321 |
| 50. | Cambridge | 10.9% | 3.9%(+7.04)#50 | 4.1%(+6.79)#1,350 |
| 51. | Lytton | 10.8% | 3.9%(+6.92)#51 | 4.1%(+6.68)#1,380 |
| 52. | Millersburg | 10.8% | 3.9%(+6.92)#52 | 4.1%(+6.68)#1,381 |
| 53. | Robins | 10.8% | 3.9%(+6.92)#53 | 4.1%(+6.67)#1,382 |
| 54. | Woodward | 10.8% | 3.9%(+6.90)#54 | 4.1%(+6.66)#1,384 |
| 55. | Park View | 10.6% | 3.9%(+6.69)#55 | 4.1%(+6.45)#1,429 |
| 56. | Livermore | 10.5% | 3.9%(+6.64)#56 | 4.1%(+6.39)#1,445 |
| 57. | Prescott | 10.5% | 3.9%(+6.64)#57 | 4.1%(+6.39)#1,448 |
| 58. | Jesup | 10.4% | 3.9%(+6.48)#58 | 4.1%(+6.23)#1,485 |
| 59. | Arnolds Park | 10.2% | 3.9%(+6.27)#59 | 4.1%(+6.03)#1,540 |
| 60. | Remsen | 10.0% | 3.9%(+6.11)#60 | 4.1%(+5.86)#1,566 |
| 61. | Charter Oak | 10.0% | 3.9%(+6.11)#61 | 4.1%(+5.86)#1,578 |
| 62. | Menlo | 10.0% | 3.9%(+6.11)#62 | 4.1%(+5.86)#1,580 |
| 63. | Fenton | 10.0% | 3.9%(+6.11)#63 | 4.1%(+5.86)#1,587 |
| 64. | Marathon | 10.0% | 3.9%(+6.11)#64 | 4.1%(+5.86)#1,592 |
| 65. | Linden | 10.0% | 3.9%(+6.11)#65 | 4.1%(+5.86)#1,593 |
| 66. | Springbrook | 10.0% | 3.9%(+6.11)#66 | 4.1%(+5.86)#1,594 |
| 67. | Ackworth | 10.0% | 3.9%(+6.11)#67 | 4.1%(+5.86)#1,597 |
| 68. | Fairfax | 9.9% | 3.9%(+6.03)#68 | 4.1%(+5.78)#1,611 |
| 69. | Plainfield | 9.7% | 3.9%(+5.79)#69 | 4.1%(+5.54)#1,684 |
| 70. | Washburn | 9.5% | 3.9%(+5.64)#70 | 4.1%(+5.39)#1,735 |
| 71. | Williams | 9.5% | 3.9%(+5.64)#71 | 4.1%(+5.39)#1,738 |
| 72. | Mccallsburg | 9.4% | 3.9%(+5.49)#72 | 4.1%(+5.24)#1,786 |
| 73. | Klemme | 9.3% | 3.9%(+5.41)#73 | 4.1%(+5.17)#1,806 |
| 74. | Windsor Heights | 9.2% | 3.9%(+5.28)#74 | 4.1%(+5.03)#1,844 |
| 75. | Rippey | 9.1% | 3.9%(+5.20)#75 | 4.1%(+4.96)#1,889 |
| 76. | St Paul | 9.1% | 3.9%(+5.20)#76 | 4.1%(+4.96)#1,893 |
| 77. | New Vienna | 8.9% | 3.9%(+5.00)#77 | 4.1%(+4.75)#1,955 |
| 78. | Diamondhead Lake | 8.9% | 3.9%(+4.98)#78 | 4.1%(+4.74)#1,965 |
| 79. | Ainsworth | 8.8% | 3.9%(+4.94)#79 | 4.1%(+4.69)#1,982 |
| 80. | Mondamin | 8.7% | 3.9%(+4.81)#80 | 4.1%(+4.56)#2,036 |
| 81. | Blakesburg | 8.7% | 3.9%(+4.81)#81 | 4.1%(+4.56)#2,041 |
| 82. | Swisher | 8.6% | 3.9%(+4.74)#82 | 4.1%(+4.49)#2,067 |
| 83. | Steamboat Rock | 8.6% | 3.9%(+4.68)#83 | 4.1%(+4.44)#2,095 |
| 84. | Lenox | 8.5% | 3.9%(+4.61)#84 | 4.1%(+4.36)#2,124 |
| 85. | Grand River | 8.3% | 3.9%(+4.45)#85 | 4.1%(+4.20)#2,208 |
| 86. | Montezuma | 8.2% | 3.9%(+4.32)#86 | 4.1%(+4.07)#2,265 |
| 87. | Eldridge | 8.1% | 3.9%(+4.24)#87 | 4.1%(+4.00)#2,299 |
| 88. | Van Meter | 8.0% | 3.9%(+4.16)#88 | 4.1%(+3.91)#2,334 |
| 89. | Shellsburg | 7.8% | 3.9%(+3.88)#89 | 4.1%(+3.63)#2,482 |
| 90. | Spencer | 7.7% | 3.9%(+3.85)#90 | 4.1%(+3.61)#2,494 |
| 91. | Beacon | 7.7% | 3.9%(+3.80)#91 | 4.1%(+3.56)#2,526 |
| 92. | Harvey | 7.7% | 3.9%(+3.80)#92 | 4.1%(+3.56)#2,542 |
| 93. | Wallingford | 7.7% | 3.9%(+3.80)#93 | 4.1%(+3.56)#2,544 |
| 94. | Bondurant | 7.7% | 3.9%(+3.78)#94 | 4.1%(+3.53)#2,557 |
| 95. | Aplington | 7.6% | 3.9%(+3.76)#95 | 4.1%(+3.51)#2,571 |
| 96. | Northwood | 7.6% | 3.9%(+3.75)#96 | 4.1%(+3.50)#2,572 |
| 97. | West Union | 7.4% | 3.9%(+3.50)#97 | 4.1%(+3.25)#2,726 |
| 98. | Ida Grove | 7.4% | 3.9%(+3.50)#98 | 4.1%(+3.25)#2,727 |
| 99. | Lakeside | 7.3% | 3.9%(+3.43)#99 | 4.1%(+3.18)#2,787 |
| 100. | Spirit Lake | 7.2% | 3.9%(+3.30)#100 | 4.1%(+3.05)#2,878 |
Common Questions
What are the Top 10 Cities with the Highest Percentage of Population with a Degree in Communications in Iowa?
Top 10 Cities with the Highest Percentage of Population with a Degree in Communications in Iowa are:
#1
46.2%
#2
37.5%
#3
33.9%
#4
33.3%
#5
29.2%
#6
27.9%
#7
26.5%
#8
25.0%
#9
25.0%
#10
25.0%
What city has the Highest Percentage of Population with a Degree in Communications in Iowa?
Ionia has the Highest Percentage of Population with a Degree in Communications in Iowa with 46.2%.
What is the Percentage of Population with a Degree in Communications in the State of Iowa?
Percentage of Population with a Degree in Communications in Iowa is 3.9%.
What is the Percentage of Population with a Degree in Communications in the United States?
Percentage of Population with a Degree in Communications in the United States is 4.1%.