Cities with the Highest Percentage of Population with a Degree in Communications in Oregon
RELATED REPORTS & OPTIONS
Communications
Oregon
Compare Cities
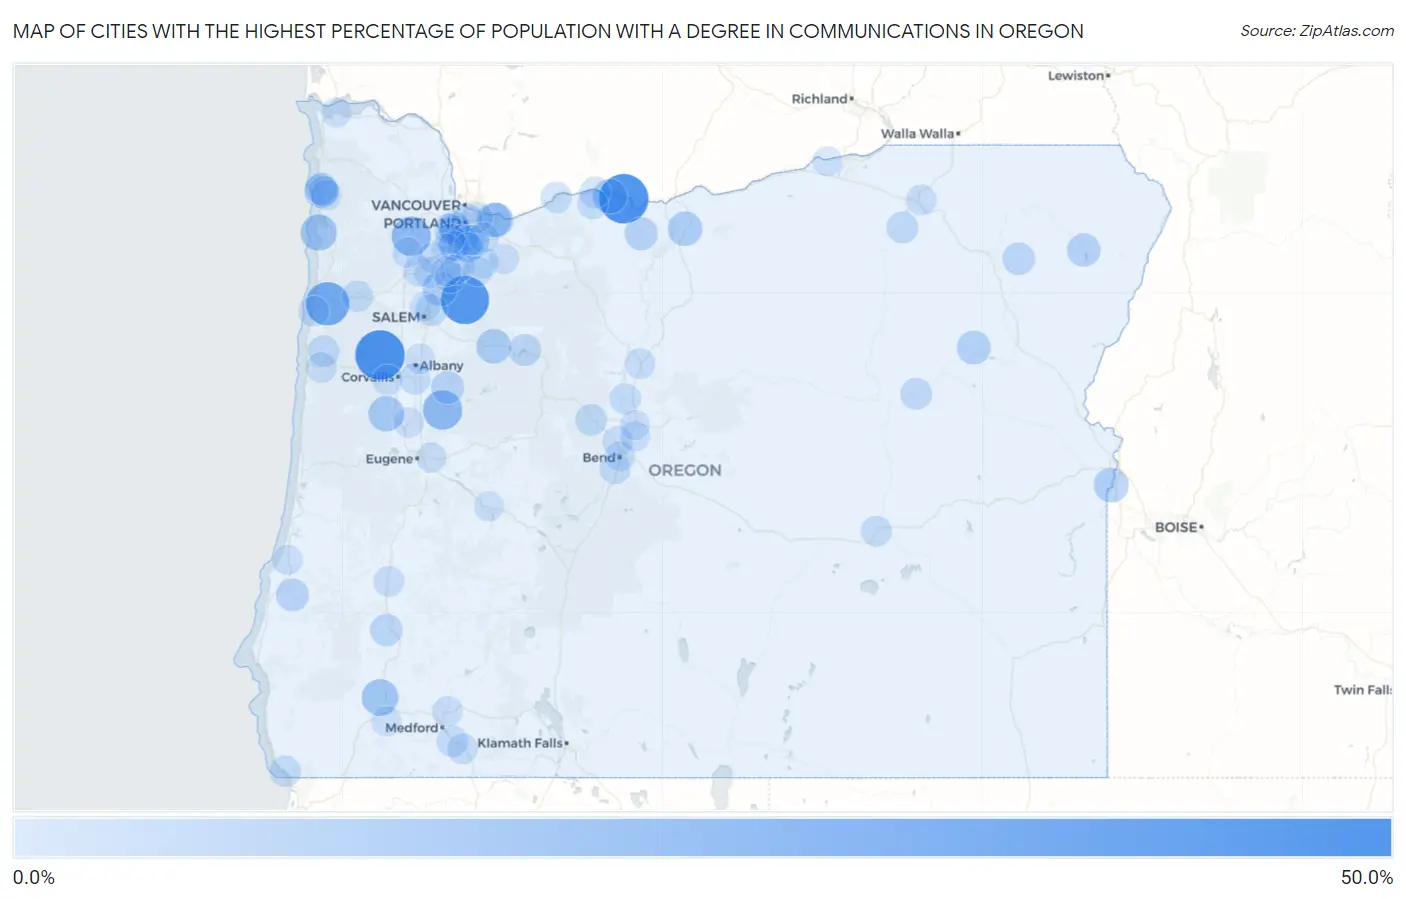
Map of Cities with the Highest Percentage of Population with a Degree in Communications in Oregon
0.0%
50.0%
Cities with the Highest Percentage of Population with a Degree in Communications in Oregon
| City | % Graduates | vs State | vs National | |
| 1. | Kings Valley | 44.1% | 4.3%(+39.8)#1 | 4.1%(+39.9)#114 |
| 2. | Rowena | 43.8% | 4.3%(+39.5)#2 | 4.1%(+39.6)#116 |
| 3. | Scotts Mills | 41.0% | 4.3%(+36.8)#3 | 4.1%(+36.9)#131 |
| 4. | Rose Lodge | 31.3% | 4.3%(+27.1)#4 | 4.1%(+27.2)#209 |
| 5. | Crawfordsville | 22.8% | 4.3%(+18.5)#5 | 4.1%(+18.6)#365 |
| 6. | Gaston | 22.6% | 4.3%(+18.3)#6 | 4.1%(+18.4)#367 |
| 7. | Merlin | 17.1% | 4.3%(+12.8)#7 | 4.1%(+12.9)#593 |
| 8. | Oceanside | 16.5% | 4.3%(+12.3)#8 | 4.1%(+12.4)#633 |
| 9. | Alpine | 14.9% | 4.3%(+10.6)#9 | 4.1%(+10.7)#763 |
| 10. | Saunders Lake | 13.8% | 4.3%(+9.54)#10 | 4.1%(+9.66)#881 |
| 11. | Svensen | 13.8% | 4.3%(+9.51)#11 | 4.1%(+9.63)#885 |
| 12. | Gates | 13.3% | 4.3%(+9.00)#12 | 4.1%(+9.12)#953 |
| 13. | Wood Village | 13.2% | 4.3%(+8.96)#13 | 4.1%(+9.08)#962 |
| 14. | Nyssa | 13.2% | 4.3%(+8.92)#14 | 4.1%(+9.04)#967 |
| 15. | Moro | 13.2% | 4.3%(+8.90)#15 | 4.1%(+9.02)#970 |
| 16. | Mosier | 12.9% | 4.3%(+8.69)#16 | 4.1%(+8.81)#990 |
| 17. | Gervais | 12.9% | 4.3%(+8.68)#17 | 4.1%(+8.80)#992 |
| 18. | Troutdale | 12.2% | 4.3%(+7.97)#18 | 4.1%(+8.09)#1,104 |
| 19. | Sumpter | 11.8% | 4.3%(+7.51)#19 | 4.1%(+7.63)#1,188 |
| 20. | Keno | 11.6% | 4.3%(+7.30)#20 | 4.1%(+7.42)#1,221 |
| 21. | Manzanita | 11.0% | 4.3%(+6.75)#21 | 4.1%(+6.87)#1,333 |
| 22. | Joseph | 10.6% | 4.3%(+6.33)#22 | 4.1%(+6.45)#1,428 |
| 23. | Dufur | 10.4% | 4.3%(+6.12)#23 | 4.1%(+6.24)#1,484 |
| 24. | Waterloo | 10.0% | 4.3%(+5.75)#24 | 4.1%(+5.86)#1,589 |
| 25. | Coquille | 9.8% | 4.3%(+5.54)#25 | 4.1%(+5.66)#1,646 |
| 26. | Stafford | 9.6% | 4.3%(+5.34)#26 | 4.1%(+5.46)#1,715 |
| 27. | Cove | 9.1% | 4.3%(+4.84)#27 | 4.1%(+4.96)#1,869 |
| 28. | Riddle | 8.9% | 4.3%(+4.66)#28 | 4.1%(+4.78)#1,946 |
| 29. | Neahkahnie | 8.7% | 4.3%(+4.44)#29 | 4.1%(+4.56)#2,040 |
| 30. | Durham | 8.5% | 4.3%(+4.23)#30 | 4.1%(+4.35)#2,128 |
| 31. | Detroit | 8.3% | 4.3%(+4.08)#31 | 4.1%(+4.20)#2,212 |
| 32. | Hayesville | 7.9% | 4.3%(+3.61)#32 | 4.1%(+3.73)#2,425 |
| 33. | Garden Home Whitford | 7.6% | 4.3%(+3.35)#33 | 4.1%(+3.47)#2,590 |
| 34. | Pilot Rock | 7.4% | 4.3%(+3.19)#34 | 4.1%(+3.31)#2,679 |
| 35. | Raleigh Hills | 7.4% | 4.3%(+3.17)#35 | 4.1%(+3.29)#2,692 |
| 36. | Sisters | 7.4% | 4.3%(+3.16)#36 | 4.1%(+3.28)#2,695 |
| 37. | Siletz | 7.3% | 4.3%(+3.06)#37 | 4.1%(+3.18)#2,784 |
| 38. | Prairie City | 7.3% | 4.3%(+3.01)#38 | 4.1%(+3.13)#2,827 |
| 39. | Beavercreek | 7.0% | 4.3%(+2.75)#39 | 4.1%(+2.86)#3,035 |
| 40. | Talent | 7.0% | 4.3%(+2.75)#40 | 4.1%(+2.86)#3,038 |
| 41. | Grand Ronde | 6.7% | 4.3%(+2.49)#41 | 4.1%(+2.61)#3,271 |
| 42. | Harbor | 6.7% | 4.3%(+2.48)#42 | 4.1%(+2.60)#3,282 |
| 43. | Cascade Locks | 6.5% | 4.3%(+2.26)#43 | 4.1%(+2.38)#3,489 |
| 44. | St Paul | 6.5% | 4.3%(+2.23)#44 | 4.1%(+2.35)#3,520 |
| 45. | Dayton | 6.3% | 4.3%(+2.06)#45 | 4.1%(+2.18)#3,673 |
| 46. | Burns | 6.3% | 4.3%(+2.03)#46 | 4.1%(+2.15)#3,698 |
| 47. | Hood River | 6.3% | 4.3%(+2.03)#47 | 4.1%(+2.15)#3,700 |
| 48. | Tangent | 6.2% | 4.3%(+1.94)#48 | 4.1%(+2.06)#3,816 |
| 49. | Odell | 6.2% | 4.3%(+1.93)#49 | 4.1%(+2.05)#3,824 |
| 50. | Deschutes River Woods | 6.1% | 4.3%(+1.89)#50 | 4.1%(+2.01)#3,864 |
| 51. | Crooked River Ranch | 6.1% | 4.3%(+1.87)#51 | 4.1%(+1.99)#3,888 |
| 52. | Hubbard | 5.9% | 4.3%(+1.66)#52 | 4.1%(+1.78)#4,129 |
| 53. | Dunthorpe | 5.9% | 4.3%(+1.66)#53 | 4.1%(+1.78)#4,131 |
| 54. | Toledo | 5.9% | 4.3%(+1.64)#54 | 4.1%(+1.76)#4,148 |
| 55. | Gladstone | 5.9% | 4.3%(+1.60)#55 | 4.1%(+1.72)#4,220 |
| 56. | Madras | 5.8% | 4.3%(+1.51)#56 | 4.1%(+1.63)#4,322 |
| 57. | River Road | 5.8% | 4.3%(+1.50)#57 | 4.1%(+1.62)#4,338 |
| 58. | Maywood Park | 5.7% | 4.3%(+1.42)#58 | 4.1%(+1.54)#4,434 |
| 59. | West Slope | 5.7% | 4.3%(+1.41)#59 | 4.1%(+1.53)#4,446 |
| 60. | Ashland | 5.7% | 4.3%(+1.40)#60 | 4.1%(+1.52)#4,461 |
| 61. | Portland | 5.6% | 4.3%(+1.34)#61 | 4.1%(+1.46)#4,560 |
| 62. | Mission | 5.6% | 4.3%(+1.30)#62 | 4.1%(+1.42)#4,599 |
| 63. | Roseburg North | 5.5% | 4.3%(+1.24)#63 | 4.1%(+1.36)#4,706 |
| 64. | Wheeler | 5.4% | 4.3%(+1.13)#64 | 4.1%(+1.25)#4,853 |
| 65. | Lincoln City | 5.3% | 4.3%(+1.09)#65 | 4.1%(+1.21)#4,915 |
| 66. | Oatfield | 5.3% | 4.3%(+1.06)#66 | 4.1%(+1.18)#4,961 |
| 67. | Philomath | 5.3% | 4.3%(+1.02)#67 | 4.1%(+1.14)#5,004 |
| 68. | Boring | 5.3% | 4.3%(+1.01)#68 | 4.1%(+1.13)#5,025 |
| 69. | Yamhill | 5.3% | 4.3%(+1.01)#69 | 4.1%(+1.13)#5,029 |
| 70. | Barlow | 5.3% | 4.3%(+1.01)#70 | 4.1%(+1.13)#5,061 |
| 71. | Tumalo | 5.2% | 4.3%(+0.981)#71 | 4.1%(+1.10)#5,083 |
| 72. | Heceta Beach | 5.2% | 4.3%(+0.967)#72 | 4.1%(+1.09)#5,107 |
| 73. | Bend | 5.2% | 4.3%(+0.937)#73 | 4.1%(+1.06)#5,153 |
| 74. | Harrisburg | 5.2% | 4.3%(+0.918)#74 | 4.1%(+1.04)#5,170 |
| 75. | Beaverton | 5.1% | 4.3%(+0.881)#75 | 4.1%(+1.00)#5,228 |
| 76. | Bayside Gardens | 5.1% | 4.3%(+0.838)#76 | 4.1%(+0.958)#5,308 |
| 77. | Newberg | 5.1% | 4.3%(+0.828)#77 | 4.1%(+0.948)#5,328 |
| 78. | Lake Oswego | 5.1% | 4.3%(+0.810)#78 | 4.1%(+0.930)#5,354 |
| 79. | White City | 5.0% | 4.3%(+0.777)#79 | 4.1%(+0.896)#5,406 |
| 80. | Estacada | 5.0% | 4.3%(+0.765)#80 | 4.1%(+0.884)#5,425 |
| 81. | Tualatin | 5.0% | 4.3%(+0.737)#81 | 4.1%(+0.857)#5,480 |
| 82. | Happy Valley | 4.9% | 4.3%(+0.688)#82 | 4.1%(+0.807)#5,564 |
| 83. | North Bend | 4.8% | 4.3%(+0.541)#83 | 4.1%(+0.661)#5,828 |
| 84. | Pronghorn | 4.8% | 4.3%(+0.536)#84 | 4.1%(+0.655)#5,838 |
| 85. | Millersburg | 4.7% | 4.3%(+0.470)#85 | 4.1%(+0.589)#5,973 |
| 86. | Springfield | 4.7% | 4.3%(+0.406)#86 | 4.1%(+0.525)#6,090 |
| 87. | Oak Grove | 4.6% | 4.3%(+0.308)#87 | 4.1%(+0.428)#6,301 |
| 88. | Sherwood | 4.6% | 4.3%(+0.304)#88 | 4.1%(+0.423)#6,304 |
| 89. | Irrigon | 4.5% | 4.3%(+0.291)#89 | 4.1%(+0.410)#6,328 |
| 90. | Aurora | 4.5% | 4.3%(+0.206)#90 | 4.1%(+0.325)#6,526 |
| 91. | West Linn | 4.5% | 4.3%(+0.204)#91 | 4.1%(+0.323)#6,531 |
| 92. | Mulino | 4.4% | 4.3%(+0.169)#92 | 4.1%(+0.288)#6,605 |
| 93. | Oakridge | 4.4% | 4.3%(+0.157)#93 | 4.1%(+0.277)#6,620 |
| 94. | Santa Clara | 4.4% | 4.3%(+0.126)#94 | 4.1%(+0.246)#6,693 |
| 95. | Astoria | 4.4% | 4.3%(+0.103)#95 | 4.1%(+0.223)#6,742 |
| 96. | New Hope | 4.3% | 4.3%(+0.093)#96 | 4.1%(+0.213)#6,760 |
| 97. | Donald | 4.3% | 4.3%(+0.056)#97 | 4.1%(+0.175)#6,855 |
| 98. | Redmond | 4.3% | 4.3%(+0.039)#98 | 4.1%(+0.158)#6,892 |
| 99. | Tigard | 4.3% | 4.3%(+0.008)#99 | 4.1%(+0.127)#6,964 |
| 100. | Keizer | 4.3% | 4.3%(+0.006)#100 | 4.1%(+0.126)#6,969 |
Common Questions
What are the Top 10 Cities with the Highest Percentage of Population with a Degree in Communications in Oregon?
Top 10 Cities with the Highest Percentage of Population with a Degree in Communications in Oregon are:
#1
44.1%
#2
43.8%
#3
41.0%
#4
31.3%
#5
22.8%
#6
22.6%
#7
17.1%
#8
16.5%
#9
14.9%
#10
13.3%
What city has the Highest Percentage of Population with a Degree in Communications in Oregon?
Kings Valley has the Highest Percentage of Population with a Degree in Communications in Oregon with 44.1%.
What is the Percentage of Population with a Degree in Communications in the State of Oregon?
Percentage of Population with a Degree in Communications in Oregon is 4.3%.
What is the Percentage of Population with a Degree in Communications in the United States?
Percentage of Population with a Degree in Communications in the United States is 4.1%.