Cities with the Highest Percentage of Population with a Degree in Communications in Missouri
RELATED REPORTS & OPTIONS
Communications
Missouri
Compare Cities
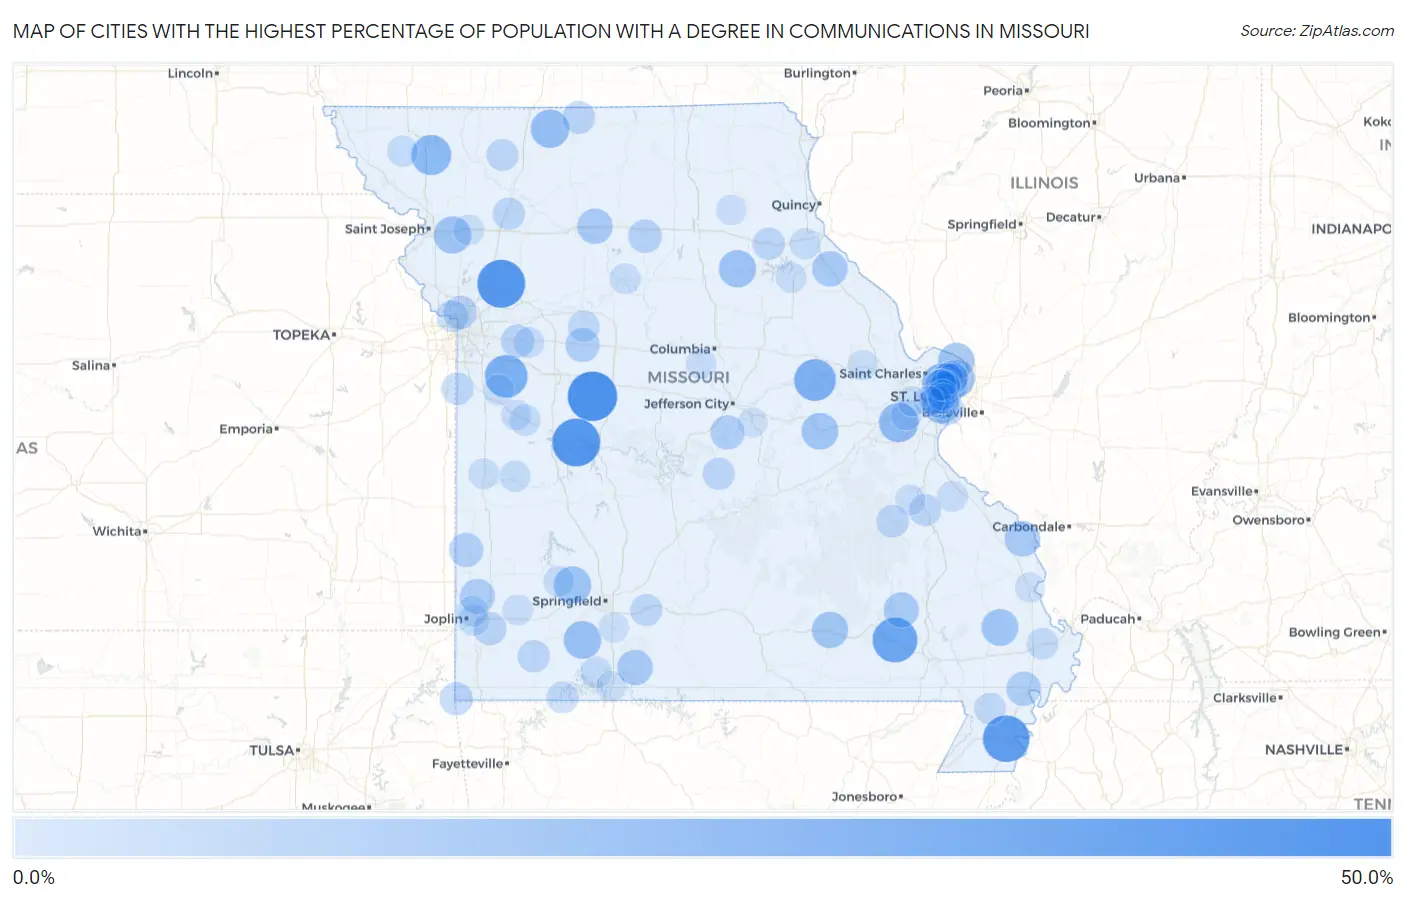
Map of Cities with the Highest Percentage of Population with a Degree in Communications in Missouri
0.0%
50.0%
Cities with the Highest Percentage of Population with a Degree in Communications in Missouri
| City | % Graduates | vs State | vs National | |
| 1. | Green Ridge | 43.0% | 4.4%(+38.6)#1 | 4.1%(+38.9)#120 |
| 2. | Excelsior Estates | 40.0% | 4.4%(+35.6)#2 | 4.1%(+35.9)#136 |
| 3. | Tightwad | 40.0% | 4.4%(+35.6)#3 | 4.1%(+35.9)#140 |
| 4. | Hayti Heights | 37.5% | 4.4%(+33.1)#4 | 4.1%(+33.4)#147 |
| 5. | Ellsinore | 34.1% | 4.4%(+29.8)#5 | 4.1%(+30.0)#169 |
| 6. | Strasburg | 30.0% | 4.4%(+25.6)#6 | 4.1%(+25.9)#232 |
| 7. | Mckittrick | 28.6% | 4.4%(+24.2)#7 | 4.1%(+24.4)#251 |
| 8. | Bel Ridge | 26.4% | 4.4%(+22.0)#8 | 4.1%(+22.3)#283 |
| 9. | Arkoe | 25.0% | 4.4%(+20.6)#9 | 4.1%(+20.9)#322 |
| 10. | Lake Tekakwitha | 24.1% | 4.4%(+19.8)#10 | 4.1%(+20.0)#333 |
| 11. | Norwood Court | 23.2% | 4.4%(+18.9)#11 | 4.1%(+19.1)#359 |
| 12. | Cainsville | 22.2% | 4.4%(+17.8)#12 | 4.1%(+18.1)#375 |
| 13. | Hurley | 20.7% | 4.4%(+16.3)#13 | 4.1%(+16.6)#425 |
| 14. | Ash Grove | 20.3% | 4.4%(+15.9)#14 | 4.1%(+16.2)#440 |
| 15. | Riverview | 20.1% | 4.4%(+15.7)#15 | 4.1%(+16.0)#447 |
| 16. | Easton | 20.0% | 4.4%(+15.6)#16 | 4.1%(+15.9)#458 |
| 17. | Holliday | 20.0% | 4.4%(+15.6)#17 | 4.1%(+15.9)#465 |
| 18. | Marlborough | 19.3% | 4.4%(+14.9)#18 | 4.1%(+15.2)#491 |
| 19. | Bell City | 19.0% | 4.4%(+14.7)#19 | 4.1%(+14.9)#496 |
| 20. | Rosebud | 18.9% | 4.4%(+14.5)#20 | 4.1%(+14.8)#503 |
| 21. | West Alton | 18.9% | 4.4%(+14.5)#21 | 4.1%(+14.8)#505 |
| 22. | Winona | 18.4% | 4.4%(+14.0)#22 | 4.1%(+14.2)#527 |
| 23. | Frankford | 16.7% | 4.4%(+12.3)#23 | 4.1%(+12.5)#605 |
| 24. | Frohna | 16.7% | 4.4%(+12.3)#24 | 4.1%(+12.5)#606 |
| 25. | Wheeling | 16.7% | 4.4%(+12.3)#25 | 4.1%(+12.5)#619 |
| 26. | Taneyville | 16.7% | 4.4%(+12.3)#26 | 4.1%(+12.5)#622 |
| 27. | Piedmont | 16.4% | 4.4%(+12.0)#27 | 4.1%(+12.3)#638 |
| 28. | Alba | 15.8% | 4.4%(+11.4)#28 | 4.1%(+11.7)#686 |
| 29. | Vinita Park | 15.2% | 4.4%(+10.8)#29 | 4.1%(+11.1)#736 |
| 30. | Lilbourn | 15.0% | 4.4%(+10.6)#30 | 4.1%(+10.9)#747 |
| 31. | St Thomas | 14.6% | 4.4%(+10.2)#31 | 4.1%(+10.5)#788 |
| 32. | Liberal | 14.3% | 4.4%(+9.91)#32 | 4.1%(+10.2)#814 |
| 33. | Emma | 14.3% | 4.4%(+9.91)#33 | 4.1%(+10.2)#830 |
| 34. | Lake St. Clair | 14.0% | 4.4%(+9.58)#34 | 4.1%(+9.82)#870 |
| 35. | Marceline | 13.2% | 4.4%(+8.85)#35 | 4.1%(+9.09)#959 |
| 36. | Oaks | 12.9% | 4.4%(+8.53)#36 | 4.1%(+8.77)#1,000 |
| 37. | Castle Point | 12.7% | 4.4%(+8.29)#37 | 4.1%(+8.53)#1,026 |
| 38. | Southwest City | 12.5% | 4.4%(+8.12)#38 | 4.1%(+8.36)#1,047 |
| 39. | Bates City | 12.5% | 4.4%(+8.12)#39 | 4.1%(+8.36)#1,062 |
| 40. | Diamond | 12.2% | 4.4%(+7.84)#40 | 4.1%(+8.08)#1,106 |
| 41. | Bella Villa | 12.0% | 4.4%(+7.66)#41 | 4.1%(+7.90)#1,124 |
| 42. | Mercer | 11.9% | 4.4%(+7.53)#42 | 4.1%(+7.77)#1,152 |
| 43. | Cleveland | 11.2% | 4.4%(+6.81)#43 | 4.1%(+7.05)#1,279 |
| 44. | Purdy | 11.1% | 4.4%(+6.73)#44 | 4.1%(+6.98)#1,290 |
| 45. | Caledonia | 11.1% | 4.4%(+6.73)#45 | 4.1%(+6.98)#1,307 |
| 46. | Winston | 11.1% | 4.4%(+6.73)#46 | 4.1%(+6.98)#1,308 |
| 47. | Hunnewell | 11.1% | 4.4%(+6.73)#47 | 4.1%(+6.98)#1,309 |
| 48. | Shrewsbury | 11.1% | 4.4%(+6.72)#48 | 4.1%(+6.96)#1,324 |
| 49. | Iberia | 10.9% | 4.4%(+6.49)#49 | 4.1%(+6.73)#1,368 |
| 50. | Bel Nor | 10.7% | 4.4%(+6.34)#50 | 4.1%(+6.59)#1,399 |
| 51. | Fordland | 10.7% | 4.4%(+6.34)#51 | 4.1%(+6.58)#1,401 |
| 52. | Leadington | 10.7% | 4.4%(+6.30)#52 | 4.1%(+6.54)#1,411 |
| 53. | New Hampton | 10.5% | 4.4%(+6.15)#53 | 4.1%(+6.39)#1,447 |
| 54. | Pagedale | 10.5% | 4.4%(+6.12)#54 | 4.1%(+6.36)#1,459 |
| 55. | Brentwood | 10.4% | 4.4%(+6.04)#55 | 4.1%(+6.28)#1,476 |
| 56. | Golden | 10.2% | 4.4%(+5.78)#56 | 4.1%(+6.02)#1,543 |
| 57. | Riverside | 10.1% | 4.4%(+5.70)#57 | 4.1%(+5.95)#1,559 |
| 58. | Raintree Plantation | 10.0% | 4.4%(+5.62)#58 | 4.1%(+5.86)#1,567 |
| 59. | Gideon | 10.0% | 4.4%(+5.62)#59 | 4.1%(+5.86)#1,576 |
| 60. | Bellerive Acres | 10.0% | 4.4%(+5.62)#60 | 4.1%(+5.86)#1,579 |
| 61. | Blackburn | 10.0% | 4.4%(+5.62)#61 | 4.1%(+5.86)#1,591 |
| 62. | Bertrand | 9.9% | 4.4%(+5.48)#62 | 4.1%(+5.72)#1,634 |
| 63. | Ferguson | 9.6% | 4.4%(+5.26)#63 | 4.1%(+5.50)#1,698 |
| 64. | Branson West | 9.6% | 4.4%(+5.24)#64 | 4.1%(+5.48)#1,707 |
| 65. | Rock Hill | 9.5% | 4.4%(+5.11)#65 | 4.1%(+5.35)#1,753 |
| 66. | Sycamore Hills | 9.3% | 4.4%(+4.93)#66 | 4.1%(+5.17)#1,808 |
| 67. | Duquesne | 9.2% | 4.4%(+4.87)#67 | 4.1%(+5.11)#1,825 |
| 68. | Webb City | 9.1% | 4.4%(+4.74)#68 | 4.1%(+4.98)#1,854 |
| 69. | Urich | 9.1% | 4.4%(+4.71)#69 | 4.1%(+4.96)#1,877 |
| 70. | Skidmore | 9.1% | 4.4%(+4.71)#70 | 4.1%(+4.96)#1,884 |
| 71. | Rockville | 9.1% | 4.4%(+4.71)#71 | 4.1%(+4.96)#1,888 |
| 72. | Rensselaer | 8.9% | 4.4%(+4.51)#72 | 4.1%(+4.75)#1,957 |
| 73. | Warson Woods | 8.8% | 4.4%(+4.43)#73 | 4.1%(+4.67)#1,991 |
| 74. | Odessa | 8.7% | 4.4%(+4.35)#74 | 4.1%(+4.59)#2,020 |
| 75. | Moline Acres | 8.7% | 4.4%(+4.34)#75 | 4.1%(+4.58)#2,025 |
| 76. | Brunswick | 8.7% | 4.4%(+4.32)#76 | 4.1%(+4.56)#2,031 |
| 77. | Stewartsville | 8.6% | 4.4%(+4.27)#77 | 4.1%(+4.51)#2,064 |
| 78. | Glendale | 8.6% | 4.4%(+4.22)#78 | 4.1%(+4.46)#2,080 |
| 79. | Charlack | 8.6% | 4.4%(+4.19)#79 | 4.1%(+4.44)#2,086 |
| 80. | Grayhawk | 8.4% | 4.4%(+4.06)#80 | 4.1%(+4.30)#2,154 |
| 81. | Perry | 8.4% | 4.4%(+4.03)#81 | 4.1%(+4.28)#2,169 |
| 82. | Everton | 8.3% | 4.4%(+3.96)#82 | 4.1%(+4.20)#2,202 |
| 83. | East Lynne | 8.3% | 4.4%(+3.96)#83 | 4.1%(+4.20)#2,206 |
| 84. | La Russell | 8.3% | 4.4%(+3.96)#84 | 4.1%(+4.20)#2,210 |
| 85. | Rich Hill | 8.2% | 4.4%(+3.87)#85 | 4.1%(+4.11)#2,239 |
| 86. | Maplewood | 8.0% | 4.4%(+3.65)#86 | 4.1%(+3.89)#2,343 |
| 87. | Creighton | 8.0% | 4.4%(+3.62)#87 | 4.1%(+3.86)#2,359 |
| 88. | Eureka | 8.0% | 4.4%(+3.61)#88 | 4.1%(+3.85)#2,368 |
| 89. | Greendale | 7.9% | 4.4%(+3.53)#89 | 4.1%(+3.77)#2,402 |
| 90. | Terre Du Lac | 7.9% | 4.4%(+3.51)#90 | 4.1%(+3.75)#2,412 |
| 91. | Richmond Heights | 7.8% | 4.4%(+3.47)#91 | 4.1%(+3.71)#2,448 |
| 92. | Des Peres | 7.7% | 4.4%(+3.32)#92 | 4.1%(+3.56)#2,506 |
| 93. | Leonard | 7.7% | 4.4%(+3.32)#93 | 4.1%(+3.56)#2,548 |
| 94. | Lupus | 7.7% | 4.4%(+3.32)#94 | 4.1%(+3.56)#2,549 |
| 95. | Wright City | 7.6% | 4.4%(+3.20)#95 | 4.1%(+3.44)#2,603 |
| 96. | Hollister | 7.5% | 4.4%(+3.08)#96 | 4.1%(+3.32)#2,674 |
| 97. | Westphalia | 7.4% | 4.4%(+3.03)#97 | 4.1%(+3.27)#2,706 |
| 98. | Ozark | 7.4% | 4.4%(+3.01)#98 | 4.1%(+3.25)#2,728 |
| 99. | Cape Girardeau | 7.3% | 4.4%(+2.93)#99 | 4.1%(+3.17)#2,801 |
| 100. | Ellisville | 7.2% | 4.4%(+2.83)#100 | 4.1%(+3.07)#2,867 |
Common Questions
What are the Top 10 Cities with the Highest Percentage of Population with a Degree in Communications in Missouri?
Top 10 Cities with the Highest Percentage of Population with a Degree in Communications in Missouri are:
#1
43.0%
#2
40.0%
#3
40.0%
#4
37.5%
#5
34.1%
#6
30.0%
#7
28.6%
#8
26.4%
#9
25.0%
#10
24.1%
What city has the Highest Percentage of Population with a Degree in Communications in Missouri?
Green Ridge has the Highest Percentage of Population with a Degree in Communications in Missouri with 43.0%.
What is the Percentage of Population with a Degree in Communications in the State of Missouri?
Percentage of Population with a Degree in Communications in Missouri is 4.4%.
What is the Percentage of Population with a Degree in Communications in the United States?
Percentage of Population with a Degree in Communications in the United States is 4.1%.