Cities with the Highest Percentage of Population with a Degree in Communications in Massachusetts
RELATED REPORTS & OPTIONS
Communications
Massachusetts
Compare Cities
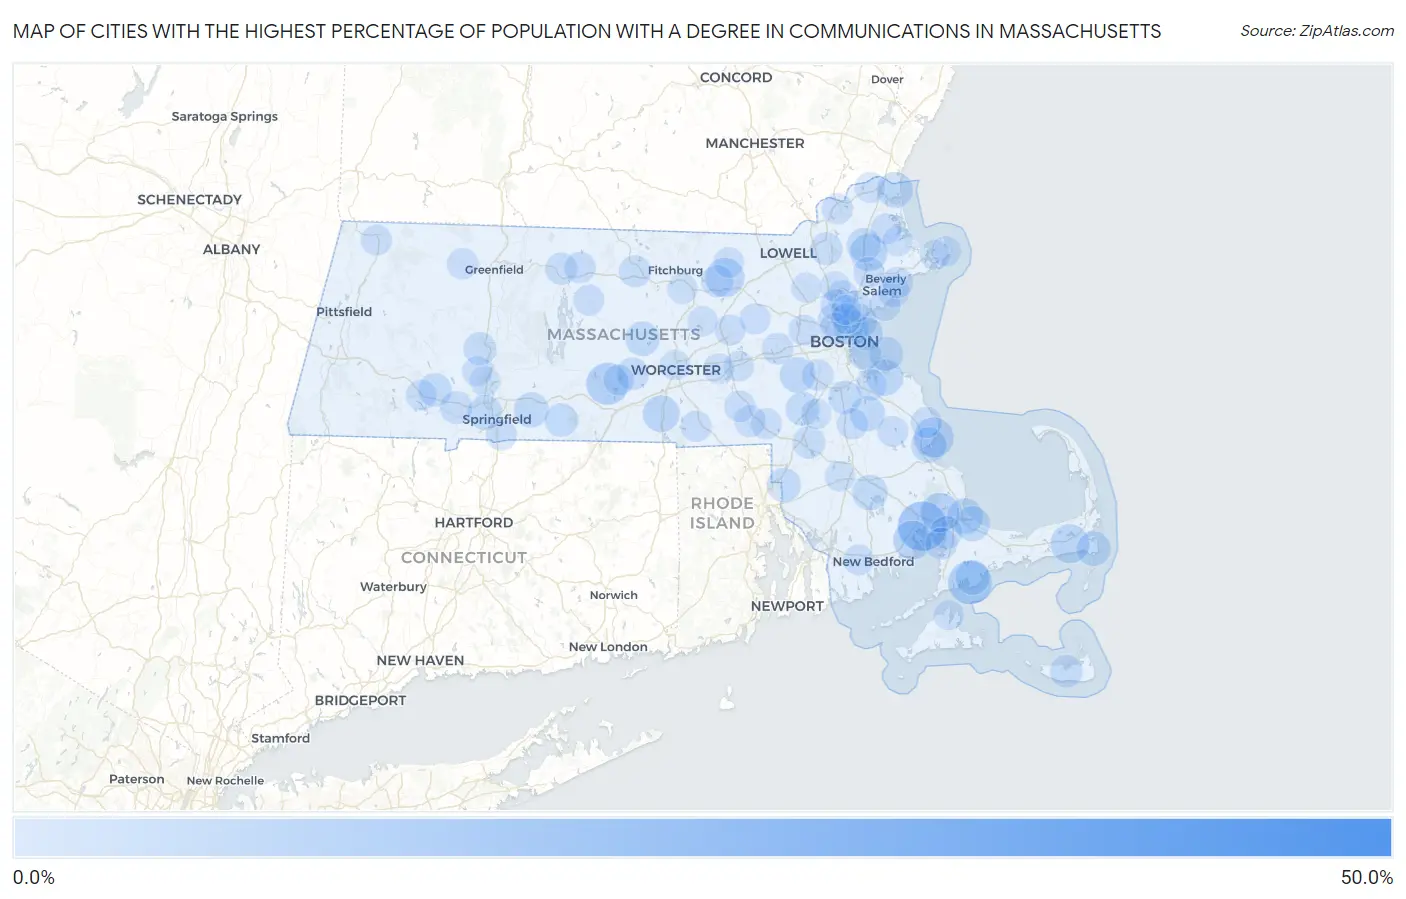
Map of Cities with the Highest Percentage of Population with a Degree in Communications in Massachusetts
0.0%
50.0%
Cities with the Highest Percentage of Population with a Degree in Communications in Massachusetts
| City | % Graduates | vs State | vs National | |
| 1. | Lenox Dale | 46.8% | 3.5%(+43.3)#1 | 4.1%(+42.7)#102 |
| 2. | Green Harbor | 15.6% | 3.5%(+12.1)#2 | 4.1%(+11.5)#702 |
| 3. | Wareham Center | 15.1% | 3.5%(+11.6)#3 | 4.1%(+11.0)#743 |
| 4. | West Warren | 12.0% | 3.5%(+8.49)#4 | 4.1%(+7.86)#1,134 |
| 5. | Seconsett Island | 11.8% | 3.5%(+8.26)#5 | 4.1%(+7.63)#1,191 |
| 6. | Brookfield | 10.7% | 3.5%(+7.21)#6 | 4.1%(+6.58)#1,400 |
| 7. | Duxbury | 9.4% | 3.5%(+5.88)#7 | 4.1%(+5.25)#1,782 |
| 8. | White Island Shores | 9.0% | 3.5%(+5.49)#8 | 4.1%(+4.86)#1,920 |
| 9. | Ayer | 8.9% | 3.5%(+5.39)#9 | 4.1%(+4.76)#1,951 |
| 10. | Harwich Center | 8.8% | 3.5%(+5.30)#10 | 4.1%(+4.67)#1,993 |
| 11. | Marion Center | 8.7% | 3.5%(+5.19)#11 | 4.1%(+4.56)#2,030 |
| 12. | Topsfield | 7.9% | 3.5%(+4.38)#12 | 4.1%(+3.75)#2,418 |
| 13. | Oxford | 7.6% | 3.5%(+4.05)#13 | 4.1%(+3.42)#2,616 |
| 14. | Hingham | 7.3% | 3.5%(+3.79)#14 | 4.1%(+3.16)#2,804 |
| 15. | Sagamore | 7.0% | 3.5%(+3.49)#15 | 4.1%(+2.86)#3,036 |
| 16. | Salisbury | 6.9% | 3.5%(+3.41)#16 | 4.1%(+2.78)#3,102 |
| 17. | Dover | 6.8% | 3.5%(+3.30)#17 | 4.1%(+2.67)#3,210 |
| 18. | South Duxbury | 6.7% | 3.5%(+3.21)#18 | 4.1%(+2.58)#3,295 |
| 19. | North Lakeville | 6.7% | 3.5%(+3.19)#19 | 4.1%(+2.56)#3,306 |
| 20. | Abington | 6.6% | 3.5%(+3.09)#20 | 4.1%(+2.46)#3,416 |
| 21. | Sandwich | 6.6% | 3.5%(+3.08)#21 | 4.1%(+2.45)#3,424 |
| 22. | Chelsea | 6.5% | 3.5%(+3.00)#22 | 4.1%(+2.37)#3,498 |
| 23. | Wilbraham | 6.5% | 3.5%(+2.96)#23 | 4.1%(+2.33)#3,531 |
| 24. | West Springfield Town | 6.3% | 3.5%(+2.82)#24 | 4.1%(+2.19)#3,668 |
| 25. | Seabrook | 6.3% | 3.5%(+2.77)#25 | 4.1%(+2.14)#3,716 |
| 26. | Rutland | 6.1% | 3.5%(+2.63)#26 | 4.1%(+2.00)#3,877 |
| 27. | Chatham | 6.1% | 3.5%(+2.61)#27 | 4.1%(+1.98)#3,906 |
| 28. | Boxford | 6.0% | 3.5%(+2.53)#28 | 4.1%(+1.90)#4,001 |
| 29. | Revere | 6.0% | 3.5%(+2.50)#29 | 4.1%(+1.87)#4,026 |
| 30. | Hull | 6.0% | 3.5%(+2.47)#30 | 4.1%(+1.84)#4,071 |
| 31. | North Seekonk | 5.9% | 3.5%(+2.42)#31 | 4.1%(+1.79)#4,123 |
| 32. | Walpole | 5.8% | 3.5%(+2.26)#32 | 4.1%(+1.63)#4,313 |
| 33. | Russell | 5.7% | 3.5%(+2.19)#33 | 4.1%(+1.56)#4,415 |
| 34. | Randolph Town | 5.5% | 3.5%(+2.03)#34 | 4.1%(+1.40)#4,644 |
| 35. | Monson Center | 5.5% | 3.5%(+1.97)#35 | 4.1%(+1.34)#4,732 |
| 36. | Winthrop Town | 5.4% | 3.5%(+1.93)#36 | 4.1%(+1.30)#4,789 |
| 37. | Northampton | 5.3% | 3.5%(+1.78)#37 | 4.1%(+1.15)#4,990 |
| 38. | Nantucket | 5.1% | 3.5%(+1.61)#38 | 4.1%(+0.979)#5,268 |
| 39. | Westfield | 5.1% | 3.5%(+1.59)#39 | 4.1%(+0.964)#5,296 |
| 40. | Andover | 5.0% | 3.5%(+1.54)#40 | 4.1%(+0.915)#5,381 |
| 41. | Mansfield Center | 5.0% | 3.5%(+1.48)#41 | 4.1%(+0.855)#5,483 |
| 42. | Bourne | 4.9% | 3.5%(+1.42)#42 | 4.1%(+0.788)#5,604 |
| 43. | Boston | 4.9% | 3.5%(+1.39)#43 | 4.1%(+0.763)#5,643 |
| 44. | Spencer | 4.9% | 3.5%(+1.38)#44 | 4.1%(+0.751)#5,671 |
| 45. | Orange | 4.8% | 3.5%(+1.26)#45 | 4.1%(+0.627)#5,878 |
| 46. | Gardner | 4.7% | 3.5%(+1.23)#46 | 4.1%(+0.600)#5,955 |
| 47. | Devens | 4.7% | 3.5%(+1.23)#47 | 4.1%(+0.599)#5,960 |
| 48. | Pocasset | 4.7% | 3.5%(+1.16)#48 | 4.1%(+0.530)#6,084 |
| 49. | Medford | 4.7% | 3.5%(+1.15)#49 | 4.1%(+0.523)#6,095 |
| 50. | Cochituate | 4.6% | 3.5%(+1.08)#50 | 4.1%(+0.449)#6,255 |
| 51. | Somerville | 4.5% | 3.5%(+0.996)#51 | 4.1%(+0.367)#6,425 |
| 52. | Wakefield | 4.5% | 3.5%(+0.979)#52 | 4.1%(+0.350)#6,467 |
| 53. | Bellingham | 4.5% | 3.5%(+0.955)#53 | 4.1%(+0.326)#6,524 |
| 54. | Dedham | 4.4% | 3.5%(+0.900)#54 | 4.1%(+0.270)#6,640 |
| 55. | Stoneham | 4.4% | 3.5%(+0.888)#55 | 4.1%(+0.259)#6,664 |
| 56. | Salem | 4.4% | 3.5%(+0.886)#56 | 4.1%(+0.256)#6,672 |
| 57. | Saugus | 4.4% | 3.5%(+0.850)#57 | 4.1%(+0.221)#6,747 |
| 58. | Athol | 4.4% | 3.5%(+0.849)#58 | 4.1%(+0.219)#6,749 |
| 59. | Milford | 4.3% | 3.5%(+0.840)#59 | 4.1%(+0.210)#6,794 |
| 60. | Swampscott | 4.3% | 3.5%(+0.755)#60 | 4.1%(+0.126)#6,968 |
| 61. | Weymouth Town | 4.2% | 3.5%(+0.733)#61 | 4.1%(+0.103)#7,016 |
| 62. | Shelburne Falls | 4.2% | 3.5%(+0.720)#62 | 4.1%(+0.090)#7,053 |
| 63. | Marshfield | 4.2% | 3.5%(+0.718)#63 | 4.1%(+0.089)#7,060 |
| 64. | Beverly | 4.2% | 3.5%(+0.698)#64 | 4.1%(+0.068)#7,101 |
| 65. | Danvers | 4.2% | 3.5%(+0.693)#65 | 4.1%(+0.064)#7,112 |
| 66. | Franklin Town | 4.2% | 3.5%(+0.648)#66 | 4.1%(+0.018)#7,231 |
| 67. | Brockton | 4.1% | 3.5%(+0.602)#67 | 4.1%(-0.027)#7,322 |
| 68. | East Douglas | 4.1% | 3.5%(+0.587)#68 | 4.1%(-0.042)#7,369 |
| 69. | Haverhill | 4.1% | 3.5%(+0.585)#69 | 4.1%(-0.044)#7,370 |
| 70. | Blandford | 4.1% | 3.5%(+0.576)#70 | 4.1%(-0.053)#7,400 |
| 71. | Hudson | 4.1% | 3.5%(+0.568)#71 | 4.1%(-0.062)#7,417 |
| 72. | East Brookfield | 4.0% | 3.5%(+0.521)#72 | 4.1%(-0.108)#7,509 |
| 73. | Smith Mills | 4.0% | 3.5%(+0.516)#73 | 4.1%(-0.113)#7,516 |
| 74. | Maynard | 4.0% | 3.5%(+0.507)#74 | 4.1%(-0.122)#7,530 |
| 75. | Longmeadow | 4.0% | 3.5%(+0.505)#75 | 4.1%(-0.124)#7,533 |
| 76. | Hanson | 4.0% | 3.5%(+0.481)#76 | 4.1%(-0.149)#7,602 |
| 77. | North Adams | 4.0% | 3.5%(+0.460)#77 | 4.1%(-0.169)#7,644 |
| 78. | Petersham | 4.0% | 3.5%(+0.455)#78 | 4.1%(-0.175)#7,653 |
| 79. | Rowley | 3.9% | 3.5%(+0.443)#79 | 4.1%(-0.186)#7,676 |
| 80. | Waltham | 3.9% | 3.5%(+0.407)#80 | 4.1%(-0.222)#7,742 |
| 81. | Groton | 3.9% | 3.5%(+0.405)#81 | 4.1%(-0.224)#7,745 |
| 82. | Westborough | 3.9% | 3.5%(+0.402)#82 | 4.1%(-0.227)#7,752 |
| 83. | Worcester | 3.9% | 3.5%(+0.358)#83 | 4.1%(-0.272)#7,869 |
| 84. | Malden | 3.8% | 3.5%(+0.290)#84 | 4.1%(-0.339)#8,040 |
| 85. | Greenfield | 3.8% | 3.5%(+0.290)#85 | 4.1%(-0.340)#8,041 |
| 86. | Amesbury Town | 3.8% | 3.5%(+0.286)#86 | 4.1%(-0.344)#8,049 |
| 87. | Taunton | 3.8% | 3.5%(+0.246)#87 | 4.1%(-0.383)#8,129 |
| 88. | Leominster | 3.7% | 3.5%(+0.236)#88 | 4.1%(-0.393)#8,152 |
| 89. | Sharon | 3.7% | 3.5%(+0.232)#89 | 4.1%(-0.397)#8,157 |
| 90. | Reading | 3.7% | 3.5%(+0.213)#90 | 4.1%(-0.416)#8,205 |
| 91. | Clinton | 3.7% | 3.5%(+0.203)#91 | 4.1%(-0.427)#8,222 |
| 92. | Cordaville | 3.7% | 3.5%(+0.196)#92 | 4.1%(-0.434)#8,251 |
| 93. | Holyoke | 3.7% | 3.5%(+0.164)#93 | 4.1%(-0.465)#8,320 |
| 94. | Easthampton Town | 3.7% | 3.5%(+0.160)#94 | 4.1%(-0.469)#8,331 |
| 95. | Ipswich | 3.6% | 3.5%(+0.090)#95 | 4.1%(-0.540)#8,483 |
| 96. | Gloucester | 3.6% | 3.5%(+0.083)#96 | 4.1%(-0.546)#8,504 |
| 97. | Vineyard Haven | 3.6% | 3.5%(+0.070)#97 | 4.1%(-0.559)#8,526 |
| 98. | Pinehurst | 3.6% | 3.5%(+0.060)#98 | 4.1%(-0.569)#8,575 |
| 99. | Rockport | 3.6% | 3.5%(+0.055)#99 | 4.1%(-0.574)#8,584 |
| 100. | Melrose | 3.6% | 3.5%(+0.045)#100 | 4.1%(-0.585)#8,604 |
Common Questions
What are the Top 10 Cities with the Highest Percentage of Population with a Degree in Communications in Massachusetts?
Top 10 Cities with the Highest Percentage of Population with a Degree in Communications in Massachusetts are:
#1
15.1%
#2
11.8%
#3
10.7%
#4
9.4%
#5
9.0%
#6
8.9%
#7
8.8%
#8
8.7%
#9
7.9%
#10
7.6%
What city has the Highest Percentage of Population with a Degree in Communications in Massachusetts?
Wareham Center has the Highest Percentage of Population with a Degree in Communications in Massachusetts with 15.1%.
What is the Percentage of Population with a Degree in Communications in the State of Massachusetts?
Percentage of Population with a Degree in Communications in Massachusetts is 3.5%.
What is the Percentage of Population with a Degree in Communications in the United States?
Percentage of Population with a Degree in Communications in the United States is 4.1%.