Cities with the Highest Percentage of Population with a Degree in Communications in Kansas
RELATED REPORTS & OPTIONS
Communications
Kansas
Compare Cities
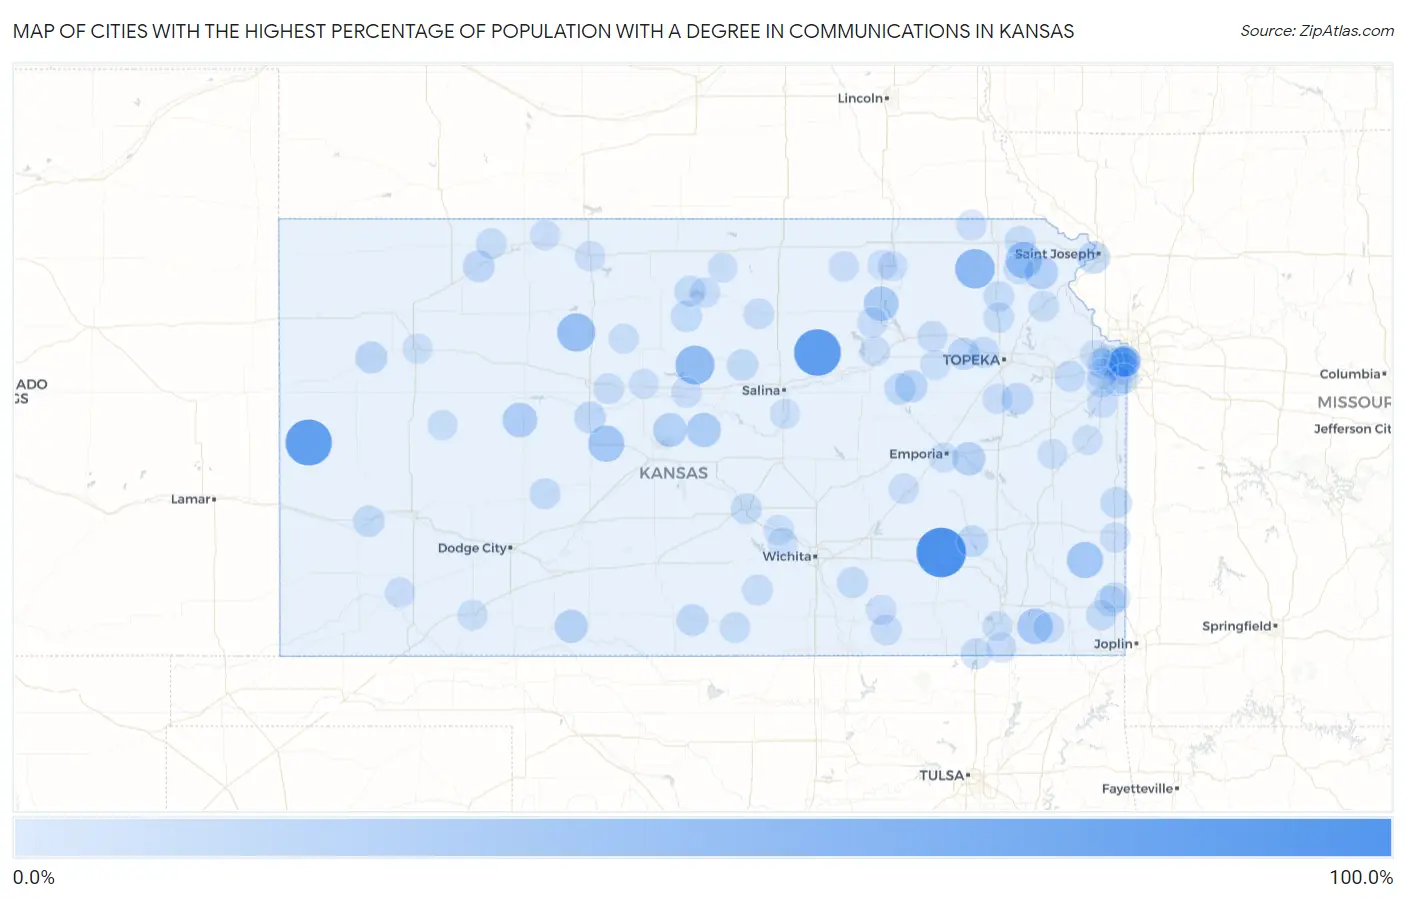
Map of Cities with the Highest Percentage of Population with a Degree in Communications in Kansas
0.0%
100.0%
Cities with the Highest Percentage of Population with a Degree in Communications in Kansas
| City | % Graduates | vs State | vs National | |
| 1. | Climax | 100.0% | 4.1%(+95.9)#1 | 4.1%(+95.9)#20 |
| 2. | Manchester | 85.7% | 4.1%(+81.6)#2 | 4.1%(+81.6)#26 |
| 3. | Horace | 83.3% | 4.1%(+79.2)#3 | 4.1%(+79.2)#28 |
| 4. | Goff | 50.0% | 4.1%(+45.9)#4 | 4.1%(+45.9)#84 |
| 5. | Sylvan Grove | 46.9% | 4.1%(+42.8)#5 | 4.1%(+42.8)#99 |
| 6. | Zurich | 42.9% | 4.1%(+38.7)#6 | 4.1%(+38.7)#122 |
| 7. | Hepler | 33.3% | 4.1%(+29.2)#7 | 4.1%(+29.2)#186 |
| 8. | Timken | 33.3% | 4.1%(+29.2)#8 | 4.1%(+29.2)#194 |
| 9. | Willis | 33.3% | 4.1%(+29.2)#9 | 4.1%(+29.2)#195 |
| 10. | Mound Valley | 30.4% | 4.1%(+26.3)#10 | 4.1%(+26.3)#224 |
| 11. | Randolph | 25.9% | 4.1%(+21.8)#11 | 4.1%(+21.8)#296 |
| 12. | Ransom | 25.6% | 4.1%(+21.4)#12 | 4.1%(+21.4)#299 |
| 13. | Lorraine | 25.0% | 4.1%(+20.9)#13 | 4.1%(+20.9)#316 |
| 14. | Odin | 21.8% | 4.1%(+17.7)#14 | 4.1%(+17.7)#390 |
| 15. | Huron | 20.0% | 4.1%(+15.9)#15 | 4.1%(+15.9)#475 |
| 16. | Neosho Rapids | 19.2% | 4.1%(+15.1)#16 | 4.1%(+15.1)#493 |
| 17. | Protection | 18.9% | 4.1%(+14.7)#17 | 4.1%(+14.7)#506 |
| 18. | Elwood | 16.0% | 4.1%(+11.9)#18 | 4.1%(+11.9)#671 |
| 19. | Alta Vista | 15.0% | 4.1%(+10.9)#19 | 4.1%(+10.9)#748 |
| 20. | Maple Hill | 13.8% | 4.1%(+9.66)#20 | 4.1%(+9.66)#883 |
| 21. | Winona | 13.3% | 4.1%(+9.20)#21 | 4.1%(+9.20)#937 |
| 22. | Sharon | 12.5% | 4.1%(+8.36)#22 | 4.1%(+8.36)#1,068 |
| 23. | Jennings | 12.5% | 4.1%(+8.36)#23 | 4.1%(+8.36)#1,069 |
| 24. | Overbrook | 12.0% | 4.1%(+7.82)#24 | 4.1%(+7.82)#1,145 |
| 25. | Toronto | 11.8% | 4.1%(+7.63)#25 | 4.1%(+7.63)#1,189 |
| 26. | Liebenthal | 11.8% | 4.1%(+7.63)#26 | 4.1%(+7.63)#1,193 |
| 27. | Beverly | 11.1% | 4.1%(+6.97)#27 | 4.1%(+6.98)#1,310 |
| 28. | Westwood | 11.0% | 4.1%(+6.90)#28 | 4.1%(+6.90)#1,327 |
| 29. | Lakin | 11.0% | 4.1%(+6.89)#29 | 4.1%(+6.89)#1,330 |
| 30. | Tipton | 10.3% | 4.1%(+6.21)#30 | 4.1%(+6.21)#1,494 |
| 31. | Mission | 10.3% | 4.1%(+6.21)#31 | 4.1%(+6.21)#1,495 |
| 32. | Merriam | 10.1% | 4.1%(+6.01)#32 | 4.1%(+6.01)#1,548 |
| 33. | Dwight | 10.0% | 4.1%(+5.86)#33 | 4.1%(+5.86)#1,585 |
| 34. | Prescott | 10.0% | 4.1%(+5.86)#34 | 4.1%(+5.86)#1,590 |
| 35. | Mission Woods | 9.9% | 4.1%(+5.77)#35 | 4.1%(+5.77)#1,612 |
| 36. | Douglass | 9.7% | 4.1%(+5.54)#36 | 4.1%(+5.54)#1,680 |
| 37. | Cawker City | 9.4% | 4.1%(+5.30)#37 | 4.1%(+5.30)#1,770 |
| 38. | Silver Lake | 9.2% | 4.1%(+5.11)#38 | 4.1%(+5.11)#1,826 |
| 39. | South Hutchinson | 9.2% | 4.1%(+5.10)#39 | 4.1%(+5.11)#1,829 |
| 40. | Eudora | 8.6% | 4.1%(+4.50)#40 | 4.1%(+4.50)#2,065 |
| 41. | Prairie Village | 8.6% | 4.1%(+4.47)#41 | 4.1%(+4.47)#2,077 |
| 42. | Hanston | 8.6% | 4.1%(+4.43)#42 | 4.1%(+4.44)#2,093 |
| 43. | Caney | 8.6% | 4.1%(+4.42)#43 | 4.1%(+4.42)#2,098 |
| 44. | Westwood Hills | 8.5% | 4.1%(+4.33)#44 | 4.1%(+4.33)#2,138 |
| 45. | Hiawatha | 8.2% | 4.1%(+4.08)#45 | 4.1%(+4.09)#2,254 |
| 46. | Chicopee | 8.0% | 4.1%(+3.88)#46 | 4.1%(+3.88)#2,347 |
| 47. | Norcatur | 8.0% | 4.1%(+3.86)#47 | 4.1%(+3.86)#2,360 |
| 48. | Victoria | 7.9% | 4.1%(+3.78)#48 | 4.1%(+3.79)#2,392 |
| 49. | Holton | 7.8% | 4.1%(+3.63)#49 | 4.1%(+3.63)#2,485 |
| 50. | Lake Quivira | 7.7% | 4.1%(+3.53)#50 | 4.1%(+3.53)#2,558 |
| 51. | Norwich | 7.6% | 4.1%(+3.44)#51 | 4.1%(+3.44)#2,605 |
| 52. | Anthony | 7.4% | 4.1%(+3.30)#52 | 4.1%(+3.30)#2,685 |
| 53. | Horton | 7.4% | 4.1%(+3.30)#53 | 4.1%(+3.30)#2,687 |
| 54. | Dexter | 7.4% | 4.1%(+3.27)#54 | 4.1%(+3.27)#2,705 |
| 55. | Nortonville | 7.4% | 4.1%(+3.23)#55 | 4.1%(+3.23)#2,742 |
| 56. | Wamego | 7.3% | 4.1%(+3.20)#56 | 4.1%(+3.20)#2,767 |
| 57. | Altamont | 7.2% | 4.1%(+3.08)#57 | 4.1%(+3.08)#2,860 |
| 58. | Pittsburg | 7.2% | 4.1%(+3.03)#58 | 4.1%(+3.03)#2,898 |
| 59. | Scammon | 6.9% | 4.1%(+2.76)#59 | 4.1%(+2.76)#3,122 |
| 60. | Mayetta | 6.8% | 4.1%(+2.68)#60 | 4.1%(+2.68)#3,192 |
| 61. | Glasco | 6.8% | 4.1%(+2.68)#61 | 4.1%(+2.68)#3,193 |
| 62. | Spring Hill | 6.6% | 4.1%(+2.49)#62 | 4.1%(+2.49)#3,386 |
| 63. | Overland Park | 6.5% | 4.1%(+2.41)#63 | 4.1%(+2.41)#3,456 |
| 64. | Phillipsburg | 6.5% | 4.1%(+2.40)#64 | 4.1%(+2.40)#3,462 |
| 65. | Roeland Park | 6.4% | 4.1%(+2.21)#65 | 4.1%(+2.22)#3,636 |
| 66. | Riley | 6.3% | 4.1%(+2.17)#66 | 4.1%(+2.18)#3,680 |
| 67. | Fairway | 6.3% | 4.1%(+2.17)#67 | 4.1%(+2.17)#3,683 |
| 68. | Glen Elder | 6.2% | 4.1%(+2.11)#68 | 4.1%(+2.11)#3,759 |
| 69. | Burden | 6.2% | 4.1%(+2.11)#69 | 4.1%(+2.11)#3,760 |
| 70. | Matfield Green | 6.2% | 4.1%(+2.11)#70 | 4.1%(+2.11)#3,783 |
| 71. | Wilson | 6.2% | 4.1%(+2.06)#71 | 4.1%(+2.06)#3,817 |
| 72. | Leawood | 6.1% | 4.1%(+1.98)#72 | 4.1%(+1.98)#3,898 |
| 73. | Bern | 6.1% | 4.1%(+1.92)#73 | 4.1%(+1.93)#3,978 |
| 74. | Shawnee | 6.1% | 4.1%(+1.92)#74 | 4.1%(+1.92)#3,982 |
| 75. | Satanta | 6.0% | 4.1%(+1.90)#75 | 4.1%(+1.90)#4,004 |
| 76. | Linn | 5.9% | 4.1%(+1.75)#76 | 4.1%(+1.75)#4,167 |
| 77. | Lenexa | 5.8% | 4.1%(+1.69)#77 | 4.1%(+1.70)#4,238 |
| 78. | Scranton | 5.8% | 4.1%(+1.66)#78 | 4.1%(+1.66)#4,286 |
| 79. | Meade | 5.7% | 4.1%(+1.52)#79 | 4.1%(+1.52)#4,469 |
| 80. | Healy | 5.6% | 4.1%(+1.42)#80 | 4.1%(+1.42)#4,613 |
| 81. | Fort Scott | 5.5% | 4.1%(+1.38)#81 | 4.1%(+1.38)#4,667 |
| 82. | Dearing | 5.4% | 4.1%(+1.27)#82 | 4.1%(+1.27)#4,830 |
| 83. | Natoma | 5.4% | 4.1%(+1.22)#83 | 4.1%(+1.22)#4,897 |
| 84. | Olathe | 5.3% | 4.1%(+1.15)#84 | 4.1%(+1.16)#4,982 |
| 85. | Almena | 5.3% | 4.1%(+1.13)#85 | 4.1%(+1.13)#5,050 |
| 86. | Alma | 5.2% | 4.1%(+1.05)#86 | 4.1%(+1.05)#5,160 |
| 87. | Mount Hope | 5.2% | 4.1%(+1.04)#87 | 4.1%(+1.04)#5,174 |
| 88. | Oakley | 5.1% | 4.1%(+0.926)#88 | 4.1%(+0.928)#5,359 |
| 89. | Andale | 4.9% | 4.1%(+0.792)#89 | 4.1%(+0.795)#5,591 |
| 90. | Independence | 4.9% | 4.1%(+0.785)#90 | 4.1%(+0.787)#5,605 |
| 91. | Emporia | 4.8% | 4.1%(+0.708)#91 | 4.1%(+0.711)#5,744 |
| 92. | Waterville | 4.8% | 4.1%(+0.682)#92 | 4.1%(+0.684)#5,797 |
| 93. | Richmond | 4.8% | 4.1%(+0.625)#93 | 4.1%(+0.627)#5,896 |
| 94. | Bonner Springs | 4.8% | 4.1%(+0.617)#94 | 4.1%(+0.620)#5,921 |
| 95. | Fort Riley | 4.6% | 4.1%(+0.481)#95 | 4.1%(+0.483)#6,184 |
| 96. | Osawatomie | 4.6% | 4.1%(+0.433)#96 | 4.1%(+0.435)#6,286 |
| 97. | Jewell | 4.5% | 4.1%(+0.408)#97 | 4.1%(+0.410)#6,342 |
| 98. | Blue Rapids | 4.5% | 4.1%(+0.374)#98 | 4.1%(+0.376)#6,410 |
| 99. | Assaria | 4.5% | 4.1%(+0.367)#99 | 4.1%(+0.370)#6,421 |
| 100. | Russell | 4.4% | 4.1%(+0.257)#100 | 4.1%(+0.259)#6,662 |
Common Questions
What are the Top 10 Cities with the Highest Percentage of Population with a Degree in Communications in Kansas?
Top 10 Cities with the Highest Percentage of Population with a Degree in Communications in Kansas are:
#1
100.0%
#2
85.7%
#3
83.3%
#4
50.0%
#5
46.9%
#6
42.9%
#7
33.3%
#8
33.3%
#9
33.3%
#10
30.4%
What city has the Highest Percentage of Population with a Degree in Communications in Kansas?
Climax has the Highest Percentage of Population with a Degree in Communications in Kansas with 100.0%.
What is the Percentage of Population with a Degree in Communications in the State of Kansas?
Percentage of Population with a Degree in Communications in Kansas is 4.1%.
What is the Percentage of Population with a Degree in Communications in the United States?
Percentage of Population with a Degree in Communications in the United States is 4.1%.