Cities with the Highest Percentage of Population with a Degree in Communications in New Mexico
RELATED REPORTS & OPTIONS
Communications
New Mexico
Compare Cities
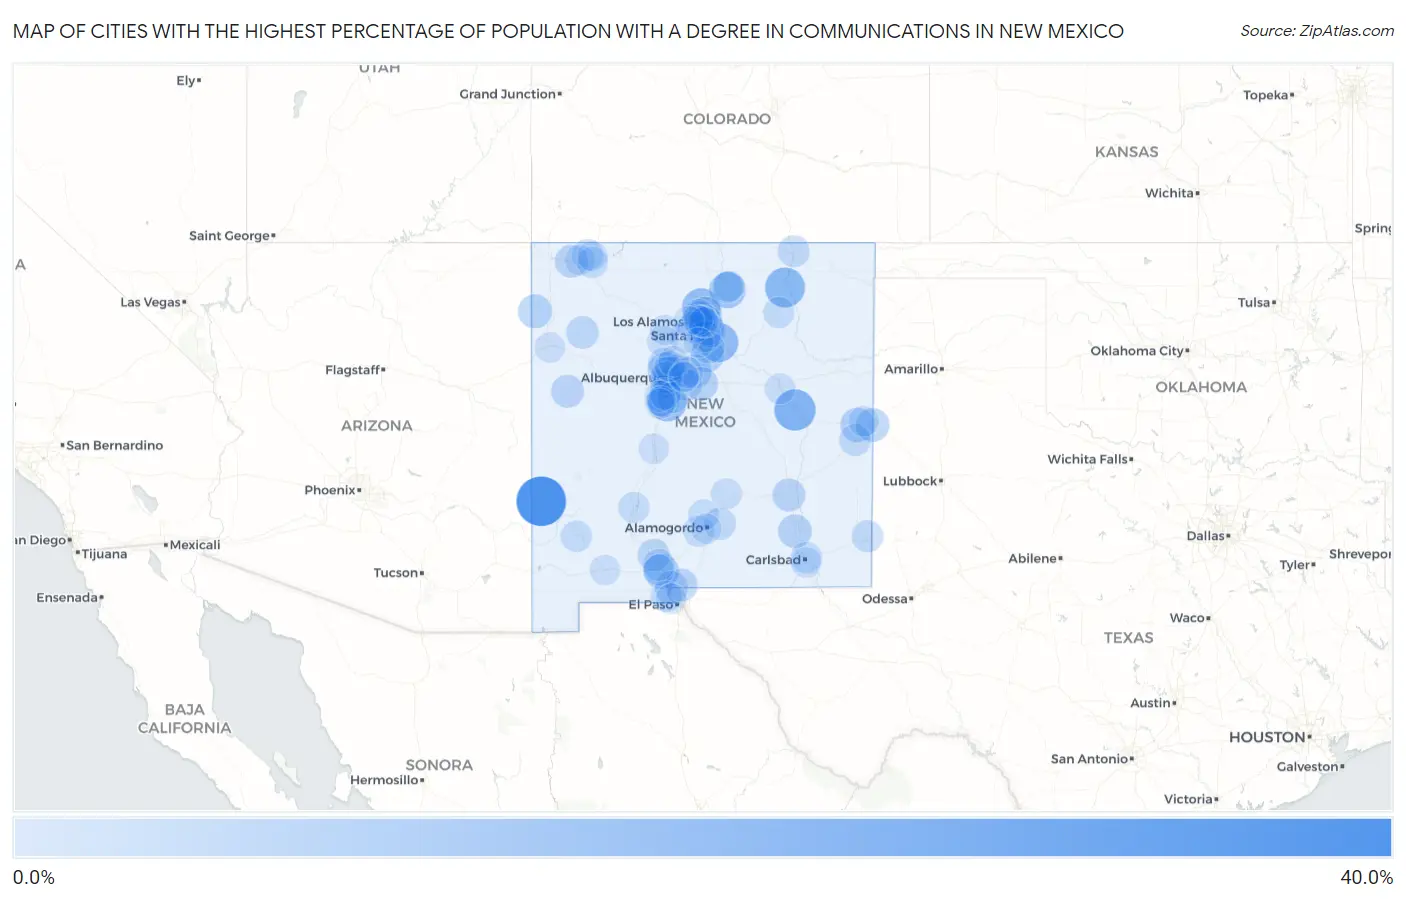
Map of Cities with the Highest Percentage of Population with a Degree in Communications in New Mexico
0.0%
40.0%
Cities with the Highest Percentage of Population with a Degree in Communications in New Mexico
| City | % Graduates | vs State | vs National | |
| 1. | Pleasanton | 37.2% | 3.0%(+34.2)#1 | 4.1%(+33.1)#152 |
| 2. | Lake Sumner | 21.4% | 3.0%(+18.4)#2 | 4.1%(+17.3)#400 |
| 3. | Springer | 18.8% | 3.0%(+15.8)#3 | 4.1%(+14.7)#509 |
| 4. | Glorieta | 17.1% | 3.0%(+14.1)#4 | 4.1%(+13.0)#590 |
| 5. | Alcalde | 15.8% | 3.0%(+12.8)#5 | 4.1%(+11.7)#694 |
| 6. | Las Maravillas | 15.2% | 3.0%(+12.2)#6 | 4.1%(+11.1)#738 |
| 7. | Talpa | 12.2% | 3.0%(+9.19)#7 | 4.1%(+8.06)#1,110 |
| 8. | Cañoncito | 10.9% | 3.0%(+7.84)#8 | 4.1%(+6.72)#1,370 |
| 9. | San Pablo | 9.6% | 3.0%(+6.62)#9 | 4.1%(+5.49)#1,700 |
| 10. | Paradise Hills | 9.5% | 3.0%(+6.49)#10 | 4.1%(+5.37)#1,746 |
| 11. | Cannon Afb | 8.3% | 3.0%(+5.25)#11 | 4.1%(+4.12)#2,236 |
| 12. | La Puebla | 7.8% | 3.0%(+4.78)#12 | 4.1%(+3.66)#2,472 |
| 13. | Crystal | 7.7% | 3.0%(+4.68)#13 | 4.1%(+3.56)#2,534 |
| 14. | Galisteo | 7.7% | 3.0%(+4.68)#14 | 4.1%(+3.56)#2,540 |
| 15. | Texico | 7.4% | 3.0%(+4.40)#15 | 4.1%(+3.27)#2,701 |
| 16. | La Tierra | 7.1% | 3.0%(+4.13)#16 | 4.1%(+3.01)#2,937 |
| 17. | Artesia | 7.1% | 3.0%(+4.10)#17 | 4.1%(+2.98)#2,947 |
| 18. | Sundance | 7.0% | 3.0%(+4.03)#18 | 4.1%(+2.91)#2,995 |
| 19. | Cedar Grove | 7.0% | 3.0%(+3.94)#19 | 4.1%(+2.82)#3,078 |
| 20. | Moriarty | 6.9% | 3.0%(+3.89)#20 | 4.1%(+2.76)#3,115 |
| 21. | Peak Place | 6.2% | 3.0%(+3.24)#21 | 4.1%(+2.11)#3,763 |
| 22. | Roswell | 6.0% | 3.0%(+2.99)#22 | 4.1%(+1.86)#4,043 |
| 23. | Pinehill | 5.9% | 3.0%(+2.87)#23 | 4.1%(+1.75)#4,171 |
| 24. | Anthony | 5.8% | 3.0%(+2.75)#24 | 4.1%(+1.63)#4,320 |
| 25. | Kirtland | 5.8% | 3.0%(+2.74)#25 | 4.1%(+1.62)#4,330 |
| 26. | Angustura | 5.7% | 3.0%(+2.67)#26 | 4.1%(+1.55)#4,425 |
| 27. | Chaparral | 5.6% | 3.0%(+2.57)#27 | 4.1%(+1.44)#4,573 |
| 28. | Tesuque | 5.5% | 3.0%(+2.49)#28 | 4.1%(+1.36)#4,696 |
| 29. | La Mesilla | 5.5% | 3.0%(+2.44)#29 | 4.1%(+1.32)#4,769 |
| 30. | Jaconita | 5.3% | 3.0%(+2.31)#30 | 4.1%(+1.18)#4,950 |
| 31. | Crownpoint | 5.3% | 3.0%(+2.25)#31 | 4.1%(+1.13)#5,024 |
| 32. | Sandia Heights | 5.1% | 3.0%(+2.13)#32 | 4.1%(+1.01)#5,211 |
| 33. | Tome | 5.1% | 3.0%(+2.04)#33 | 4.1%(+0.921)#5,369 |
| 34. | Hyde Park | 5.0% | 3.0%(+1.96)#34 | 4.1%(+0.832)#5,519 |
| 35. | North Valley | 4.8% | 3.0%(+1.74)#35 | 4.1%(+0.617)#5,925 |
| 36. | Radium Springs | 4.6% | 3.0%(+1.62)#36 | 4.1%(+0.501)#6,147 |
| 37. | Kirtland Afb | 4.5% | 3.0%(+1.51)#37 | 4.1%(+0.389)#6,387 |
| 38. | Las Cruces | 4.3% | 3.0%(+1.24)#38 | 4.1%(+0.120)#6,993 |
| 39. | Ponderosa Pine | 4.2% | 3.0%(+1.22)#39 | 4.1%(+0.093)#7,048 |
| 40. | Cloudcroft | 4.2% | 3.0%(+1.16)#40 | 4.1%(+0.032)#7,184 |
| 41. | Nambe | 4.1% | 3.0%(+1.08)#41 | 4.1%(-0.039)#7,357 |
| 42. | Portales | 4.0% | 3.0%(+1.02)#42 | 4.1%(-0.106)#7,505 |
| 43. | South Valley | 4.0% | 3.0%(+0.985)#43 | 4.1%(-0.139)#7,577 |
| 44. | Raton | 4.0% | 3.0%(+0.941)#44 | 4.1%(-0.182)#7,667 |
| 45. | North Hobbs | 3.8% | 3.0%(+0.823)#45 | 4.1%(-0.300)#7,964 |
| 46. | Eldorado At Santa Fe | 3.8% | 3.0%(+0.804)#46 | 4.1%(-0.319)#7,996 |
| 47. | Santa Clara Pueblo | 3.8% | 3.0%(+0.798)#47 | 4.1%(-0.325)#8,003 |
| 48. | Los Ranchos De Albuquerque | 3.8% | 3.0%(+0.788)#48 | 4.1%(-0.335)#8,027 |
| 49. | Peralta | 3.7% | 3.0%(+0.644)#49 | 4.1%(-0.480)#8,358 |
| 50. | Tres Arroyos | 3.6% | 3.0%(+0.623)#50 | 4.1%(-0.500)#8,404 |
| 51. | Santa Fe | 3.6% | 3.0%(+0.610)#51 | 4.1%(-0.513)#8,427 |
| 52. | Albuquerque | 3.6% | 3.0%(+0.547)#52 | 4.1%(-0.576)#8,589 |
| 53. | White Rock | 3.5% | 3.0%(+0.495)#53 | 4.1%(-0.629)#8,725 |
| 54. | Spencerville | 3.5% | 3.0%(+0.461)#54 | 4.1%(-0.663)#8,800 |
| 55. | La Huerta | 3.4% | 3.0%(+0.437)#55 | 4.1%(-0.687)#8,864 |
| 56. | Silver City | 3.3% | 3.0%(+0.245)#56 | 4.1%(-0.879)#9,348 |
| 57. | Rio Rancho | 3.2% | 3.0%(+0.187)#57 | 4.1%(-0.936)#9,507 |
| 58. | Meadow Lake | 3.1% | 3.0%(+0.114)#58 | 4.1%(-1.01)#9,661 |
| 59. | Bosque Farms | 3.0% | 3.0%(-0.033)#59 | 4.1%(-1.16)#10,055 |
| 60. | Holloman Afb | 3.0% | 3.0%(-0.035)#60 | 4.1%(-1.16)#10,064 |
| 61. | Ranchos De Taos | 2.9% | 3.0%(-0.089)#61 | 4.1%(-1.21)#10,209 |
| 62. | Truth Or Consequences | 2.8% | 3.0%(-0.180)#62 | 4.1%(-1.30)#10,454 |
| 63. | Wagon Mound | 2.8% | 3.0%(-0.195)#63 | 4.1%(-1.32)#10,495 |
| 64. | Santa Teresa | 2.7% | 3.0%(-0.293)#64 | 4.1%(-1.42)#10,746 |
| 65. | Mesilla | 2.7% | 3.0%(-0.331)#65 | 4.1%(-1.45)#10,844 |
| 66. | Bloomfield | 2.6% | 3.0%(-0.376)#66 | 4.1%(-1.50)#10,955 |
| 67. | Tularosa | 2.5% | 3.0%(-0.488)#67 | 4.1%(-1.61)#11,233 |
| 68. | Los Lunas | 2.5% | 3.0%(-0.511)#68 | 4.1%(-1.64)#11,279 |
| 69. | Ruidoso | 2.5% | 3.0%(-0.542)#69 | 4.1%(-1.67)#11,360 |
| 70. | Placitas Cdp Sandoval County | 2.4% | 3.0%(-0.626)#70 | 4.1%(-1.75)#11,593 |
| 71. | Taos | 2.4% | 3.0%(-0.626)#71 | 4.1%(-1.75)#11,595 |
| 72. | Jemez Pueblo | 2.2% | 3.0%(-0.838)#72 | 4.1%(-1.96)#12,122 |
| 73. | Santa Rosa | 2.2% | 3.0%(-0.858)#73 | 4.1%(-1.98)#12,166 |
| 74. | Corrales | 2.1% | 3.0%(-0.901)#74 | 4.1%(-2.02)#12,275 |
| 75. | Tano Road | 2.1% | 3.0%(-0.905)#75 | 4.1%(-2.03)#12,282 |
| 76. | El Rancho | 2.1% | 3.0%(-0.909)#76 | 4.1%(-2.03)#12,305 |
| 77. | Sandia Knolls | 2.1% | 3.0%(-0.914)#77 | 4.1%(-2.04)#12,311 |
| 78. | Farmington | 2.1% | 3.0%(-0.950)#78 | 4.1%(-2.07)#12,413 |
| 79. | Cochiti Lake | 1.9% | 3.0%(-1.13)#79 | 4.1%(-2.26)#12,834 |
| 80. | Jacona | 1.9% | 3.0%(-1.14)#80 | 4.1%(-2.27)#12,859 |
| 81. | Socorro | 1.8% | 3.0%(-1.18)#81 | 4.1%(-2.30)#12,935 |
| 82. | Barton | 1.8% | 3.0%(-1.18)#82 | 4.1%(-2.31)#12,946 |
| 83. | San Ildefonso Pueblo | 1.8% | 3.0%(-1.19)#83 | 4.1%(-2.32)#12,972 |
| 84. | Bernalillo | 1.8% | 3.0%(-1.20)#84 | 4.1%(-2.32)#12,987 |
| 85. | Sunland Park | 1.7% | 3.0%(-1.26)#85 | 4.1%(-2.39)#13,123 |
| 86. | Carlsbad | 1.6% | 3.0%(-1.43)#86 | 4.1%(-2.55)#13,473 |
| 87. | Alamogordo | 1.5% | 3.0%(-1.48)#87 | 4.1%(-2.61)#13,595 |
| 88. | Clovis | 1.4% | 3.0%(-1.56)#88 | 4.1%(-2.69)#13,736 |
| 89. | Jemez Springs | 1.4% | 3.0%(-1.59)#89 | 4.1%(-2.72)#13,794 |
| 90. | Cuyamungue | 1.4% | 3.0%(-1.60)#90 | 4.1%(-2.73)#13,812 |
| 91. | Cedar Crest | 1.4% | 3.0%(-1.61)#91 | 4.1%(-2.74)#13,828 |
| 92. | Gallup | 1.4% | 3.0%(-1.62)#92 | 4.1%(-2.74)#13,834 |
| 93. | Deming | 1.3% | 3.0%(-1.67)#93 | 4.1%(-2.79)#13,927 |
| 94. | Los Alamos | 1.2% | 3.0%(-1.77)#94 | 4.1%(-2.90)#14,125 |
| 95. | Picacho Hills | 1.1% | 3.0%(-1.94)#95 | 4.1%(-3.06)#14,423 |
| 96. | Aztec | 1.1% | 3.0%(-1.95)#96 | 4.1%(-3.07)#14,445 |
| 97. | Tijeras | 1.1% | 3.0%(-1.95)#97 | 4.1%(-3.07)#14,449 |
| 98. | Belen | 1.0% | 3.0%(-1.98)#98 | 4.1%(-3.11)#14,506 |
| 99. | Los Chaves | 1.0% | 3.0%(-2.01)#99 | 4.1%(-3.13)#14,545 |
| 100. | La Cienega | 0.99% | 3.0%(-2.02)#100 | 4.1%(-3.14)#14,568 |
Common Questions
What are the Top 10 Cities with the Highest Percentage of Population with a Degree in Communications in New Mexico?
Top 10 Cities with the Highest Percentage of Population with a Degree in Communications in New Mexico are:
#1
37.2%
#2
21.4%
#3
18.8%
#4
17.1%
#5
15.8%
#6
15.2%
#7
12.2%
#8
9.6%
#9
9.5%
#10
8.3%
What city has the Highest Percentage of Population with a Degree in Communications in New Mexico?
Pleasanton has the Highest Percentage of Population with a Degree in Communications in New Mexico with 37.2%.
What is the Percentage of Population with a Degree in Communications in the State of New Mexico?
Percentage of Population with a Degree in Communications in New Mexico is 3.0%.
What is the Percentage of Population with a Degree in Communications in the United States?
Percentage of Population with a Degree in Communications in the United States is 4.1%.