Cities with the Highest Percentage of Population with a Degree in Communications in Virginia
RELATED REPORTS & OPTIONS
Communications
Virginia
Compare Cities
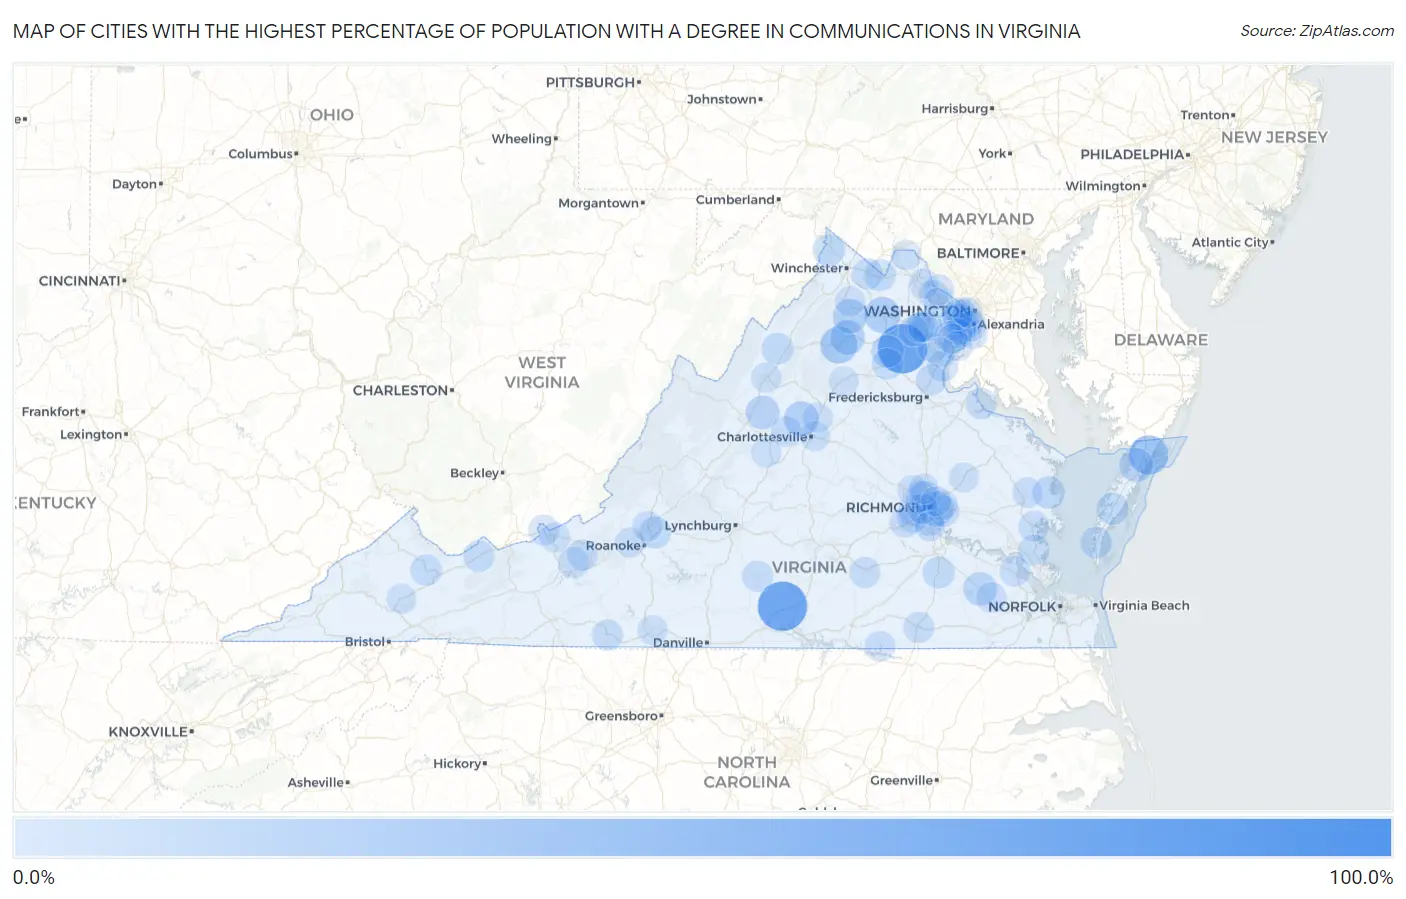
Map of Cities with the Highest Percentage of Population with a Degree in Communications in Virginia
0.0%
100.0%
Cities with the Highest Percentage of Population with a Degree in Communications in Virginia
| City | % Graduates | vs State | vs National | |
| 1. | Rectortown | 100.0% | 3.4%(+96.6)#1 | 4.1%(+95.9)#19 |
| 2. | Calverton | 73.8% | 3.4%(+70.4)#2 | 4.1%(+69.7)#34 |
| 3. | Clover | 73.5% | 3.4%(+70.0)#3 | 4.1%(+69.3)#35 |
| 4. | Paris | 71.0% | 3.4%(+67.5)#4 | 4.1%(+66.8)#38 |
| 5. | Atlantic | 36.7% | 3.4%(+33.2)#5 | 4.1%(+32.5)#157 |
| 6. | Big Stone Gap East | 30.6% | 3.4%(+27.2)#6 | 4.1%(+26.5)#220 |
| 7. | Sperryville | 28.6% | 3.4%(+25.1)#7 | 4.1%(+24.4)#247 |
| 8. | Marshall | 24.1% | 3.4%(+20.6)#8 | 4.1%(+19.9)#334 |
| 9. | Montrose | 20.3% | 3.4%(+16.9)#9 | 4.1%(+16.1)#441 |
| 10. | Free Union | 20.3% | 3.4%(+16.8)#10 | 4.1%(+16.1)#442 |
| 11. | Washington | 20.0% | 3.4%(+16.6)#11 | 4.1%(+15.9)#472 |
| 12. | Chester Gap | 19.7% | 3.4%(+16.3)#12 | 4.1%(+15.6)#481 |
| 13. | Bloxom | 17.6% | 3.4%(+14.2)#13 | 4.1%(+13.5)#556 |
| 14. | New Hope | 17.2% | 3.4%(+13.8)#14 | 4.1%(+13.1)#585 |
| 15. | Wakefield | 16.0% | 3.4%(+12.6)#15 | 4.1%(+11.9)#668 |
| 16. | Opal | 12.8% | 3.4%(+9.38)#16 | 4.1%(+8.67)#1,011 |
| 17. | White Stone | 12.5% | 3.4%(+9.07)#17 | 4.1%(+8.36)#1,053 |
| 18. | Laymantown | 11.4% | 3.4%(+7.96)#18 | 4.1%(+7.25)#1,251 |
| 19. | Lake Holiday | 11.1% | 3.4%(+7.71)#19 | 4.1%(+7.00)#1,285 |
| 20. | Exmore | 11.0% | 3.4%(+7.61)#20 | 4.1%(+6.90)#1,328 |
| 21. | Cheriton | 10.8% | 3.4%(+7.34)#21 | 4.1%(+6.63)#1,389 |
| 22. | Templeton | 10.7% | 3.4%(+7.29)#22 | 4.1%(+6.58)#1,406 |
| 23. | Shenandoah Retreat | 10.3% | 3.4%(+6.92)#23 | 4.1%(+6.21)#1,492 |
| 24. | Ravensworth | 10.2% | 3.4%(+6.78)#24 | 4.1%(+6.07)#1,526 |
| 25. | Timberville | 10.2% | 3.4%(+6.78)#25 | 4.1%(+6.07)#1,528 |
| 26. | Bensley | 9.2% | 3.4%(+5.77)#26 | 4.1%(+5.06)#1,838 |
| 27. | Raven | 9.1% | 3.4%(+5.71)#27 | 4.1%(+5.00)#1,850 |
| 28. | Remington | 8.9% | 3.4%(+5.47)#28 | 4.1%(+4.77)#1,950 |
| 29. | Springville | 8.5% | 3.4%(+5.05)#29 | 4.1%(+4.34)#2,134 |
| 30. | Sandston | 7.8% | 3.4%(+4.40)#30 | 4.1%(+3.69)#2,454 |
| 31. | Brookneal | 7.7% | 3.4%(+4.27)#31 | 4.1%(+3.56)#2,516 |
| 32. | Emporia | 7.7% | 3.4%(+4.23)#32 | 4.1%(+3.52)#2,561 |
| 33. | Fairlawn | 7.7% | 3.4%(+4.23)#33 | 4.1%(+3.52)#2,564 |
| 34. | Colonial Beach | 7.6% | 3.4%(+4.19)#34 | 4.1%(+3.48)#2,584 |
| 35. | Keezletown | 7.6% | 3.4%(+4.18)#35 | 4.1%(+3.47)#2,588 |
| 36. | Dumbarton | 7.6% | 3.4%(+4.15)#36 | 4.1%(+3.44)#2,608 |
| 37. | Stuart | 7.5% | 3.4%(+4.04)#37 | 4.1%(+3.33)#2,669 |
| 38. | Berryville | 7.4% | 3.4%(+3.98)#38 | 4.1%(+3.27)#2,697 |
| 39. | Bon Air | 7.4% | 3.4%(+3.97)#39 | 4.1%(+3.26)#2,719 |
| 40. | Prices Fork | 7.4% | 3.4%(+3.94)#40 | 4.1%(+3.23)#2,747 |
| 41. | Blackstone | 7.1% | 3.4%(+3.70)#41 | 4.1%(+2.99)#2,941 |
| 42. | Yorktown | 7.0% | 3.4%(+3.60)#42 | 4.1%(+2.89)#3,013 |
| 43. | Stafford Courthouse | 7.0% | 3.4%(+3.56)#43 | 4.1%(+2.85)#3,053 |
| 44. | Rich Creek | 6.9% | 3.4%(+3.51)#44 | 4.1%(+2.80)#3,093 |
| 45. | Quantico Base | 6.8% | 3.4%(+3.41)#45 | 4.1%(+2.70)#3,167 |
| 46. | Gloucester Courthouse | 6.6% | 3.4%(+3.21)#46 | 4.1%(+2.50)#3,380 |
| 47. | Lowes Island | 6.6% | 3.4%(+3.19)#47 | 4.1%(+2.48)#3,393 |
| 48. | Seven Corners | 6.6% | 3.4%(+3.14)#48 | 4.1%(+2.43)#3,443 |
| 49. | Rushmere | 6.3% | 3.4%(+2.89)#49 | 4.1%(+2.18)#3,679 |
| 50. | Hayfield | 6.1% | 3.4%(+2.72)#50 | 4.1%(+2.01)#3,871 |
| 51. | Lakeside | 6.1% | 3.4%(+2.71)#51 | 4.1%(+2.00)#3,879 |
| 52. | Gasburg | 6.1% | 3.4%(+2.66)#52 | 4.1%(+1.95)#3,931 |
| 53. | Daleville | 6.0% | 3.4%(+2.58)#53 | 4.1%(+1.87)#4,028 |
| 54. | Sully Square | 5.9% | 3.4%(+2.48)#54 | 4.1%(+1.77)#4,135 |
| 55. | Fort Hunt | 5.9% | 3.4%(+2.46)#55 | 4.1%(+1.75)#4,185 |
| 56. | Yorkshire | 5.8% | 3.4%(+2.37)#56 | 4.1%(+1.66)#4,296 |
| 57. | Ivor | 5.7% | 3.4%(+2.29)#57 | 4.1%(+1.58)#4,389 |
| 58. | Alexandria | 5.7% | 3.4%(+2.24)#58 | 4.1%(+1.53)#4,444 |
| 59. | Franconia | 5.6% | 3.4%(+2.21)#59 | 4.1%(+1.50)#4,489 |
| 60. | Rockwood | 5.6% | 3.4%(+2.21)#60 | 4.1%(+1.50)#4,492 |
| 61. | Midlothian | 5.5% | 3.4%(+2.11)#61 | 4.1%(+1.40)#4,643 |
| 62. | Brandermill | 5.5% | 3.4%(+2.08)#62 | 4.1%(+1.37)#4,682 |
| 63. | Urbanna | 5.5% | 3.4%(+2.03)#63 | 4.1%(+1.32)#4,763 |
| 64. | Richmond | 5.3% | 3.4%(+1.91)#64 | 4.1%(+1.20)#4,932 |
| 65. | Crozet | 5.3% | 3.4%(+1.90)#65 | 4.1%(+1.19)#4,934 |
| 66. | Sudley | 5.2% | 3.4%(+1.80)#66 | 4.1%(+1.09)#5,095 |
| 67. | Annandale | 5.1% | 3.4%(+1.69)#67 | 4.1%(+0.980)#5,267 |
| 68. | Highland Springs | 5.1% | 3.4%(+1.68)#68 | 4.1%(+0.973)#5,281 |
| 69. | Falls Church | 5.1% | 3.4%(+1.66)#69 | 4.1%(+0.952)#5,315 |
| 70. | Nellysford | 5.1% | 3.4%(+1.65)#70 | 4.1%(+0.940)#5,338 |
| 71. | Harrisonburg | 5.0% | 3.4%(+1.61)#71 | 4.1%(+0.897)#5,405 |
| 72. | Huntington | 4.9% | 3.4%(+1.51)#72 | 4.1%(+0.804)#5,570 |
| 73. | Innsbrook | 4.9% | 3.4%(+1.46)#73 | 4.1%(+0.750)#5,672 |
| 74. | Independent Hill | 4.9% | 3.4%(+1.45)#74 | 4.1%(+0.741)#5,689 |
| 75. | Shenandoah Shores | 4.8% | 3.4%(+1.41)#75 | 4.1%(+0.704)#5,759 |
| 76. | Pantops | 4.8% | 3.4%(+1.41)#76 | 4.1%(+0.703)#5,763 |
| 77. | Newington | 4.8% | 3.4%(+1.38)#77 | 4.1%(+0.668)#5,817 |
| 78. | Salem | 4.8% | 3.4%(+1.37)#78 | 4.1%(+0.664)#5,822 |
| 79. | Lovettsville | 4.7% | 3.4%(+1.28)#79 | 4.1%(+0.568)#6,006 |
| 80. | Pearisburg | 4.7% | 3.4%(+1.27)#80 | 4.1%(+0.563)#6,011 |
| 81. | West Falls Church | 4.6% | 3.4%(+1.21)#81 | 4.1%(+0.499)#6,152 |
| 82. | Glen Allen | 4.6% | 3.4%(+1.18)#82 | 4.1%(+0.471)#6,210 |
| 83. | Loch Lomond | 4.5% | 3.4%(+1.12)#83 | 4.1%(+0.410)#6,323 |
| 84. | Crosspointe | 4.5% | 3.4%(+1.12)#84 | 4.1%(+0.406)#6,356 |
| 85. | Lebanon | 4.5% | 3.4%(+1.09)#85 | 4.1%(+0.379)#6,404 |
| 86. | Linton Hall | 4.5% | 3.4%(+1.07)#86 | 4.1%(+0.359)#6,448 |
| 87. | Arlington | 4.5% | 3.4%(+1.05)#87 | 4.1%(+0.337)#6,504 |
| 88. | Mason Neck | 4.4% | 3.4%(+1.02)#88 | 4.1%(+0.307)#6,564 |
| 89. | Central Garage | 4.4% | 3.4%(+0.986)#89 | 4.1%(+0.277)#6,622 |
| 90. | Laurel Hill | 4.4% | 3.4%(+0.983)#90 | 4.1%(+0.274)#6,633 |
| 91. | Martinsville | 4.4% | 3.4%(+0.975)#91 | 4.1%(+0.266)#6,650 |
| 92. | Sterling | 4.4% | 3.4%(+0.970)#92 | 4.1%(+0.261)#6,657 |
| 93. | Lansdowne | 4.4% | 3.4%(+0.962)#93 | 4.1%(+0.253)#6,680 |
| 94. | Montclair | 4.4% | 3.4%(+0.961)#94 | 4.1%(+0.251)#6,682 |
| 95. | Brightwood | 4.4% | 3.4%(+0.960)#95 | 4.1%(+0.251)#6,684 |
| 96. | Bellwood | 4.4% | 3.4%(+0.952)#96 | 4.1%(+0.243)#6,700 |
| 97. | East Highland Park | 4.4% | 3.4%(+0.942)#97 | 4.1%(+0.233)#6,722 |
| 98. | Reston | 4.4% | 3.4%(+0.939)#98 | 4.1%(+0.230)#6,730 |
| 99. | Bull Run | 4.3% | 3.4%(+0.900)#99 | 4.1%(+0.190)#6,823 |
| 100. | Piney Mountain | 4.3% | 3.4%(+0.890)#100 | 4.1%(+0.180)#6,843 |
Common Questions
What are the Top 10 Cities with the Highest Percentage of Population with a Degree in Communications in Virginia?
Top 10 Cities with the Highest Percentage of Population with a Degree in Communications in Virginia are:
#1
73.8%
#2
73.5%
#3
36.7%
#4
28.6%
#5
24.1%
#6
20.3%
#7
20.3%
#8
20.0%
#9
19.7%
#10
17.6%
What city has the Highest Percentage of Population with a Degree in Communications in Virginia?
Calverton has the Highest Percentage of Population with a Degree in Communications in Virginia with 73.8%.
What is the Percentage of Population with a Degree in Communications in the State of Virginia?
Percentage of Population with a Degree in Communications in Virginia is 3.4%.
What is the Percentage of Population with a Degree in Communications in the United States?
Percentage of Population with a Degree in Communications in the United States is 4.1%.