Cities with the Highest Percentage of Population with a Degree in Communications in Kentucky
RELATED REPORTS & OPTIONS
Communications
Kentucky
Compare Cities
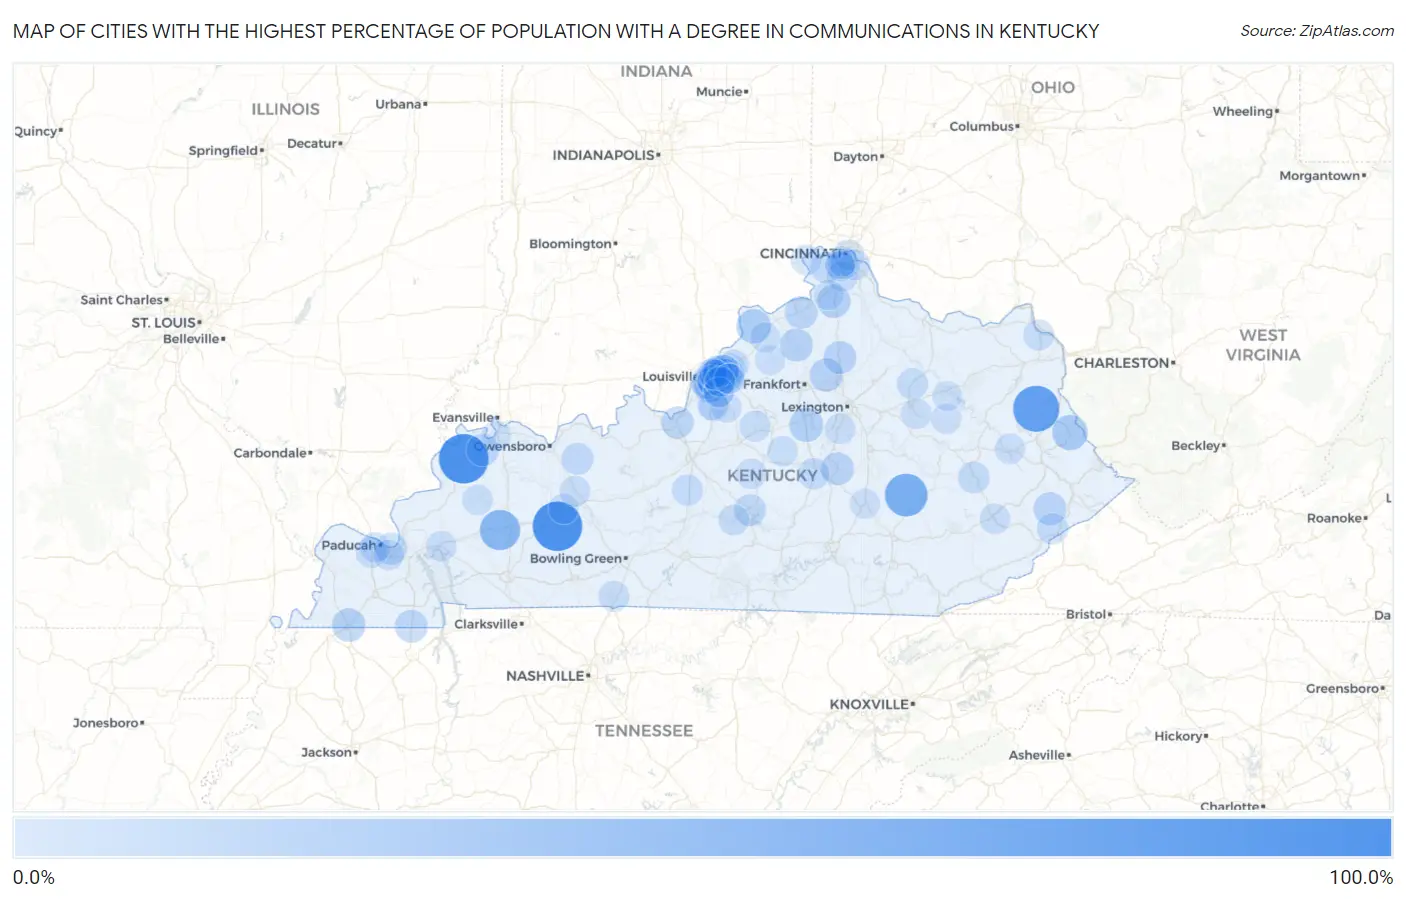
Map of Cities with the Highest Percentage of Population with a Degree in Communications in Kentucky
0.0%
100.0%
Cities with the Highest Percentage of Population with a Degree in Communications in Kentucky
| City | % Graduates | vs State | vs National | |
| 1. | Breckinridge Center | 100.0% | 4.2%(+95.8)#1 | 4.1%(+95.9)#1 |
| 2. | Drakesboro | 100.0% | 4.2%(+95.8)#2 | 4.1%(+95.9)#3 |
| 3. | Blaine | 83.3% | 4.2%(+79.1)#3 | 4.1%(+79.2)#27 |
| 4. | Mckee | 65.9% | 4.2%(+61.6)#4 | 4.1%(+61.7)#46 |
| 5. | St Charles | 53.8% | 4.2%(+49.6)#5 | 4.1%(+49.7)#65 |
| 6. | Inez | 30.2% | 4.2%(+26.0)#6 | 4.1%(+26.1)#228 |
| 7. | Bedford | 25.9% | 4.2%(+21.7)#7 | 4.1%(+21.8)#295 |
| 8. | Salvisa | 23.5% | 4.2%(+19.3)#8 | 4.1%(+19.4)#351 |
| 9. | Crittenden | 21.2% | 4.2%(+17.0)#9 | 4.1%(+17.1)#406 |
| 10. | Fulton | 21.0% | 4.2%(+16.8)#10 | 4.1%(+16.8)#415 |
| 11. | Gratz | 20.0% | 4.2%(+15.8)#11 | 4.1%(+15.9)#471 |
| 12. | Stamping Ground | 19.8% | 4.2%(+15.6)#12 | 4.1%(+15.7)#477 |
| 13. | Lancaster | 18.8% | 4.2%(+14.6)#13 | 4.1%(+14.7)#512 |
| 14. | Wheelwright | 18.6% | 4.2%(+14.4)#14 | 4.1%(+14.5)#517 |
| 15. | Sadieville | 18.4% | 4.2%(+14.2)#15 | 4.1%(+14.3)#525 |
| 16. | Thruston | 18.3% | 4.2%(+14.1)#16 | 4.1%(+14.1)#530 |
| 17. | Hazel | 17.4% | 4.2%(+13.2)#17 | 4.1%(+13.3)#569 |
| 18. | Sparta | 16.7% | 4.2%(+12.4)#18 | 4.1%(+12.5)#611 |
| 19. | Corydon | 15.6% | 4.2%(+11.3)#19 | 4.1%(+11.4)#704 |
| 20. | Muldraugh | 15.4% | 4.2%(+11.2)#20 | 4.1%(+11.2)#716 |
| 21. | West Buechel | 14.5% | 4.2%(+10.3)#21 | 4.1%(+10.4)#799 |
| 22. | Campbellsville | 14.5% | 4.2%(+10.3)#22 | 4.1%(+10.3)#800 |
| 23. | Ledbetter | 14.2% | 4.2%(+9.97)#23 | 4.1%(+10.1)#850 |
| 24. | Whitesville | 14.0% | 4.2%(+9.73)#24 | 4.1%(+9.82)#871 |
| 25. | Jackson | 12.4% | 4.2%(+8.17)#25 | 4.1%(+8.25)#1,082 |
| 26. | Parkway Village | 12.0% | 4.2%(+7.78)#26 | 4.1%(+7.86)#1,135 |
| 27. | Watterson Park | 11.8% | 4.2%(+7.54)#27 | 4.1%(+7.63)#1,179 |
| 28. | Junction City | 11.6% | 4.2%(+7.42)#28 | 4.1%(+7.50)#1,210 |
| 29. | Glenview Manor | 11.5% | 4.2%(+7.28)#29 | 4.1%(+7.37)#1,233 |
| 30. | Oakbrook | 11.3% | 4.2%(+7.10)#30 | 4.1%(+7.19)#1,260 |
| 31. | Woodlawn Park | 11.3% | 4.2%(+7.09)#31 | 4.1%(+7.18)#1,264 |
| 32. | Westwood | 11.2% | 4.2%(+6.94)#32 | 4.1%(+7.03)#1,284 |
| 33. | Sharpsburg | 11.1% | 4.2%(+6.89)#33 | 4.1%(+6.98)#1,297 |
| 34. | Fleming Neon | 11.0% | 4.2%(+6.74)#34 | 4.1%(+6.82)#1,341 |
| 35. | Upton | 10.5% | 4.2%(+6.30)#35 | 4.1%(+6.39)#1,443 |
| 36. | Wellington | 10.5% | 4.2%(+6.26)#36 | 4.1%(+6.35)#1,461 |
| 37. | Bellemeade | 10.2% | 4.2%(+6.00)#37 | 4.1%(+6.08)#1,524 |
| 38. | Worthington Hills | 10.2% | 4.2%(+5.99)#38 | 4.1%(+6.08)#1,525 |
| 39. | Old Brownsboro Place | 10.2% | 4.2%(+5.95)#39 | 4.1%(+6.03)#1,539 |
| 40. | Rolling Fields | 9.5% | 4.2%(+5.32)#40 | 4.1%(+5.40)#1,726 |
| 41. | Independence | 9.3% | 4.2%(+5.10)#41 | 4.1%(+5.19)#1,797 |
| 42. | Norbourne Estates | 9.1% | 4.2%(+4.90)#42 | 4.1%(+4.99)#1,853 |
| 43. | Massac | 9.1% | 4.2%(+4.88)#43 | 4.1%(+4.96)#1,858 |
| 44. | Greenup | 9.0% | 4.2%(+4.77)#44 | 4.1%(+4.85)#1,923 |
| 45. | Strathmoor Village | 8.9% | 4.2%(+4.69)#45 | 4.1%(+4.78)#1,947 |
| 46. | Franklin | 8.9% | 4.2%(+4.63)#46 | 4.1%(+4.72)#1,970 |
| 47. | Bloomfield | 8.8% | 4.2%(+4.54)#47 | 4.1%(+4.63)#2,006 |
| 48. | Greensburg | 8.5% | 4.2%(+4.28)#48 | 4.1%(+4.36)#2,121 |
| 49. | Hartford | 8.4% | 4.2%(+4.17)#49 | 4.1%(+4.26)#2,175 |
| 50. | Crestwood | 8.2% | 4.2%(+3.96)#50 | 4.1%(+4.05)#2,275 |
| 51. | Camargo | 8.2% | 4.2%(+3.94)#51 | 4.1%(+4.03)#2,283 |
| 52. | Newport | 8.1% | 4.2%(+3.86)#52 | 4.1%(+3.95)#2,314 |
| 53. | Cold Spring | 8.1% | 4.2%(+3.85)#53 | 4.1%(+3.93)#2,323 |
| 54. | Eddyville | 8.0% | 4.2%(+3.81)#54 | 4.1%(+3.89)#2,342 |
| 55. | Providence | 8.0% | 4.2%(+3.79)#55 | 4.1%(+3.88)#2,348 |
| 56. | St Mary | 8.0% | 4.2%(+3.78)#56 | 4.1%(+3.86)#2,362 |
| 57. | Anchorage | 7.9% | 4.2%(+3.72)#57 | 4.1%(+3.81)#2,382 |
| 58. | Broeck Pointe | 7.9% | 4.2%(+3.65)#58 | 4.1%(+3.74)#2,422 |
| 59. | Petersburg | 7.6% | 4.2%(+3.43)#59 | 4.1%(+3.51)#2,568 |
| 60. | Nicholasville | 7.6% | 4.2%(+3.36)#60 | 4.1%(+3.45)#2,600 |
| 61. | Lynnview | 7.6% | 4.2%(+3.34)#61 | 4.1%(+3.43)#2,613 |
| 62. | Audubon Park | 7.6% | 4.2%(+3.33)#62 | 4.1%(+3.42)#2,617 |
| 63. | Strathmoor Manor | 7.5% | 4.2%(+3.33)#63 | 4.1%(+3.41)#2,627 |
| 64. | Hollow Creek | 7.4% | 4.2%(+3.23)#64 | 4.1%(+3.31)#2,681 |
| 65. | St Matthews | 7.2% | 4.2%(+3.02)#65 | 4.1%(+3.10)#2,841 |
| 66. | Paducah | 7.2% | 4.2%(+2.99)#66 | 4.1%(+3.07)#2,864 |
| 67. | Rockport | 7.1% | 4.2%(+2.92)#67 | 4.1%(+3.01)#2,931 |
| 68. | Hurstbourne | 7.1% | 4.2%(+2.86)#68 | 4.1%(+2.94)#2,968 |
| 69. | Thornhill | 7.1% | 4.2%(+2.85)#69 | 4.1%(+2.94)#2,974 |
| 70. | Hazard | 7.1% | 4.2%(+2.84)#70 | 4.1%(+2.93)#2,979 |
| 71. | Hebron Estates | 7.1% | 4.2%(+2.83)#71 | 4.1%(+2.92)#2,988 |
| 72. | Moorland | 7.0% | 4.2%(+2.80)#72 | 4.1%(+2.88)#3,019 |
| 73. | Druid Hills | 7.0% | 4.2%(+2.77)#73 | 4.1%(+2.85)#3,052 |
| 74. | Salyersville | 6.9% | 4.2%(+2.67)#74 | 4.1%(+2.76)#3,116 |
| 75. | Mackville | 6.9% | 4.2%(+2.67)#75 | 4.1%(+2.76)#3,123 |
| 76. | Blue Ridge Manor | 6.9% | 4.2%(+2.64)#76 | 4.1%(+2.73)#3,144 |
| 77. | Mount Washington | 6.8% | 4.2%(+2.62)#77 | 4.1%(+2.71)#3,162 |
| 78. | Reidland | 6.8% | 4.2%(+2.59)#78 | 4.1%(+2.68)#3,201 |
| 79. | Seneca Gardens | 6.8% | 4.2%(+2.58)#79 | 4.1%(+2.67)#3,207 |
| 80. | Bellewood | 6.8% | 4.2%(+2.58)#80 | 4.1%(+2.67)#3,216 |
| 81. | Covington | 6.7% | 4.2%(+2.49)#81 | 4.1%(+2.57)#3,299 |
| 82. | Verona | 6.7% | 4.2%(+2.44)#82 | 4.1%(+2.53)#3,324 |
| 83. | Ten Broeck | 6.7% | 4.2%(+2.44)#83 | 4.1%(+2.53)#3,362 |
| 84. | Houston Acres | 6.6% | 4.2%(+2.34)#84 | 4.1%(+2.42)#3,449 |
| 85. | Eminence | 6.5% | 4.2%(+2.32)#85 | 4.1%(+2.41)#3,457 |
| 86. | Crestview Hills | 6.5% | 4.2%(+2.25)#86 | 4.1%(+2.34)#3,527 |
| 87. | Northfield | 6.4% | 4.2%(+2.22)#87 | 4.1%(+2.31)#3,555 |
| 88. | Middletown | 6.4% | 4.2%(+2.22)#88 | 4.1%(+2.30)#3,560 |
| 89. | Frenchburg | 6.4% | 4.2%(+2.16)#89 | 4.1%(+2.25)#3,615 |
| 90. | Fort Wright | 6.3% | 4.2%(+2.10)#90 | 4.1%(+2.19)#3,669 |
| 91. | Henderson | 6.3% | 4.2%(+2.04)#91 | 4.1%(+2.13)#3,722 |
| 92. | Campbellsburg | 6.2% | 4.2%(+2.03)#92 | 4.1%(+2.11)#3,751 |
| 93. | Mockingbird Valley | 6.2% | 4.2%(+2.03)#93 | 4.1%(+2.11)#3,778 |
| 94. | Edgewood | 6.2% | 4.2%(+2.03)#94 | 4.1%(+2.11)#3,784 |
| 95. | Hillview | 6.1% | 4.2%(+1.93)#95 | 4.1%(+2.01)#3,860 |
| 96. | Spring Mill | 6.1% | 4.2%(+1.92)#96 | 4.1%(+2.01)#3,874 |
| 97. | Salt Lick | 6.1% | 4.2%(+1.90)#97 | 4.1%(+1.99)#3,895 |
| 98. | Mount Vernon | 6.1% | 4.2%(+1.85)#98 | 4.1%(+1.94)#3,949 |
| 99. | Douglass Hills | 6.0% | 4.2%(+1.80)#99 | 4.1%(+1.88)#4,018 |
| 100. | Lincolnshire | 6.0% | 4.2%(+1.78)#100 | 4.1%(+1.86)#4,042 |
Common Questions
What are the Top 10 Cities with the Highest Percentage of Population with a Degree in Communications in Kentucky?
Top 10 Cities with the Highest Percentage of Population with a Degree in Communications in Kentucky are:
#1
100.0%
#2
100.0%
#3
83.3%
#4
65.9%
#5
53.8%
#6
30.2%
#7
25.9%
#8
23.5%
#9
21.2%
#10
21.0%
What city has the Highest Percentage of Population with a Degree in Communications in Kentucky?
Breckinridge Center has the Highest Percentage of Population with a Degree in Communications in Kentucky with 100.0%.
What is the Percentage of Population with a Degree in Communications in the State of Kentucky?
Percentage of Population with a Degree in Communications in Kentucky is 4.2%.
What is the Percentage of Population with a Degree in Communications in the United States?
Percentage of Population with a Degree in Communications in the United States is 4.1%.