Cities with the Highest Percentage of Population with a Degree in Communications in Michigan
RELATED REPORTS & OPTIONS
Communications
Michigan
Compare Cities
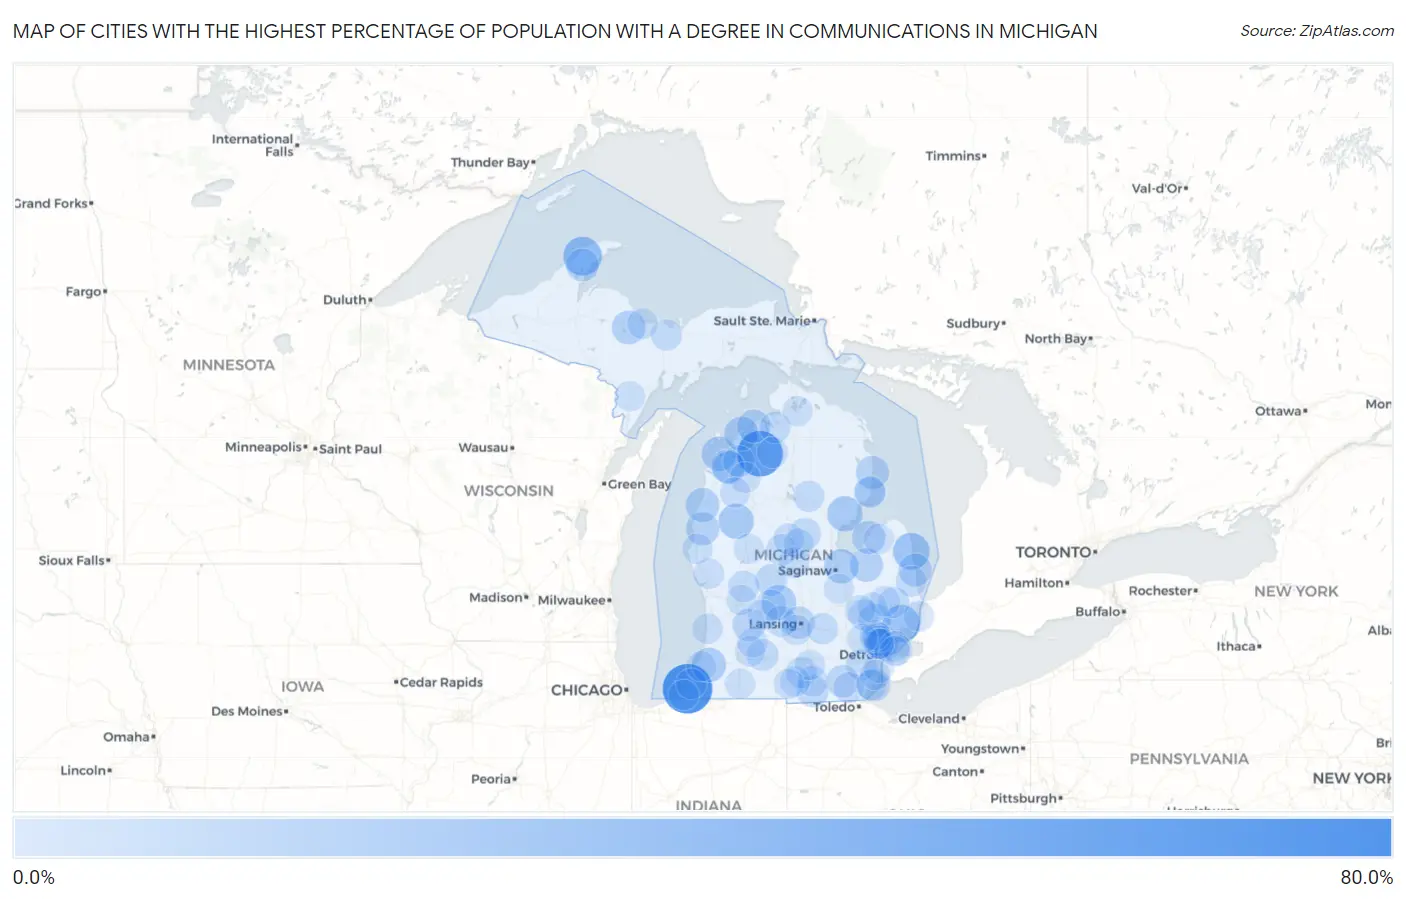
Map of Cities with the Highest Percentage of Population with a Degree in Communications in Michigan
0.0%
80.0%
Cities with the Highest Percentage of Population with a Degree in Communications in Michigan
| City | % Graduates | vs State | vs National | |
| 1. | New Troy | 66.7% | 3.9%(+62.8)#1 | 4.1%(+62.5)#43 |
| 2. | Alden | 54.5% | 3.9%(+50.7)#2 | 4.1%(+50.4)#63 |
| 3. | Ahmeek | 32.4% | 3.9%(+28.6)#3 | 4.1%(+28.3)#198 |
| 4. | New Haven | 29.0% | 3.9%(+25.1)#4 | 4.1%(+24.8)#243 |
| 5. | Forestville | 26.7% | 3.9%(+22.8)#5 | 4.1%(+22.5)#277 |
| 6. | Rockland | 25.0% | 3.9%(+21.1)#6 | 4.1%(+20.9)#313 |
| 7. | Luther | 22.2% | 3.9%(+18.3)#7 | 4.1%(+18.1)#373 |
| 8. | Lake Gogebic | 22.2% | 3.9%(+18.3)#8 | 4.1%(+18.1)#378 |
| 9. | Turner | 22.2% | 3.9%(+18.3)#9 | 4.1%(+18.1)#380 |
| 10. | Muir | 20.8% | 3.9%(+17.0)#10 | 4.1%(+16.7)#420 |
| 11. | Hartford | 20.0% | 3.9%(+16.1)#11 | 4.1%(+15.9)#449 |
| 12. | Robin Glen Indiantown | 19.4% | 3.9%(+15.6)#12 | 4.1%(+15.3)#487 |
| 13. | Glen Arbor | 19.0% | 3.9%(+15.2)#13 | 4.1%(+14.9)#498 |
| 14. | Northport | 18.5% | 3.9%(+14.6)#14 | 4.1%(+14.3)#524 |
| 15. | Eastlake | 17.8% | 3.9%(+13.9)#15 | 4.1%(+13.6)#551 |
| 16. | Palmer | 17.6% | 3.9%(+13.8)#16 | 4.1%(+13.5)#557 |
| 17. | Caro | 17.0% | 3.9%(+13.1)#17 | 4.1%(+12.8)#594 |
| 18. | Covington | 16.7% | 3.9%(+12.8)#18 | 4.1%(+12.5)#628 |
| 19. | Lake Ann | 16.4% | 3.9%(+12.5)#19 | 4.1%(+12.3)#641 |
| 20. | Norwood | 16.4% | 3.9%(+12.5)#20 | 4.1%(+12.3)#643 |
| 21. | Bay Port | 16.2% | 3.9%(+12.3)#21 | 4.1%(+12.1)#657 |
| 22. | Scottville | 16.0% | 3.9%(+12.2)#22 | 4.1%(+11.9)#665 |
| 23. | Harrisville | 15.8% | 3.9%(+12.0)#23 | 4.1%(+11.7)#683 |
| 24. | Port Sanilac | 15.5% | 3.9%(+11.6)#24 | 4.1%(+11.4)#710 |
| 25. | Lake Linden | 14.8% | 3.9%(+10.9)#25 | 4.1%(+10.7)#767 |
| 26. | Stony Point | 14.8% | 3.9%(+10.9)#26 | 4.1%(+10.6)#773 |
| 27. | Hardwood Acres | 14.4% | 3.9%(+10.6)#27 | 4.1%(+10.3)#805 |
| 28. | Middleville | 14.4% | 3.9%(+10.5)#28 | 4.1%(+10.3)#806 |
| 29. | Lake Orion | 14.0% | 3.9%(+10.1)#29 | 4.1%(+9.82)#873 |
| 30. | Britton | 12.9% | 3.9%(+9.07)#30 | 4.1%(+8.81)#989 |
| 31. | Edgemont Park | 12.8% | 3.9%(+8.96)#31 | 4.1%(+8.70)#1,005 |
| 32. | Ferndale | 12.7% | 3.9%(+8.85)#32 | 4.1%(+8.60)#1,020 |
| 33. | Hudson | 12.4% | 3.9%(+8.56)#33 | 4.1%(+8.30)#1,076 |
| 34. | Stanton | 12.0% | 3.9%(+8.12)#34 | 4.1%(+7.86)#1,132 |
| 35. | Beaverton | 11.5% | 3.9%(+7.58)#35 | 4.1%(+7.32)#1,240 |
| 36. | Greilickville | 11.2% | 3.9%(+7.31)#36 | 4.1%(+7.05)#1,281 |
| 37. | Springfield | 10.9% | 3.9%(+7.02)#37 | 4.1%(+6.77)#1,358 |
| 38. | Boyne City | 10.6% | 3.9%(+6.77)#38 | 4.1%(+6.51)#1,420 |
| 39. | Paris | 10.6% | 3.9%(+6.71)#39 | 4.1%(+6.45)#1,427 |
| 40. | Cedar Springs | 10.2% | 3.9%(+6.35)#40 | 4.1%(+6.09)#1,522 |
| 41. | Webberville | 10.2% | 3.9%(+6.29)#41 | 4.1%(+6.03)#1,535 |
| 42. | Belleville | 10.1% | 3.9%(+6.22)#42 | 4.1%(+5.97)#1,558 |
| 43. | Beal City | 10.0% | 3.9%(+6.12)#43 | 4.1%(+5.86)#1,583 |
| 44. | Chatham | 10.0% | 3.9%(+6.12)#44 | 4.1%(+5.86)#1,596 |
| 45. | St Helen | 10.0% | 3.9%(+6.08)#45 | 4.1%(+5.82)#1,606 |
| 46. | Ortonville | 9.7% | 3.9%(+5.84)#46 | 4.1%(+5.58)#1,664 |
| 47. | Capac | 9.7% | 3.9%(+5.82)#47 | 4.1%(+5.56)#1,675 |
| 48. | Mulliken | 9.7% | 3.9%(+5.80)#48 | 4.1%(+5.54)#1,682 |
| 49. | Hanover | 9.7% | 3.9%(+5.80)#49 | 4.1%(+5.54)#1,683 |
| 50. | Oscoda | 9.6% | 3.9%(+5.72)#50 | 4.1%(+5.46)#1,712 |
| 51. | Shepherd | 9.5% | 3.9%(+5.59)#51 | 4.1%(+5.33)#1,760 |
| 52. | Beverly Hills | 9.4% | 3.9%(+5.54)#52 | 4.1%(+5.28)#1,775 |
| 53. | Petersburg | 9.4% | 3.9%(+5.50)#53 | 4.1%(+5.24)#1,783 |
| 54. | Au Sable | 9.0% | 3.9%(+5.16)#54 | 4.1%(+4.90)#1,908 |
| 55. | Madison Heights | 9.0% | 3.9%(+5.13)#55 | 4.1%(+4.87)#1,919 |
| 56. | Mancelona | 9.0% | 3.9%(+5.10)#56 | 4.1%(+4.84)#1,927 |
| 57. | Croswell | 9.0% | 3.9%(+5.08)#57 | 4.1%(+4.82)#1,934 |
| 58. | Ionia | 8.9% | 3.9%(+5.00)#58 | 4.1%(+4.74)#1,963 |
| 59. | Addison | 8.9% | 3.9%(+4.98)#59 | 4.1%(+4.73)#1,967 |
| 60. | Clare | 8.7% | 3.9%(+4.86)#60 | 4.1%(+4.60)#2,017 |
| 61. | Kingsley | 8.5% | 3.9%(+4.65)#61 | 4.1%(+4.39)#2,112 |
| 62. | Woodland Beach | 8.5% | 3.9%(+4.58)#62 | 4.1%(+4.32)#2,139 |
| 63. | Berkley | 8.4% | 3.9%(+4.56)#63 | 4.1%(+4.30)#2,151 |
| 64. | Harvey | 8.4% | 3.9%(+4.54)#64 | 4.1%(+4.28)#2,166 |
| 65. | St Clair | 8.4% | 3.9%(+4.52)#65 | 4.1%(+4.26)#2,174 |
| 66. | Saugatuck | 8.3% | 3.9%(+4.38)#66 | 4.1%(+4.12)#2,237 |
| 67. | Baroda | 8.2% | 3.9%(+4.29)#67 | 4.1%(+4.03)#2,284 |
| 68. | Richland | 8.1% | 3.9%(+4.26)#68 | 4.1%(+4.00)#2,291 |
| 69. | Imlay City | 8.1% | 3.9%(+4.20)#69 | 4.1%(+3.94)#2,321 |
| 70. | Twin Lake | 8.0% | 3.9%(+4.16)#70 | 4.1%(+3.90)#2,338 |
| 71. | Grosse Pointe Farms | 8.0% | 3.9%(+4.12)#71 | 4.1%(+3.86)#2,367 |
| 72. | Jonesville | 7.9% | 3.9%(+4.07)#72 | 4.1%(+3.81)#2,381 |
| 73. | Clarksville | 7.9% | 3.9%(+4.06)#73 | 4.1%(+3.80)#2,387 |
| 74. | Birmingham | 7.9% | 3.9%(+3.98)#74 | 4.1%(+3.73)#2,431 |
| 75. | Coleman | 7.8% | 3.9%(+3.97)#75 | 4.1%(+3.71)#2,443 |
| 76. | Pleasant Ridge | 7.8% | 3.9%(+3.91)#76 | 4.1%(+3.65)#2,475 |
| 77. | Riverview | 7.7% | 3.9%(+3.87)#77 | 4.1%(+3.61)#2,493 |
| 78. | Grosse Pointe Woods | 7.7% | 3.9%(+3.86)#78 | 4.1%(+3.60)#2,495 |
| 79. | Mesick | 7.7% | 3.9%(+3.82)#79 | 4.1%(+3.56)#2,528 |
| 80. | Three Oaks | 7.7% | 3.9%(+3.77)#80 | 4.1%(+3.52)#2,567 |
| 81. | Dimondale | 7.6% | 3.9%(+3.72)#81 | 4.1%(+3.46)#2,593 |
| 82. | Hart | 7.5% | 3.9%(+3.66)#82 | 4.1%(+3.41)#2,631 |
| 83. | Three Rivers | 7.3% | 3.9%(+3.47)#83 | 4.1%(+3.21)#2,759 |
| 84. | Bloomfield Hills | 7.3% | 3.9%(+3.46)#84 | 4.1%(+3.20)#2,763 |
| 85. | Montrose | 7.3% | 3.9%(+3.44)#85 | 4.1%(+3.18)#2,783 |
| 86. | Metamora | 7.3% | 3.9%(+3.44)#86 | 4.1%(+3.18)#2,788 |
| 87. | Grosse Pointe | 7.3% | 3.9%(+3.38)#87 | 4.1%(+3.12)#2,831 |
| 88. | Vandercook Lake | 7.3% | 3.9%(+3.38)#88 | 4.1%(+3.12)#2,833 |
| 89. | Delton | 7.2% | 3.9%(+3.34)#89 | 4.1%(+3.08)#2,863 |
| 90. | South Rockwood | 7.2% | 3.9%(+3.29)#90 | 4.1%(+3.03)#2,896 |
| 91. | Goodrich | 7.2% | 3.9%(+3.28)#91 | 4.1%(+3.02)#2,900 |
| 92. | Big Rapids | 7.1% | 3.9%(+3.27)#92 | 4.1%(+3.01)#2,905 |
| 93. | Indian River | 7.1% | 3.9%(+3.27)#93 | 4.1%(+3.01)#2,909 |
| 94. | Allen | 7.1% | 3.9%(+3.27)#94 | 4.1%(+3.01)#2,933 |
| 95. | Carney | 7.1% | 3.9%(+3.27)#95 | 4.1%(+3.01)#2,934 |
| 96. | Northview | 7.1% | 3.9%(+3.24)#96 | 4.1%(+2.98)#2,944 |
| 97. | Coloma | 7.1% | 3.9%(+3.22)#97 | 4.1%(+2.96)#2,955 |
| 98. | Elkton | 7.1% | 3.9%(+3.19)#98 | 4.1%(+2.94)#2,971 |
| 99. | Oak Park | 7.1% | 3.9%(+3.19)#99 | 4.1%(+2.93)#2,975 |
| 100. | Walled Lake | 7.0% | 3.9%(+3.11)#100 | 4.1%(+2.85)#3,050 |
Common Questions
What are the Top 10 Cities with the Highest Percentage of Population with a Degree in Communications in Michigan?
Top 10 Cities with the Highest Percentage of Population with a Degree in Communications in Michigan are:
#1
66.7%
#2
54.5%
#3
32.4%
#4
29.0%
#5
26.7%
#6
22.2%
#7
22.2%
#8
20.8%
#9
20.0%
#10
19.4%
What city has the Highest Percentage of Population with a Degree in Communications in Michigan?
New Troy has the Highest Percentage of Population with a Degree in Communications in Michigan with 66.7%.
What is the Percentage of Population with a Degree in Communications in the State of Michigan?
Percentage of Population with a Degree in Communications in Michigan is 3.9%.
What is the Percentage of Population with a Degree in Communications in the United States?
Percentage of Population with a Degree in Communications in the United States is 4.1%.