Cities with the Highest Percentage of Population with a Degree in Communications in Louisiana
RELATED REPORTS & OPTIONS
Communications
Louisiana
Compare Cities
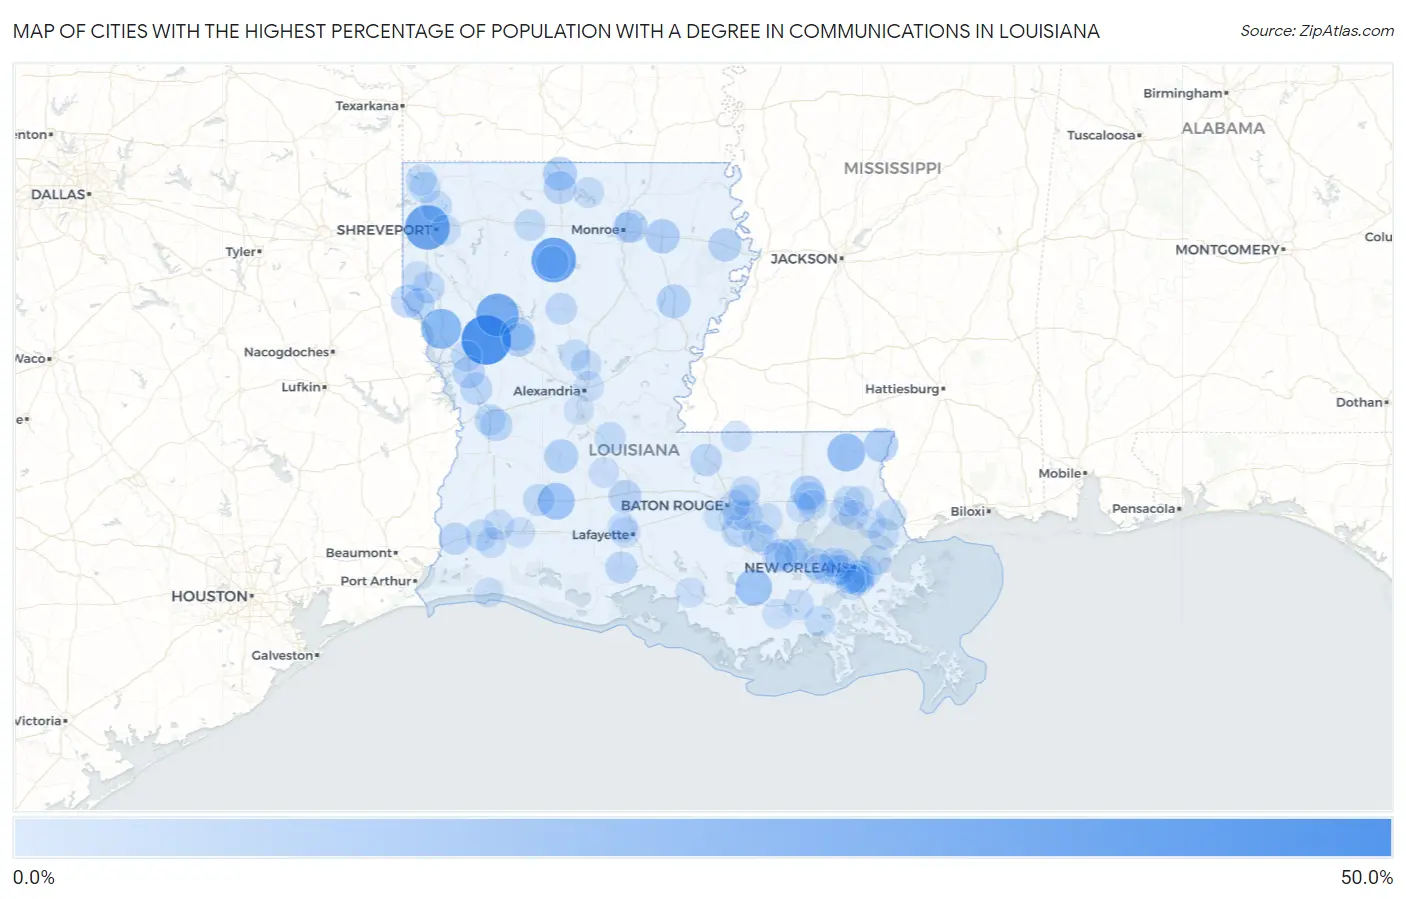
Map of Cities with the Highest Percentage of Population with a Degree in Communications in Louisiana
0.0%
50.0%
Cities with the Highest Percentage of Population with a Degree in Communications in Louisiana
| City | % Graduates | vs State | vs National | |
| 1. | Robeline | 50.0% | 3.2%(+46.8)#1 | 4.1%(+45.9)#82 |
| 2. | North Hodge | 38.1% | 3.2%(+34.8)#2 | 4.1%(+34.0)#143 |
| 3. | Lakeview | 37.8% | 3.2%(+34.6)#3 | 4.1%(+33.7)#145 |
| 4. | Powhatan | 33.3% | 3.2%(+30.1)#4 | 4.1%(+29.2)#193 |
| 5. | Converse | 26.5% | 3.2%(+23.2)#5 | 4.1%(+22.3)#282 |
| 6. | Franklinton | 21.4% | 3.2%(+18.1)#6 | 4.1%(+17.3)#401 |
| 7. | Elton | 19.0% | 3.2%(+15.7)#7 | 4.1%(+14.9)#500 |
| 8. | Labadieville | 18.6% | 3.2%(+15.4)#8 | 4.1%(+14.5)#518 |
| 9. | Rayville | 13.1% | 3.2%(+9.87)#9 | 4.1%(+8.98)#973 |
| 10. | Natalbany | 12.5% | 3.2%(+9.25)#10 | 4.1%(+8.36)#1,042 |
| 11. | Varnado | 12.5% | 3.2%(+9.25)#11 | 4.1%(+8.36)#1,051 |
| 12. | Vienna Bend | 12.0% | 3.2%(+8.75)#12 | 4.1%(+7.86)#1,131 |
| 13. | Lillie | 12.0% | 3.2%(+8.75)#13 | 4.1%(+7.86)#1,139 |
| 14. | Oakdale | 12.0% | 3.2%(+8.72)#14 | 4.1%(+7.83)#1,143 |
| 15. | Wisner | 11.5% | 3.2%(+8.25)#15 | 4.1%(+7.36)#1,235 |
| 16. | Point Place | 10.7% | 3.2%(+7.47)#16 | 4.1%(+6.58)#1,402 |
| 17. | Logansport | 10.3% | 3.2%(+7.10)#17 | 4.1%(+6.21)#1,489 |
| 18. | Tallulah | 10.2% | 3.2%(+6.91)#18 | 4.1%(+6.02)#1,542 |
| 19. | Garyville | 9.9% | 3.2%(+6.62)#19 | 4.1%(+5.73)#1,630 |
| 20. | Opelousas | 9.7% | 3.2%(+6.42)#20 | 4.1%(+5.53)#1,689 |
| 21. | Bernice | 9.5% | 3.2%(+6.28)#21 | 4.1%(+5.39)#1,727 |
| 22. | Hodge | 9.5% | 3.2%(+6.28)#22 | 4.1%(+5.39)#1,734 |
| 23. | Lakeshore | 9.3% | 3.2%(+6.01)#23 | 4.1%(+5.12)#1,824 |
| 24. | Lutcher | 8.8% | 3.2%(+5.58)#24 | 4.1%(+4.70)#1,977 |
| 25. | Fort Polk South | 8.7% | 3.2%(+5.43)#25 | 4.1%(+4.54)#2,049 |
| 26. | Hornbeck | 8.3% | 3.2%(+5.09)#26 | 4.1%(+4.20)#2,191 |
| 27. | Gretna | 8.1% | 3.2%(+4.89)#27 | 4.1%(+4.00)#2,297 |
| 28. | Florien | 8.1% | 3.2%(+4.86)#28 | 4.1%(+3.97)#2,305 |
| 29. | Vinton | 7.8% | 3.2%(+4.60)#29 | 4.1%(+3.71)#2,437 |
| 30. | St Francisville | 7.8% | 3.2%(+4.52)#30 | 4.1%(+3.63)#2,481 |
| 31. | Abbeville | 7.5% | 3.2%(+4.22)#31 | 4.1%(+3.33)#2,664 |
| 32. | St Gabriel | 7.5% | 3.2%(+4.22)#32 | 4.1%(+3.33)#2,665 |
| 33. | Grand Cane | 7.4% | 3.2%(+4.16)#33 | 4.1%(+3.27)#2,715 |
| 34. | Perry | 7.4% | 3.2%(+4.14)#34 | 4.1%(+3.25)#2,725 |
| 35. | Hammond | 7.3% | 3.2%(+4.00)#35 | 4.1%(+3.12)#2,834 |
| 36. | Kinder | 7.0% | 3.2%(+3.75)#36 | 4.1%(+2.86)#3,043 |
| 37. | Winnfield | 7.0% | 3.2%(+3.73)#37 | 4.1%(+2.84)#3,059 |
| 38. | Stanley | 6.7% | 3.2%(+3.42)#38 | 4.1%(+2.53)#3,360 |
| 39. | New Llano | 6.6% | 3.2%(+3.39)#39 | 4.1%(+2.50)#3,376 |
| 40. | Terrytown | 6.5% | 3.2%(+3.22)#40 | 4.1%(+2.33)#3,532 |
| 41. | Benton | 6.5% | 3.2%(+3.21)#41 | 4.1%(+2.32)#3,541 |
| 42. | Sulphur | 6.3% | 3.2%(+3.05)#42 | 4.1%(+2.16)#3,695 |
| 43. | Chalmette | 6.3% | 3.2%(+3.02)#43 | 4.1%(+2.13)#3,726 |
| 44. | Gilliam | 6.2% | 3.2%(+3.00)#44 | 4.1%(+2.11)#3,780 |
| 45. | Harvey | 6.2% | 3.2%(+2.99)#45 | 4.1%(+2.10)#3,790 |
| 46. | Arcadia | 6.1% | 3.2%(+2.82)#46 | 4.1%(+1.94)#3,953 |
| 47. | Bunkie | 5.9% | 3.2%(+2.70)#47 | 4.1%(+1.81)#4,096 |
| 48. | Many | 5.9% | 3.2%(+2.67)#48 | 4.1%(+1.79)#4,125 |
| 49. | Hosston | 5.6% | 3.2%(+2.31)#49 | 4.1%(+1.42)#4,616 |
| 50. | Norco | 5.5% | 3.2%(+2.28)#50 | 4.1%(+1.40)#4,654 |
| 51. | Eden Isle | 5.5% | 3.2%(+2.26)#51 | 4.1%(+1.37)#4,680 |
| 52. | Oak Hills Place | 5.5% | 3.2%(+2.24)#52 | 4.1%(+1.35)#4,715 |
| 53. | Dry Prong | 5.5% | 3.2%(+2.23)#53 | 4.1%(+1.34)#4,726 |
| 54. | Monticello | 5.3% | 3.2%(+2.08)#54 | 4.1%(+1.19)#4,947 |
| 55. | River Ridge | 5.1% | 3.2%(+1.87)#55 | 4.1%(+0.983)#5,262 |
| 56. | Larose | 5.1% | 3.2%(+1.87)#56 | 4.1%(+0.982)#5,263 |
| 57. | Gonzales | 5.1% | 3.2%(+1.86)#57 | 4.1%(+0.975)#5,279 |
| 58. | Timberlane | 5.1% | 3.2%(+1.84)#58 | 4.1%(+0.955)#5,312 |
| 59. | Pollock | 5.0% | 3.2%(+1.75)#59 | 4.1%(+0.865)#5,456 |
| 60. | Norwood | 5.0% | 3.2%(+1.75)#60 | 4.1%(+0.865)#5,471 |
| 61. | Port Vincent | 4.8% | 3.2%(+1.59)#61 | 4.1%(+0.704)#5,761 |
| 62. | Moss Bluff | 4.8% | 3.2%(+1.52)#62 | 4.1%(+0.636)#5,864 |
| 63. | Old Jefferson | 4.8% | 3.2%(+1.52)#63 | 4.1%(+0.627)#5,872 |
| 64. | Pearl River | 4.7% | 3.2%(+1.47)#64 | 4.1%(+0.585)#5,982 |
| 65. | Prien | 4.6% | 3.2%(+1.39)#65 | 4.1%(+0.499)#6,153 |
| 66. | Reserve | 4.6% | 3.2%(+1.38)#66 | 4.1%(+0.496)#6,160 |
| 67. | Farmerville | 4.6% | 3.2%(+1.35)#67 | 4.1%(+0.459)#6,240 |
| 68. | Baton Rouge | 4.6% | 3.2%(+1.34)#68 | 4.1%(+0.449)#6,254 |
| 69. | Covington | 4.5% | 3.2%(+1.29)#69 | 4.1%(+0.403)#6,363 |
| 70. | Ponchatoula | 4.5% | 3.2%(+1.27)#70 | 4.1%(+0.386)#6,392 |
| 71. | New Orleans | 4.5% | 3.2%(+1.26)#71 | 4.1%(+0.371)#6,420 |
| 72. | Bossier City | 4.5% | 3.2%(+1.26)#72 | 4.1%(+0.369)#6,422 |
| 73. | Grand Point | 4.5% | 3.2%(+1.24)#73 | 4.1%(+0.352)#6,461 |
| 74. | Mathews | 4.5% | 3.2%(+1.22)#74 | 4.1%(+0.334)#6,511 |
| 75. | Abita Springs | 4.4% | 3.2%(+1.15)#75 | 4.1%(+0.262)#6,654 |
| 76. | St Rose | 4.1% | 3.2%(+0.894)#76 | 4.1%(+0.005)#7,254 |
| 77. | Sorrento | 4.1% | 3.2%(+0.856)#77 | 4.1%(-0.032)#7,347 |
| 78. | Central | 4.0% | 3.2%(+0.765)#78 | 4.1%(-0.124)#7,532 |
| 79. | Scott | 4.0% | 3.2%(+0.757)#79 | 4.1%(-0.132)#7,544 |
| 80. | Metairie | 4.0% | 3.2%(+0.754)#80 | 4.1%(-0.134)#7,548 |
| 81. | Monroe | 4.0% | 3.2%(+0.742)#81 | 4.1%(-0.147)#7,596 |
| 82. | Ville Platte | 4.0% | 3.2%(+0.720)#82 | 4.1%(-0.169)#7,641 |
| 83. | Destrehan | 3.9% | 3.2%(+0.678)#83 | 4.1%(-0.210)#7,715 |
| 84. | Elmwood | 3.9% | 3.2%(+0.678)#84 | 4.1%(-0.211)#7,716 |
| 85. | Ossun | 3.9% | 3.2%(+0.675)#85 | 4.1%(-0.213)#7,719 |
| 86. | Iowa | 3.9% | 3.2%(+0.662)#86 | 4.1%(-0.227)#7,751 |
| 87. | Springfield | 3.9% | 3.2%(+0.650)#87 | 4.1%(-0.239)#7,790 |
| 88. | Pineville | 3.9% | 3.2%(+0.608)#88 | 4.1%(-0.281)#7,892 |
| 89. | Addis | 3.7% | 3.2%(+0.445)#89 | 4.1%(-0.444)#8,274 |
| 90. | Estelle | 3.6% | 3.2%(+0.329)#90 | 4.1%(-0.559)#8,525 |
| 91. | Keachi | 3.6% | 3.2%(+0.325)#91 | 4.1%(-0.564)#8,563 |
| 92. | Kenner | 3.5% | 3.2%(+0.295)#92 | 4.1%(-0.593)#8,620 |
| 93. | Lacombe | 3.5% | 3.2%(+0.261)#93 | 4.1%(-0.627)#8,719 |
| 94. | Bayou Cane | 3.5% | 3.2%(+0.239)#94 | 4.1%(-0.649)#8,774 |
| 95. | Woodworth | 3.5% | 3.2%(+0.219)#95 | 4.1%(-0.670)#8,825 |
| 96. | Marrero | 3.5% | 3.2%(+0.215)#96 | 4.1%(-0.673)#8,828 |
| 97. | Franklin | 3.4% | 3.2%(+0.171)#97 | 4.1%(-0.718)#8,938 |
| 98. | Madisonville | 3.4% | 3.2%(+0.119)#98 | 4.1%(-0.770)#9,067 |
| 99. | Mandeville | 3.3% | 3.2%(+0.034)#99 | 4.1%(-0.855)#9,285 |
| 100. | Cameron | 3.1% | 3.2%(-0.121)#100 | 4.1%(-1.01)#9,686 |
Common Questions
What are the Top 10 Cities with the Highest Percentage of Population with a Degree in Communications in Louisiana?
Top 10 Cities with the Highest Percentage of Population with a Degree in Communications in Louisiana are:
#1
50.0%
#2
38.1%
#3
37.8%
#4
33.3%
#5
26.5%
#6
21.4%
#7
19.0%
#8
18.6%
#9
13.1%
#10
12.5%
What city has the Highest Percentage of Population with a Degree in Communications in Louisiana?
Robeline has the Highest Percentage of Population with a Degree in Communications in Louisiana with 50.0%.
What is the Percentage of Population with a Degree in Communications in the State of Louisiana?
Percentage of Population with a Degree in Communications in Louisiana is 3.2%.
What is the Percentage of Population with a Degree in Communications in the United States?
Percentage of Population with a Degree in Communications in the United States is 4.1%.