Cities with the Highest Percentage of Population with a Degree in Communications in Utah
RELATED REPORTS & OPTIONS
Communications
Utah
Compare Cities
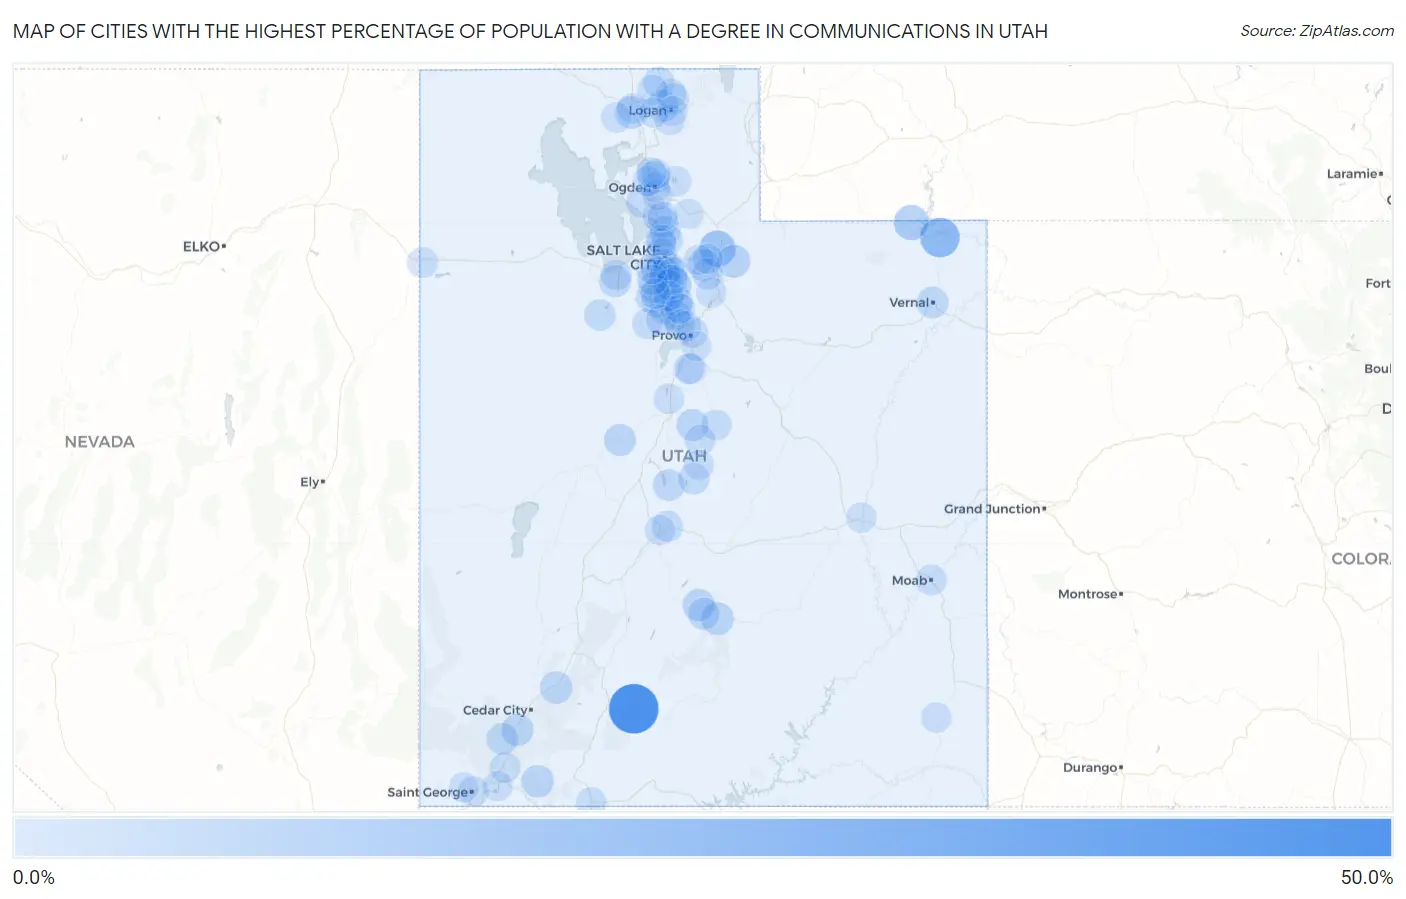
Map of Cities with the Highest Percentage of Population with a Degree in Communications in Utah
0.0%
50.0%
Cities with the Highest Percentage of Population with a Degree in Communications in Utah
| City | % Graduates | vs State | vs National | |
| 1. | Bryce Canyon City | 46.9% | 4.4%(+42.4)#1 | 4.1%(+42.7)#101 |
| 2. | Flaming Gorge | 23.5% | 4.4%(+19.1)#2 | 4.1%(+19.4)#354 |
| 3. | Wanship | 17.1% | 4.4%(+12.6)#3 | 4.1%(+12.9)#591 |
| 4. | Manila | 14.3% | 4.4%(+9.84)#4 | 4.1%(+10.2)#824 |
| 5. | Granite | 13.8% | 4.4%(+9.35)#5 | 4.1%(+9.66)#882 |
| 6. | Brighton | 10.5% | 4.4%(+6.08)#6 | 4.1%(+6.39)#1,449 |
| 7. | Oakley | 9.7% | 4.4%(+5.26)#7 | 4.1%(+5.57)#1,673 |
| 8. | Torrey | 9.0% | 4.4%(+4.53)#8 | 4.1%(+4.84)#1,929 |
| 9. | Parowan | 8.5% | 4.4%(+4.07)#9 | 4.1%(+4.38)#2,118 |
| 10. | Springdale | 8.5% | 4.4%(+4.04)#10 | 4.1%(+4.36)#2,127 |
| 11. | Snyderville | 8.5% | 4.4%(+4.01)#11 | 4.1%(+4.32)#2,140 |
| 12. | Tremonton | 8.4% | 4.4%(+3.98)#12 | 4.1%(+4.29)#2,160 |
| 13. | Lyman | 8.3% | 4.4%(+3.89)#13 | 4.1%(+4.20)#2,207 |
| 14. | Fountain Green | 8.1% | 4.4%(+3.61)#14 | 4.1%(+3.92)#2,326 |
| 15. | Harrisville | 7.8% | 4.4%(+3.40)#15 | 4.1%(+3.71)#2,442 |
| 16. | Leamington | 7.8% | 4.4%(+3.37)#16 | 4.1%(+3.68)#2,463 |
| 17. | Kanarraville | 7.7% | 4.4%(+3.25)#17 | 4.1%(+3.56)#2,530 |
| 18. | Erda | 7.6% | 4.4%(+3.11)#18 | 4.1%(+3.43)#2,614 |
| 19. | Vernal | 7.4% | 4.4%(+2.91)#19 | 4.1%(+3.22)#2,753 |
| 20. | East Basin | 7.3% | 4.4%(+2.86)#20 | 4.1%(+3.17)#2,799 |
| 21. | South Salt Lake | 7.2% | 4.4%(+2.73)#21 | 4.1%(+3.05)#2,885 |
| 22. | Bluffdale | 7.1% | 4.4%(+2.66)#22 | 4.1%(+2.97)#2,951 |
| 23. | Benson | 7.1% | 4.4%(+2.65)#23 | 4.1%(+2.96)#2,959 |
| 24. | New Harmony | 7.1% | 4.4%(+2.62)#24 | 4.1%(+2.94)#2,973 |
| 25. | Bicknell | 7.0% | 4.4%(+2.57)#25 | 4.1%(+2.88)#3,020 |
| 26. | Fayette | 7.0% | 4.4%(+2.57)#26 | 4.1%(+2.88)#3,023 |
| 27. | Midvale | 6.9% | 4.4%(+2.49)#27 | 4.1%(+2.81)#3,086 |
| 28. | Highland | 6.7% | 4.4%(+2.25)#28 | 4.1%(+2.56)#3,310 |
| 29. | Rush Valley | 6.7% | 4.4%(+2.22)#29 | 4.1%(+2.53)#3,342 |
| 30. | Lehi | 6.6% | 4.4%(+2.16)#30 | 4.1%(+2.47)#3,410 |
| 31. | Manti | 6.2% | 4.4%(+1.80)#31 | 4.1%(+2.11)#3,742 |
| 32. | Millcreek | 6.2% | 4.4%(+1.73)#32 | 4.1%(+2.04)#3,838 |
| 33. | Trenton | 6.0% | 4.4%(+1.55)#33 | 4.1%(+1.86)#4,040 |
| 34. | Alpine | 5.9% | 4.4%(+1.50)#34 | 4.1%(+1.81)#4,097 |
| 35. | Herriman | 5.8% | 4.4%(+1.31)#35 | 4.1%(+1.62)#4,328 |
| 36. | Park City | 5.8% | 4.4%(+1.31)#36 | 4.1%(+1.62)#4,333 |
| 37. | Farmington | 5.6% | 4.4%(+1.15)#37 | 4.1%(+1.46)#4,552 |
| 38. | Salina | 5.5% | 4.4%(+1.01)#38 | 4.1%(+1.32)#4,751 |
| 39. | Murray | 5.4% | 4.4%(+0.968)#39 | 4.1%(+1.28)#4,808 |
| 40. | Stansbury Park | 5.4% | 4.4%(+0.961)#40 | 4.1%(+1.27)#4,817 |
| 41. | Centerville | 5.3% | 4.4%(+0.903)#41 | 4.1%(+1.21)#4,906 |
| 42. | American Fork | 5.2% | 4.4%(+0.760)#42 | 4.1%(+1.07)#5,130 |
| 43. | Salt Lake City | 5.2% | 4.4%(+0.741)#43 | 4.1%(+1.05)#5,159 |
| 44. | Wendover | 5.2% | 4.4%(+0.726)#44 | 4.1%(+1.04)#5,172 |
| 45. | Sandy | 5.1% | 4.4%(+0.694)#45 | 4.1%(+1.01)#5,222 |
| 46. | Provo | 5.1% | 4.4%(+0.618)#46 | 4.1%(+0.929)#5,355 |
| 47. | Moab | 5.1% | 4.4%(+0.609)#47 | 4.1%(+0.920)#5,372 |
| 48. | Taylorsville | 5.1% | 4.4%(+0.607)#48 | 4.1%(+0.918)#5,376 |
| 49. | Holladay | 5.0% | 4.4%(+0.523)#49 | 4.1%(+0.835)#5,513 |
| 50. | Bountiful | 5.0% | 4.4%(+0.523)#50 | 4.1%(+0.834)#5,514 |
| 51. | White | 5.0% | 4.4%(+0.522)#51 | 4.1%(+0.833)#5,517 |
| 52. | Eagle Mountain | 5.0% | 4.4%(+0.512)#52 | 4.1%(+0.823)#5,538 |
| 53. | Vineyard | 4.9% | 4.4%(+0.504)#53 | 4.1%(+0.815)#5,549 |
| 54. | South Jordan | 4.9% | 4.4%(+0.501)#54 | 4.1%(+0.813)#5,553 |
| 55. | Hyde Park | 4.9% | 4.4%(+0.413)#55 | 4.1%(+0.724)#5,721 |
| 56. | Fairview | 4.8% | 4.4%(+0.385)#56 | 4.1%(+0.696)#5,772 |
| 57. | Toquerville | 4.8% | 4.4%(+0.364)#57 | 4.1%(+0.675)#5,811 |
| 58. | Moroni | 4.8% | 4.4%(+0.316)#58 | 4.1%(+0.627)#5,883 |
| 59. | Kanab | 4.7% | 4.4%(+0.301)#59 | 4.1%(+0.612)#5,935 |
| 60. | North Salt Lake | 4.7% | 4.4%(+0.225)#60 | 4.1%(+0.536)#6,070 |
| 61. | Cottonwood Heights | 4.7% | 4.4%(+0.224)#61 | 4.1%(+0.535)#6,072 |
| 62. | Woodland Hills | 4.7% | 4.4%(+0.216)#62 | 4.1%(+0.527)#6,086 |
| 63. | West Point | 4.7% | 4.4%(+0.207)#63 | 4.1%(+0.518)#6,105 |
| 64. | Nibley | 4.7% | 4.4%(+0.206)#64 | 4.1%(+0.518)#6,108 |
| 65. | Draper | 4.6% | 4.4%(+0.187)#65 | 4.1%(+0.498)#6,155 |
| 66. | Garland | 4.6% | 4.4%(+0.131)#66 | 4.1%(+0.442)#6,269 |
| 67. | Newton | 4.5% | 4.4%(+0.099)#67 | 4.1%(+0.410)#6,335 |
| 68. | West Jordan | 4.5% | 4.4%(+0.093)#68 | 4.1%(+0.404)#6,360 |
| 69. | Orem | 4.5% | 4.4%(+0.035)#69 | 4.1%(+0.346)#6,475 |
| 70. | Saratoga Springs | 4.5% | 4.4%(+0.029)#70 | 4.1%(+0.340)#6,501 |
| 71. | Riverton | 4.4% | 4.4%(-0.026)#71 | 4.1%(+0.286)#6,609 |
| 72. | Kaysville | 4.4% | 4.4%(-0.040)#72 | 4.1%(+0.271)#6,638 |
| 73. | Mona | 4.4% | 4.4%(-0.041)#73 | 4.1%(+0.270)#6,642 |
| 74. | Midway | 4.4% | 4.4%(-0.058)#74 | 4.1%(+0.253)#6,681 |
| 75. | Huntsville | 4.3% | 4.4%(-0.136)#75 | 4.1%(+0.175)#6,857 |
| 76. | South Ogden | 4.3% | 4.4%(-0.136)#76 | 4.1%(+0.175)#6,858 |
| 77. | Elk Ridge | 4.3% | 4.4%(-0.153)#77 | 4.1%(+0.158)#6,893 |
| 78. | Summit Park | 4.3% | 4.4%(-0.159)#78 | 4.1%(+0.153)#6,904 |
| 79. | Smithfield | 4.2% | 4.4%(-0.212)#79 | 4.1%(+0.099)#7,031 |
| 80. | West Valley City | 4.2% | 4.4%(-0.220)#80 | 4.1%(+0.091)#7,049 |
| 81. | Aurora | 4.2% | 4.4%(-0.244)#81 | 4.1%(+0.067)#7,108 |
| 82. | Ogden | 4.2% | 4.4%(-0.253)#82 | 4.1%(+0.058)#7,120 |
| 83. | Marriott Slaterville | 4.2% | 4.4%(-0.265)#83 | 4.1%(+0.046)#7,148 |
| 84. | Woods Cross | 4.2% | 4.4%(-0.291)#84 | 4.1%(+0.020)#7,221 |
| 85. | Hurricane | 4.1% | 4.4%(-0.303)#85 | 4.1%(+0.008)#7,247 |
| 86. | Thatcher | 4.1% | 4.4%(-0.353)#86 | 4.1%(-0.041)#7,366 |
| 87. | St George | 4.1% | 4.4%(-0.369)#87 | 4.1%(-0.058)#7,408 |
| 88. | Silver Summit | 4.1% | 4.4%(-0.372)#88 | 4.1%(-0.061)#7,416 |
| 89. | Blanding | 4.1% | 4.4%(-0.384)#89 | 4.1%(-0.073)#7,433 |
| 90. | Ephraim | 4.0% | 4.4%(-0.450)#90 | 4.1%(-0.139)#7,578 |
| 91. | Green River | 3.8% | 4.4%(-0.600)#91 | 4.1%(-0.289)#7,930 |
| 92. | Santa Clara | 3.8% | 4.4%(-0.623)#92 | 4.1%(-0.312)#7,982 |
| 93. | Mendon | 3.8% | 4.4%(-0.626)#93 | 4.1%(-0.315)#7,988 |
| 94. | Springville | 3.8% | 4.4%(-0.639)#94 | 4.1%(-0.328)#8,012 |
| 95. | Morgan | 3.8% | 4.4%(-0.675)#95 | 4.1%(-0.364)#8,097 |
| 96. | North Ogden | 3.7% | 4.4%(-0.728)#96 | 4.1%(-0.416)#8,203 |
| 97. | Fruit Heights | 3.7% | 4.4%(-0.735)#97 | 4.1%(-0.424)#8,215 |
| 98. | Pleasant View | 3.7% | 4.4%(-0.744)#98 | 4.1%(-0.433)#8,248 |
| 99. | River Heights | 3.6% | 4.4%(-0.826)#99 | 4.1%(-0.515)#8,429 |
| 100. | Cedar Hills | 3.6% | 4.4%(-0.836)#100 | 4.1%(-0.525)#8,460 |
Common Questions
What are the Top 10 Cities with the Highest Percentage of Population with a Degree in Communications in Utah?
Top 10 Cities with the Highest Percentage of Population with a Degree in Communications in Utah are:
#1
46.9%
#2
23.5%
#3
17.1%
#4
14.3%
#5
13.8%
#6
9.7%
#7
9.0%
#8
8.5%
#9
8.5%
#10
8.5%
What city has the Highest Percentage of Population with a Degree in Communications in Utah?
Bryce Canyon City has the Highest Percentage of Population with a Degree in Communications in Utah with 46.9%.
What is the Percentage of Population with a Degree in Communications in the State of Utah?
Percentage of Population with a Degree in Communications in Utah is 4.4%.
What is the Percentage of Population with a Degree in Communications in the United States?
Percentage of Population with a Degree in Communications in the United States is 4.1%.