Zip Codes with the Highest Percentage of Population with a Degree in Communications in San Diego, CA
RELATED REPORTS & OPTIONS
Communications
San Diego
Compare Zip Codes
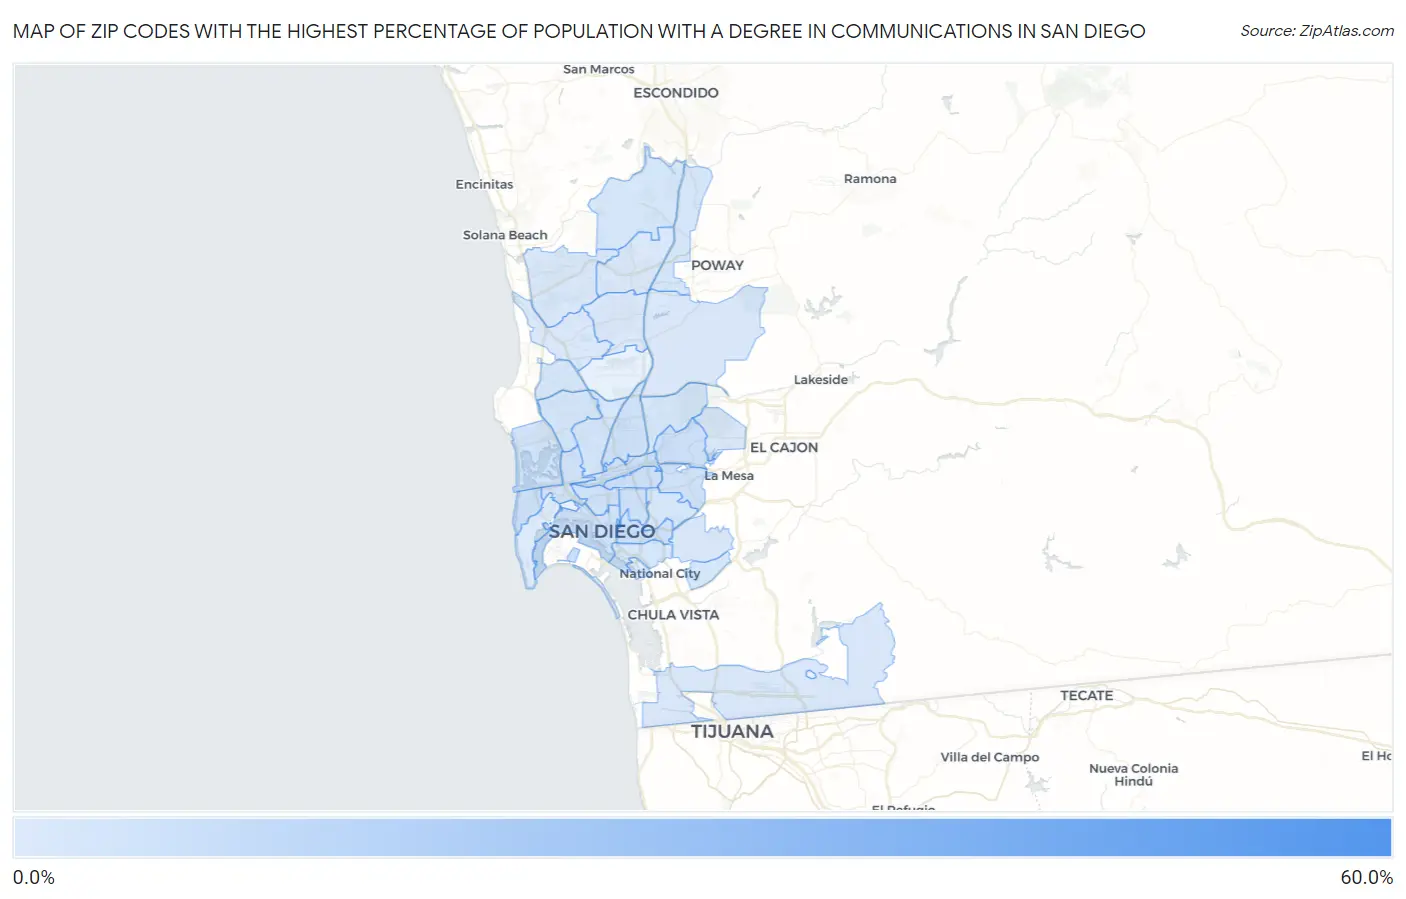
Map of Zip Codes with the Highest Percentage of Population with a Degree in Communications in San Diego
1.7%
55.6%
Zip Codes with the Highest Percentage of Population with a Degree in Communications in San Diego, CA
| Zip Code | % Graduates | vs State | vs National | |
| 1. | 92147 | 55.6% | 4.6%(+50.9)#4 | 4.1%(+51.4)#38 |
| 2. | 92135 | 7.1% | 4.6%(+2.52)#175 | 4.1%(+3.01)#2,482 |
| 3. | 92116 | 6.9% | 4.6%(+2.26)#193 | 4.1%(+2.75)#2,708 |
| 4. | 92120 | 6.8% | 4.6%(+2.16)#203 | 4.1%(+2.65)#2,801 |
| 5. | 92107 | 6.4% | 4.6%(+1.76)#251 | 4.1%(+2.25)#3,259 |
| 6. | 92108 | 6.2% | 4.6%(+1.58)#272 | 4.1%(+2.07)#3,480 |
| 7. | 92104 | 5.8% | 4.6%(+1.17)#326 | 4.1%(+1.66)#4,116 |
| 8. | 92115 | 5.6% | 4.6%(+0.979)#357 | 4.1%(+1.47)#4,442 |
| 9. | 92123 | 5.6% | 4.6%(+0.959)#358 | 4.1%(+1.45)#4,478 |
| 10. | 92102 | 5.6% | 4.6%(+0.943)#362 | 4.1%(+1.43)#4,514 |
| 11. | 92103 | 5.6% | 4.6%(+0.932)#364 | 4.1%(+1.42)#4,534 |
| 12. | 92110 | 5.1% | 4.6%(+0.489)#417 | 4.1%(+0.979)#5,425 |
| 13. | 92101 | 4.9% | 4.6%(+0.226)#474 | 4.1%(+0.717)#6,063 |
| 14. | 92109 | 4.8% | 4.6%(+0.182)#481 | 4.1%(+0.673)#6,170 |
| 15. | 92117 | 4.8% | 4.6%(+0.129)#490 | 4.1%(+0.619)#6,296 |
| 16. | 92111 | 4.7% | 4.6%(+0.025)#508 | 4.1%(+0.516)#6,550 |
| 17. | 92139 | 4.1% | 4.6%(-0.568)#641 | 4.1%(-0.078)#8,387 |
| 18. | 92113 | 3.8% | 4.6%(-0.829)#721 | 4.1%(-0.338)#9,295 |
| 19. | 92127 | 3.7% | 4.6%(-0.889)#740 | 4.1%(-0.398)#9,502 |
| 20. | 92105 | 3.7% | 4.6%(-0.902)#742 | 4.1%(-0.411)#9,539 |
| 21. | 92122 | 3.7% | 4.6%(-0.932)#750 | 4.1%(-0.442)#9,656 |
| 22. | 92124 | 3.7% | 4.6%(-0.971)#764 | 4.1%(-0.480)#9,795 |
| 23. | 92128 | 3.5% | 4.6%(-1.14)#812 | 4.1%(-0.652)#10,391 |
| 24. | 92119 | 3.4% | 4.6%(-1.22)#840 | 4.1%(-0.734)#10,698 |
| 25. | 92154 | 3.3% | 4.6%(-1.28)#853 | 4.1%(-0.786)#10,881 |
| 26. | 92114 | 3.2% | 4.6%(-1.38)#880 | 4.1%(-0.890)#11,280 |
| 27. | 92131 | 3.2% | 4.6%(-1.38)#881 | 4.1%(-0.891)#11,285 |
| 28. | 92130 | 2.7% | 4.6%(-1.88)#1,014 | 4.1%(-1.39)#13,230 |
| 29. | 92129 | 2.7% | 4.6%(-1.97)#1,034 | 4.1%(-1.48)#13,571 |
| 30. | 92126 | 2.6% | 4.6%(-2.04)#1,047 | 4.1%(-1.55)#13,823 |
| 31. | 92121 | 2.2% | 4.6%(-2.47)#1,120 | 4.1%(-1.98)#15,325 |
| 32. | 92106 | 1.9% | 4.6%(-2.72)#1,171 | 4.1%(-2.22)#16,201 |
| 33. | 92136 | 1.7% | 4.6%(-2.89)#1,193 | 4.1%(-2.40)#16,786 |
1
Common Questions
What are the Top 10 Zip Codes with the Highest Percentage of Population with a Degree in Communications in San Diego, CA?
Top 10 Zip Codes with the Highest Percentage of Population with a Degree in Communications in San Diego, CA are:
What zip code has the Highest Percentage of Population with a Degree in Communications in San Diego, CA?
92147 has the Highest Percentage of Population with a Degree in Communications in San Diego, CA with 55.6%.
What is the Percentage of Population with a Degree in Communications in San Diego, CA?
Percentage of Population with a Degree in Communications in San Diego is 4.3%.
What is the Percentage of Population with a Degree in Communications in California?
Percentage of Population with a Degree in Communications in California is 4.6%.
What is the Percentage of Population with a Degree in Communications in the United States?
Percentage of Population with a Degree in Communications in the United States is 4.1%.