Cities with the Highest Percentage of Immigrants from Guatemala in Texas
RELATED REPORTS & OPTIONS
Guatemala
Texas
Compare Cities
Map of Cities with the Highest Percentage of Immigrants from Guatemala in Texas
0.00%
20.00%
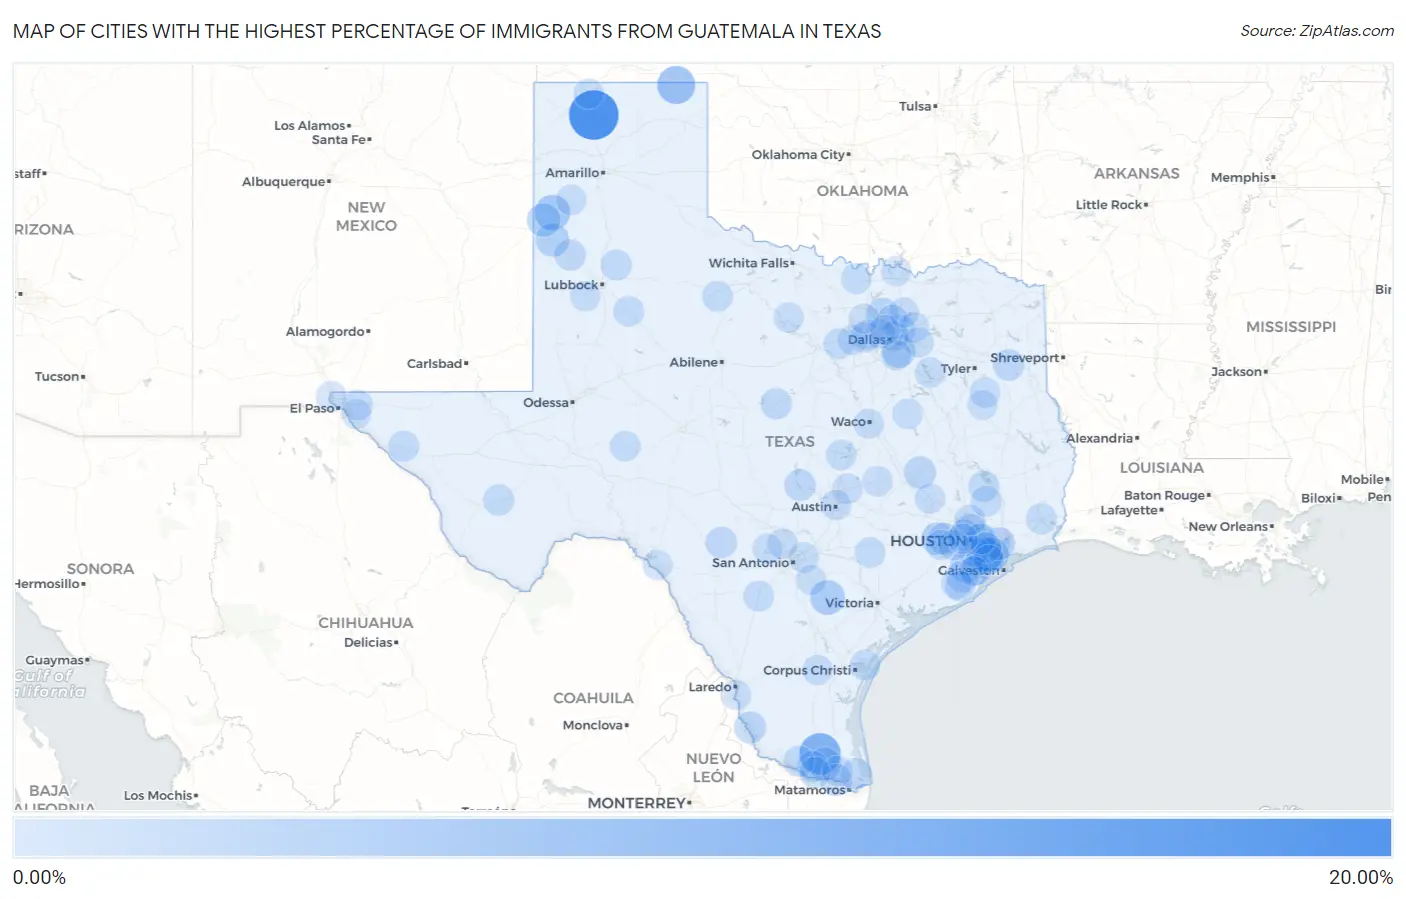
Cities with the Highest Percentage of Immigrants from Guatemala in Texas
| City | Guatemala | vs State | vs National | |
| 1. | Cactus | 16.73% | 0.30%(+16.4)#-1 | 0.32%(+16.4)#0 |
| 2. | Acala | 16.13% | 0.30%(+15.8)#0 | 0.32%(+15.8)#1 |
| 3. | Hargill | 9.55% | 0.30%(+9.25)#1 | 0.32%(+9.23)#2 |
| 4. | Booker | 6.80% | 0.30%(+6.50)#2 | 0.32%(+6.48)#3 |
| 5. | Webster | 5.03% | 0.30%(+4.73)#3 | 0.32%(+4.71)#4 |
| 6. | Friona | 4.63% | 0.30%(+4.33)#4 | 0.32%(+4.31)#5 |
| 7. | Kemah | 4.22% | 0.30%(+3.92)#33 | 0.32%(+3.90)#1,439 |
| 8. | Karnes City | 4.01% | 0.30%(+3.72)#50 | 0.32%(+3.70)#1,778 |
| 9. | Muleshoe | 3.05% | 0.30%(+2.75)#51 | 0.32%(+2.73)#1,779 |
| 10. | Bovina | 2.99% | 0.30%(+2.69)#52 | 0.32%(+2.67)#1,780 |
| 11. | Wilmer | 2.79% | 0.30%(+2.49)#53 | 0.32%(+2.48)#1,781 |
| 12. | Nassau Bay | 2.70% | 0.30%(+2.40)#54 | 0.32%(+2.39)#1,782 |
| 13. | La Villa | 2.47% | 0.30%(+2.17)#55 | 0.32%(+2.15)#1,783 |
| 14. | Beach City | 2.40% | 0.30%(+2.10)#56 | 0.32%(+2.08)#1,784 |
| 15. | Brookshire | 2.37% | 0.30%(+2.07)#57 | 0.32%(+2.05)#1,785 |
| 16. | Rosharon | 2.19% | 0.30%(+1.89)#58 | 0.32%(+1.87)#1,786 |
| 17. | Kurten | 2.09% | 0.30%(+1.79)#59 | 0.32%(+1.77)#1,787 |
| 18. | Aldine | 1.87% | 0.30%(+1.57)#60 | 0.32%(+1.55)#1,788 |
| 19. | Hackberry | 1.85% | 0.30%(+1.55)#61 | 0.32%(+1.53)#1,789 |
| 20. | Holiday Lakes | 1.80% | 0.30%(+1.50)#62 | 0.32%(+1.48)#1,790 |
| 21. | Jacinto City | 1.76% | 0.30%(+1.46)#63 | 0.32%(+1.44)#1,791 |
| 22. | Siesta Shores | 1.73% | 0.30%(+1.43)#64 | 0.32%(+1.41)#1,792 |
| 23. | Los Indios | 1.68% | 0.30%(+1.38)#65 | 0.32%(+1.36)#1,793 |
| 24. | Katy | 1.67% | 0.30%(+1.37)#66 | 0.32%(+1.36)#1,794 |
| 25. | Granite Shoals | 1.53% | 0.30%(+1.23)#67 | 0.32%(+1.21)#1,795 |
| 26. | Leakey | 1.51% | 0.30%(+1.21)#68 | 0.32%(+1.19)#1,796 |
| 27. | Lakeport | 1.46% | 0.30%(+1.16)#69 | 0.32%(+1.14)#1,797 |
| 28. | Amherst | 1.38% | 0.30%(+1.08)#70 | 0.32%(+1.06)#1,798 |
| 29. | Houston | 1.33% | 0.30%(+1.03)#72 | 0.32%(+1.01)#2,034 |
| 30. | Blanket | 1.29% | 0.30%(+0.990)#73 | 0.32%(+0.971)#2,035 |
| 31. | Alpine | 1.20% | 0.30%(+0.902)#74 | 0.32%(+0.883)#2,036 |
| 32. | Lopezville | 1.19% | 0.30%(+0.894)#75 | 0.32%(+0.875)#2,037 |
| 33. | Bayview | 1.15% | 0.30%(+0.849)#76 | 0.32%(+0.830)#2,038 |
| 34. | Coldspring | 1.15% | 0.30%(+0.848)#77 | 0.32%(+0.829)#2,039 |
| 35. | Sierra Blanca | 1.10% | 0.30%(+0.804)#78 | 0.32%(+0.785)#2,040 |
| 36. | Petersburg | 1.09% | 0.30%(+0.789)#79 | 0.32%(+0.771)#2,041 |
| 37. | Citrus City | 1.06% | 0.30%(+0.763)#80 | 0.32%(+0.744)#2,042 |
| 38. | South Alamo | 1.05% | 0.30%(+0.750)#81 | 0.32%(+0.731)#2,043 |
| 39. | North Cleveland | 0.97% | 0.30%(+0.672)#82 | 0.32%(+0.653)#2,044 |
| 40. | Brookside Village | 0.96% | 0.30%(+0.659)#83 | 0.32%(+0.640)#2,045 |
| 41. | Beaumont | 0.93% | 0.30%(+0.631)#114 | 0.32%(+0.612)#2,766 |
| 42. | Ingleside On The Bay | 0.90% | 0.30%(+0.603)#115 | 0.32%(+0.584)#2,767 |
| 43. | Garland | 0.90% | 0.30%(+0.599)#116 | 0.32%(+0.581)#2,768 |
| 44. | Cloverleaf | 0.89% | 0.30%(+0.595)#117 | 0.32%(+0.576)#2,769 |
| 45. | Annetta North | 0.88% | 0.30%(+0.585)#118 | 0.32%(+0.566)#2,770 |
| 46. | Liverpool | 0.84% | 0.30%(+0.542)#119 | 0.32%(+0.523)#2,771 |
| 47. | Post | 0.82% | 0.30%(+0.522)#120 | 0.32%(+0.503)#2,772 |
| 48. | Plano | 0.81% | 0.30%(+0.512)#121 | 0.32%(+0.493)#2,773 |
| 49. | Moulton | 0.81% | 0.30%(+0.508)#122 | 0.32%(+0.489)#2,774 |
| 50. | Spring | 0.79% | 0.30%(+0.496)#123 | 0.32%(+0.477)#2,775 |
| 51. | Pearsall | 0.79% | 0.30%(+0.490)#124 | 0.32%(+0.471)#2,776 |
| 52. | Knox City | 0.78% | 0.30%(+0.481)#125 | 0.32%(+0.462)#2,777 |
| 53. | Homestead Meadows South | 0.78% | 0.30%(+0.477)#126 | 0.32%(+0.458)#2,778 |
| 54. | Belterra | 0.75% | 0.30%(+0.450)#127 | 0.32%(+0.431)#2,779 |
| 55. | Muenster | 0.75% | 0.30%(+0.450)#128 | 0.32%(+0.431)#2,780 |
| 56. | New Summerfield | 0.75% | 0.30%(+0.450)#129 | 0.32%(+0.431)#2,781 |
| 57. | Fate | 0.75% | 0.30%(+0.448)#130 | 0.32%(+0.429)#2,782 |
| 58. | Mission Bend | 0.74% | 0.30%(+0.444)#131 | 0.32%(+0.425)#2,783 |
| 59. | Pasadena | 0.73% | 0.30%(+0.427)#132 | 0.32%(+0.408)#2,784 |
| 60. | Harker Heights | 0.72% | 0.30%(+0.422)#133 | 0.32%(+0.403)#2,785 |
| 61. | Big Lake | 0.71% | 0.30%(+0.407)#134 | 0.32%(+0.388)#2,786 |
| 62. | Rockdale | 0.68% | 0.30%(+0.383)#135 | 0.32%(+0.364)#2,787 |
| 63. | Fulshear | 0.67% | 0.30%(+0.374)#136 | 0.32%(+0.355)#2,788 |
| 64. | Payne Springs | 0.65% | 0.30%(+0.354)#137 | 0.32%(+0.335)#2,789 |
| 65. | Mexia | 0.64% | 0.30%(+0.338)#138 | 0.32%(+0.319)#2,790 |
| 66. | Hurst | 0.62% | 0.30%(+0.320)#139 | 0.32%(+0.301)#2,791 |
| 67. | Harlingen | 0.61% | 0.30%(+0.315)#140 | 0.32%(+0.296)#2,792 |
| 68. | Wild Peach Village | 0.60% | 0.30%(+0.303)#141 | 0.32%(+0.284)#2,793 |
| 69. | Hutto | 0.60% | 0.30%(+0.298)#142 | 0.32%(+0.279)#2,794 |
| 70. | Canutillo | 0.59% | 0.30%(+0.289)#143 | 0.32%(+0.271)#2,795 |
| 71. | Converse | 0.57% | 0.30%(+0.272)#144 | 0.32%(+0.253)#2,796 |
| 72. | Hereford | 0.55% | 0.30%(+0.250)#145 | 0.32%(+0.231)#2,797 |
| 73. | Dallas | 0.54% | 0.30%(+0.245)#146 | 0.32%(+0.226)#2,798 |
| 74. | Austin | 0.53% | 0.30%(+0.236)#147 | 0.32%(+0.217)#2,799 |
| 75. | Lowry Crossing | 0.53% | 0.30%(+0.232)#148 | 0.32%(+0.213)#2,800 |
| 76. | Ropesville | 0.53% | 0.30%(+0.228)#149 | 0.32%(+0.209)#2,801 |
| 77. | Terrell | 0.51% | 0.30%(+0.212)#150 | 0.32%(+0.193)#2,802 |
| 78. | Scenic Oaks | 0.51% | 0.30%(+0.208)#151 | 0.32%(+0.189)#2,803 |
| 79. | Dickinson | 0.49% | 0.30%(+0.195)#152 | 0.32%(+0.176)#2,804 |
| 80. | Stratford | 0.48% | 0.30%(+0.181)#153 | 0.32%(+0.162)#2,805 |
| 81. | Lakehills | 0.45% | 0.30%(+0.155)#154 | 0.32%(+0.136)#2,806 |
| 82. | Richland Hills | 0.45% | 0.30%(+0.148)#155 | 0.32%(+0.129)#2,807 |
| 83. | Navasota | 0.43% | 0.30%(+0.135)#156 | 0.32%(+0.116)#2,808 |
| 84. | Hedwig Village | 0.43% | 0.30%(+0.132)#157 | 0.32%(+0.113)#2,809 |
| 85. | Ferris | 0.43% | 0.30%(+0.132)#158 | 0.32%(+0.113)#2,810 |
| 86. | Alice | 0.43% | 0.30%(+0.131)#159 | 0.32%(+0.112)#2,811 |
| 87. | Alvin | 0.42% | 0.30%(+0.126)#160 | 0.32%(+0.107)#2,812 |
| 88. | Graham | 0.42% | 0.30%(+0.125)#161 | 0.32%(+0.106)#2,813 |
| 89. | Beverly Hills | 0.42% | 0.30%(+0.121)#162 | 0.32%(+0.102)#2,814 |
| 90. | Irving | 0.42% | 0.30%(+0.118)#163 | 0.32%(+0.099)#2,815 |
| 91. | Del Rio | 0.41% | 0.30%(+0.116)#164 | 0.32%(+0.097)#2,816 |
| 92. | Horizon City | 0.41% | 0.30%(+0.114)#165 | 0.32%(+0.095)#2,817 |
| 93. | White Settlement | 0.40% | 0.30%(+0.099)#166 | 0.32%(+0.080)#2,818 |
| 94. | Pottsboro | 0.39% | 0.30%(+0.096)#167 | 0.32%(+0.077)#2,819 |
| 95. | Floresville | 0.39% | 0.30%(+0.091)#168 | 0.32%(+0.072)#2,820 |
| 96. | Farmers Branch | 0.39% | 0.30%(+0.090)#169 | 0.32%(+0.071)#2,821 |
| 97. | Northlake | 0.39% | 0.30%(+0.088)#170 | 0.32%(+0.069)#2,822 |
| 98. | Rio Bravo | 0.38% | 0.30%(+0.084)#171 | 0.32%(+0.065)#2,823 |
| 99. | Brazoria | 0.38% | 0.30%(+0.084)#172 | 0.32%(+0.065)#2,824 |
| 100. | Rusk | 0.36% | 0.30%(+0.057)#173 | 0.32%(+0.038)#2,825 |
Common Questions
What are the Top 10 Cities with the Highest Percentage of Immigrants from Guatemala in Texas?
Top 10 Cities with the Highest Percentage of Immigrants from Guatemala in Texas are:
What city has the Highest Percentage of Immigrants from Guatemala in Texas?
Cactus has the Highest Percentage of Immigrants from Guatemala in Texas with 16.73%.
What is the Percentage of Immigrants from Guatemala in the State of Texas?
Percentage of Immigrants from Guatemala in Texas is 0.30%.
What is the Percentage of Immigrants from Guatemala in the United States?
Percentage of Immigrants from Guatemala in the United States is 0.32%.