Cities with the Highest Percentage of Immigrants from Guatemala in New York
RELATED REPORTS & OPTIONS
Guatemala
New York
Compare Cities
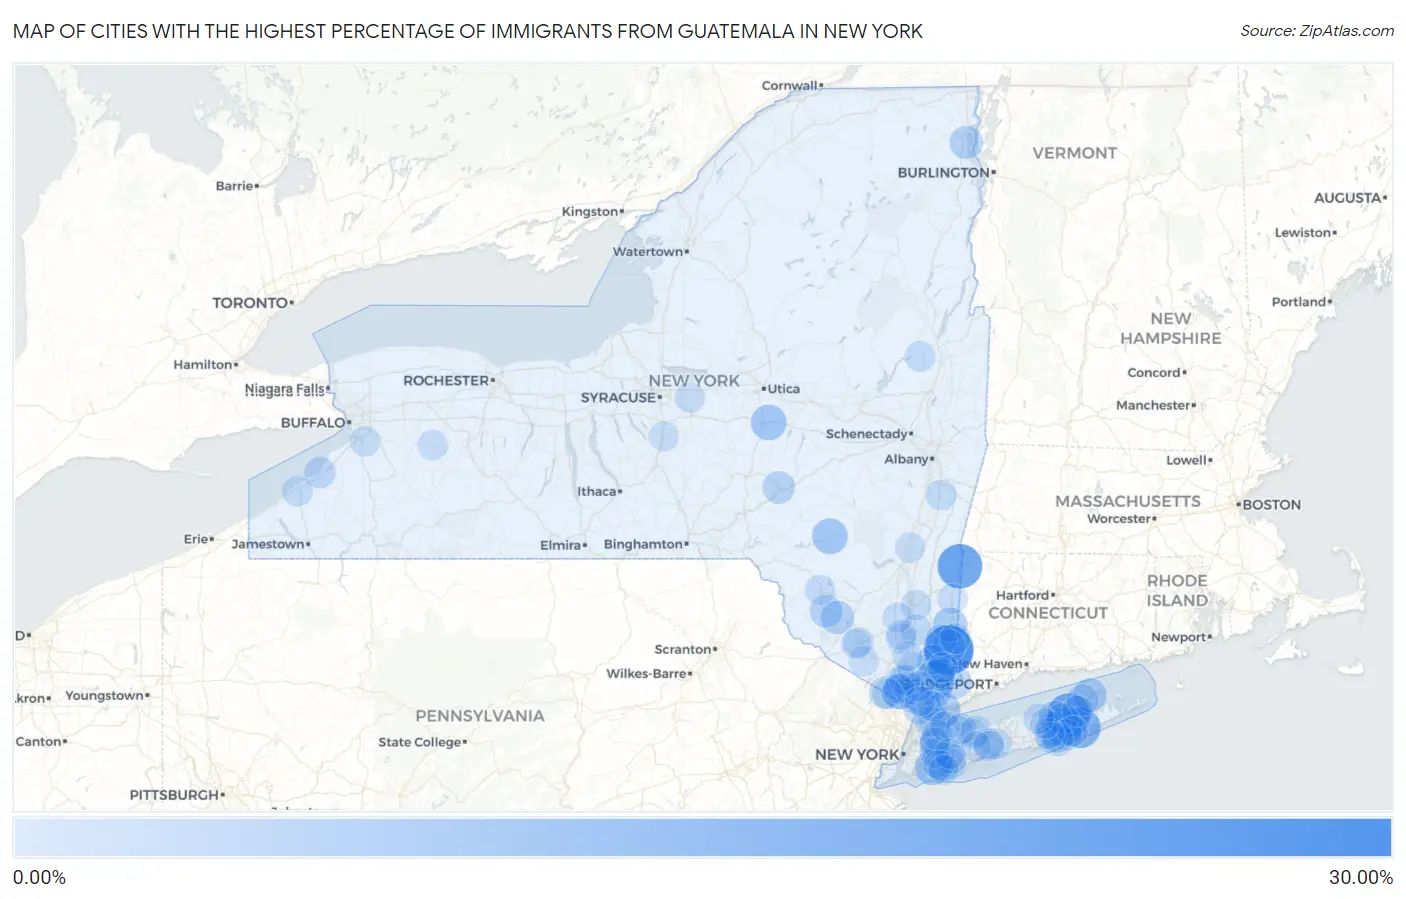
Map of Cities with the Highest Percentage of Immigrants from Guatemala in New York
0.00%
30.00%
Cities with the Highest Percentage of Immigrants from Guatemala in New York
| City | Guatemala | vs State | vs National | |
| 1. | Brewster | 25.70% | 0.31%(+25.4)#-1 | 0.32%(+25.4)#0 |
| 2. | Millerton | 19.14% | 0.31%(+18.8)#0 | 0.32%(+18.8)#1 |
| 3. | Laurel | 17.65% | 0.31%(+17.3)#1 | 0.32%(+17.3)#2 |
| 4. | Shinnecock Hills | 14.71% | 0.31%(+14.4)#2 | 0.32%(+14.4)#3 |
| 5. | Mount Kisco | 11.67% | 0.31%(+11.4)#169 | 0.32%(+11.3)#1,117 |
| 6. | Flanders | 10.98% | 0.31%(+10.7)#170 | 0.32%(+10.7)#1,118 |
| 7. | Port Chester | 7.85% | 0.31%(+7.55)#171 | 0.32%(+7.54)#1,119 |
| 8. | West Winfield | 7.83% | 0.31%(+7.52)#172 | 0.32%(+7.51)#1,120 |
| 9. | Margaretville | 7.62% | 0.31%(+7.32)#173 | 0.32%(+7.30)#1,121 |
| 10. | Inwood | 7.52% | 0.31%(+7.21)#174 | 0.32%(+7.20)#1,122 |
| 11. | Hillcrest | 7.23% | 0.31%(+6.92)#175 | 0.32%(+6.91)#1,123 |
| 12. | Pawling | 6.28% | 0.31%(+5.98)#190 | 0.32%(+5.97)#1,291 |
| 13. | Northampton | 6.05% | 0.31%(+5.74)#191 | 0.32%(+5.73)#1,292 |
| 14. | Greenport | 5.25% | 0.31%(+4.95)#192 | 0.32%(+4.94)#1,293 |
| 15. | Brewster Heights | 4.91% | 0.31%(+4.61)#193 | 0.32%(+4.60)#1,294 |
| 16. | Rock Hill | 4.82% | 0.31%(+4.52)#194 | 0.32%(+4.51)#1,295 |
| 17. | Brewster Hill | 4.79% | 0.31%(+4.48)#195 | 0.32%(+4.47)#1,296 |
| 18. | Parc | 4.68% | 0.31%(+4.37)#196 | 0.32%(+4.36)#1,297 |
| 19. | Scotts Corners | 4.68% | 0.31%(+4.37)#197 | 0.32%(+4.36)#1,298 |
| 20. | Shenorock | 4.62% | 0.31%(+4.31)#198 | 0.32%(+4.30)#1,299 |
| 21. | Spring Valley | 4.58% | 0.31%(+4.27)#199 | 0.32%(+4.26)#1,300 |
| 22. | Riverhead | 4.29% | 0.31%(+3.98)#200 | 0.32%(+3.97)#1,301 |
| 23. | Monticello | 3.96% | 0.31%(+3.65)#201 | 0.32%(+3.64)#1,302 |
| 24. | West End | 3.83% | 0.31%(+3.52)#202 | 0.32%(+3.51)#1,303 |
| 25. | Hillburn | 3.18% | 0.31%(+2.88)#203 | 0.32%(+2.87)#1,304 |
| 26. | Bedford Hills | 2.95% | 0.31%(+2.65)#204 | 0.32%(+2.63)#1,305 |
| 27. | Southold | 2.85% | 0.31%(+2.54)#205 | 0.32%(+2.53)#1,306 |
| 28. | Westhampton Beach | 2.77% | 0.31%(+2.47)#206 | 0.32%(+2.46)#1,307 |
| 29. | Mamaroneck | 2.77% | 0.31%(+2.46)#207 | 0.32%(+2.45)#1,334 |
| 30. | Armonk | 2.74% | 0.31%(+2.43)#208 | 0.32%(+2.42)#1,335 |
| 31. | Nyack | 2.62% | 0.31%(+2.32)#209 | 0.32%(+2.30)#1,336 |
| 32. | Sunset Bay | 2.46% | 0.31%(+2.15)#210 | 0.32%(+2.14)#1,337 |
| 33. | Aquebogue | 2.37% | 0.31%(+2.07)#211 | 0.32%(+2.06)#1,338 |
| 34. | South Floral Park | 2.33% | 0.31%(+2.03)#212 | 0.32%(+2.02)#1,339 |
| 35. | Mount Ivy | 2.21% | 0.31%(+1.91)#213 | 0.32%(+1.89)#1,340 |
| 36. | Elmsford | 2.16% | 0.31%(+1.85)#214 | 0.32%(+1.84)#1,341 |
| 37. | Fishkill | 2.11% | 0.31%(+1.81)#215 | 0.32%(+1.80)#1,368 |
| 38. | Greenlawn | 2.11% | 0.31%(+1.80)#216 | 0.32%(+1.79)#1,369 |
| 39. | Congers | 2.07% | 0.31%(+1.76)#217 | 0.32%(+1.75)#1,370 |
| 40. | East Quogue | 2.06% | 0.31%(+1.76)#218 | 0.32%(+1.75)#1,371 |
| 41. | Oyster Bay | 2.06% | 0.31%(+1.76)#219 | 0.32%(+1.75)#1,372 |
| 42. | Lake Carmel | 2.03% | 0.31%(+1.72)#220 | 0.32%(+1.71)#1,373 |
| 43. | New Suffolk | 1.97% | 0.31%(+1.66)#221 | 0.32%(+1.65)#1,374 |
| 44. | Peekskill | 1.89% | 0.31%(+1.58)#222 | 0.32%(+1.57)#1,375 |
| 45. | South Valley Stream | 1.78% | 0.31%(+1.47)#223 | 0.32%(+1.46)#1,376 |
| 46. | University Gardens | 1.73% | 0.31%(+1.42)#224 | 0.32%(+1.41)#1,377 |
| 47. | Wingdale | 1.63% | 0.31%(+1.32)#225 | 0.32%(+1.31)#1,378 |
| 48. | Dobbs Ferry | 1.57% | 0.31%(+1.27)#279 | 0.32%(+1.26)#2,057 |
| 49. | Remsenburg Speonk | 1.56% | 0.31%(+1.25)#280 | 0.32%(+1.24)#2,058 |
| 50. | New Rochelle | 1.56% | 0.31%(+1.25)#281 | 0.32%(+1.24)#2,059 |
| 51. | West Haverstraw | 1.52% | 0.31%(+1.21)#282 | 0.32%(+1.20)#2,060 |
| 52. | Hempstead | 1.52% | 0.31%(+1.21)#283 | 0.32%(+1.20)#2,061 |
| 53. | Freeport | 1.51% | 0.31%(+1.20)#284 | 0.32%(+1.19)#2,062 |
| 54. | Suffern | 1.50% | 0.31%(+1.20)#285 | 0.32%(+1.19)#2,063 |
| 55. | Hadley | 1.49% | 0.31%(+1.19)#286 | 0.32%(+1.17)#2,064 |
| 56. | Valatie | 1.44% | 0.31%(+1.13)#287 | 0.32%(+1.12)#2,065 |
| 57. | Putnam Lake | 1.44% | 0.31%(+1.13)#288 | 0.32%(+1.12)#2,066 |
| 58. | Fredonia | 1.43% | 0.31%(+1.13)#289 | 0.32%(+1.11)#2,067 |
| 59. | Central Islip | 1.43% | 0.31%(+1.12)#290 | 0.32%(+1.11)#2,068 |
| 60. | Westhampton | 1.41% | 0.31%(+1.10)#291 | 0.32%(+1.09)#2,069 |
| 61. | Hampton Bays | 1.39% | 0.31%(+1.09)#292 | 0.32%(+1.08)#2,070 |
| 62. | Huntington Station | 1.38% | 0.31%(+1.07)#293 | 0.32%(+1.06)#2,071 |
| 63. | Eastport | 1.31% | 0.31%(+1.00)#294 | 0.32%(+0.993)#2,072 |
| 64. | Bay Park | 1.30% | 0.31%(+0.990)#295 | 0.32%(+0.978)#2,073 |
| 65. | Wading River | 1.28% | 0.31%(+0.978)#296 | 0.32%(+0.966)#2,074 |
| 66. | Brentwood | 1.28% | 0.31%(+0.970)#297 | 0.32%(+0.958)#2,075 |
| 67. | Great Neck | 1.27% | 0.31%(+0.969)#298 | 0.32%(+0.957)#2,076 |
| 68. | Katonah | 1.27% | 0.31%(+0.962)#299 | 0.32%(+0.950)#2,077 |
| 69. | Roosevelt | 1.25% | 0.31%(+0.947)#300 | 0.32%(+0.935)#2,078 |
| 70. | Arlington | 1.25% | 0.31%(+0.941)#301 | 0.32%(+0.930)#2,079 |
| 71. | North Bay Shore | 1.22% | 0.31%(+0.917)#302 | 0.32%(+0.906)#2,080 |
| 72. | Liberty | 1.21% | 0.31%(+0.906)#303 | 0.32%(+0.895)#2,081 |
| 73. | Orchard Park | 1.20% | 0.31%(+0.893)#304 | 0.32%(+0.882)#2,082 |
| 74. | Cove Neck | 1.18% | 0.31%(+0.870)#305 | 0.32%(+0.859)#2,083 |
| 75. | Manorhaven | 1.17% | 0.31%(+0.863)#306 | 0.32%(+0.851)#2,084 |
| 76. | White Plains | 1.14% | 0.31%(+0.838)#307 | 0.32%(+0.827)#2,085 |
| 77. | Bellerose Terrace | 1.12% | 0.31%(+0.818)#308 | 0.32%(+0.806)#2,086 |
| 78. | Dover Plains | 1.04% | 0.31%(+0.734)#309 | 0.32%(+0.722)#2,087 |
| 79. | New Windsor | 1.01% | 0.31%(+0.706)#310 | 0.32%(+0.695)#2,088 |
| 80. | Mechanicstown | 1.01% | 0.31%(+0.703)#311 | 0.32%(+0.692)#2,089 |
| 81. | Florida | 0.99% | 0.31%(+0.681)#312 | 0.32%(+0.670)#2,090 |
| 82. | Golden S Bridge | 0.96% | 0.31%(+0.658)#313 | 0.32%(+0.646)#2,091 |
| 83. | Saugerties | 0.92% | 0.31%(+0.619)#314 | 0.32%(+0.607)#2,092 |
| 84. | Chittenango | 0.90% | 0.31%(+0.595)#315 | 0.32%(+0.583)#2,093 |
| 85. | Ossining | 0.88% | 0.31%(+0.573)#316 | 0.32%(+0.561)#2,094 |
| 86. | Great Neck Plaza | 0.87% | 0.31%(+0.567)#317 | 0.32%(+0.556)#2,095 |
| 87. | Hewlett | 0.87% | 0.31%(+0.563)#318 | 0.32%(+0.552)#2,096 |
| 88. | Highland Falls | 0.86% | 0.31%(+0.554)#319 | 0.32%(+0.542)#2,097 |
| 89. | Warsaw | 0.85% | 0.31%(+0.545)#320 | 0.32%(+0.533)#2,098 |
| 90. | Uniondale | 0.84% | 0.31%(+0.534)#321 | 0.32%(+0.523)#2,099 |
| 91. | New Hempstead | 0.83% | 0.31%(+0.520)#322 | 0.32%(+0.508)#2,100 |
| 92. | Wheatley Heights | 0.82% | 0.31%(+0.518)#323 | 0.32%(+0.507)#2,101 |
| 93. | Tully | 0.81% | 0.31%(+0.506)#324 | 0.32%(+0.494)#2,102 |
| 94. | Newburgh | 0.79% | 0.31%(+0.483)#325 | 0.32%(+0.472)#2,103 |
| 95. | Middletown | 0.78% | 0.31%(+0.469)#326 | 0.32%(+0.458)#2,104 |
| 96. | Tarrytown | 0.76% | 0.31%(+0.458)#327 | 0.32%(+0.447)#2,175 |
| 97. | Island Park | 0.75% | 0.31%(+0.442)#328 | 0.32%(+0.430)#2,176 |
| 98. | Plattekill | 0.71% | 0.31%(+0.403)#329 | 0.32%(+0.391)#2,177 |
| 99. | Glen Cove | 0.71% | 0.31%(+0.401)#330 | 0.32%(+0.390)#2,178 |
| 100. | Calverton | 0.69% | 0.31%(+0.382)#331 | 0.32%(+0.371)#2,179 |
Common Questions
What are the Top 10 Cities with the Highest Percentage of Immigrants from Guatemala in New York?
Top 10 Cities with the Highest Percentage of Immigrants from Guatemala in New York are:
#1
25.70%
#2
19.14%
#3
17.65%
#4
14.71%
#5
11.67%
#6
10.98%
#7
7.85%
#8
7.83%
#9
7.62%
#10
7.52%
What city has the Highest Percentage of Immigrants from Guatemala in New York?
Brewster has the Highest Percentage of Immigrants from Guatemala in New York with 25.70%.
What is the Percentage of Immigrants from Guatemala in the State of New York?
Percentage of Immigrants from Guatemala in New York is 0.31%.
What is the Percentage of Immigrants from Guatemala in the United States?
Percentage of Immigrants from Guatemala in the United States is 0.32%.