Cities with the Highest Percentage of Immigrants from Guatemala in Pennsylvania
RELATED REPORTS & OPTIONS
Guatemala
Pennsylvania
Compare Cities
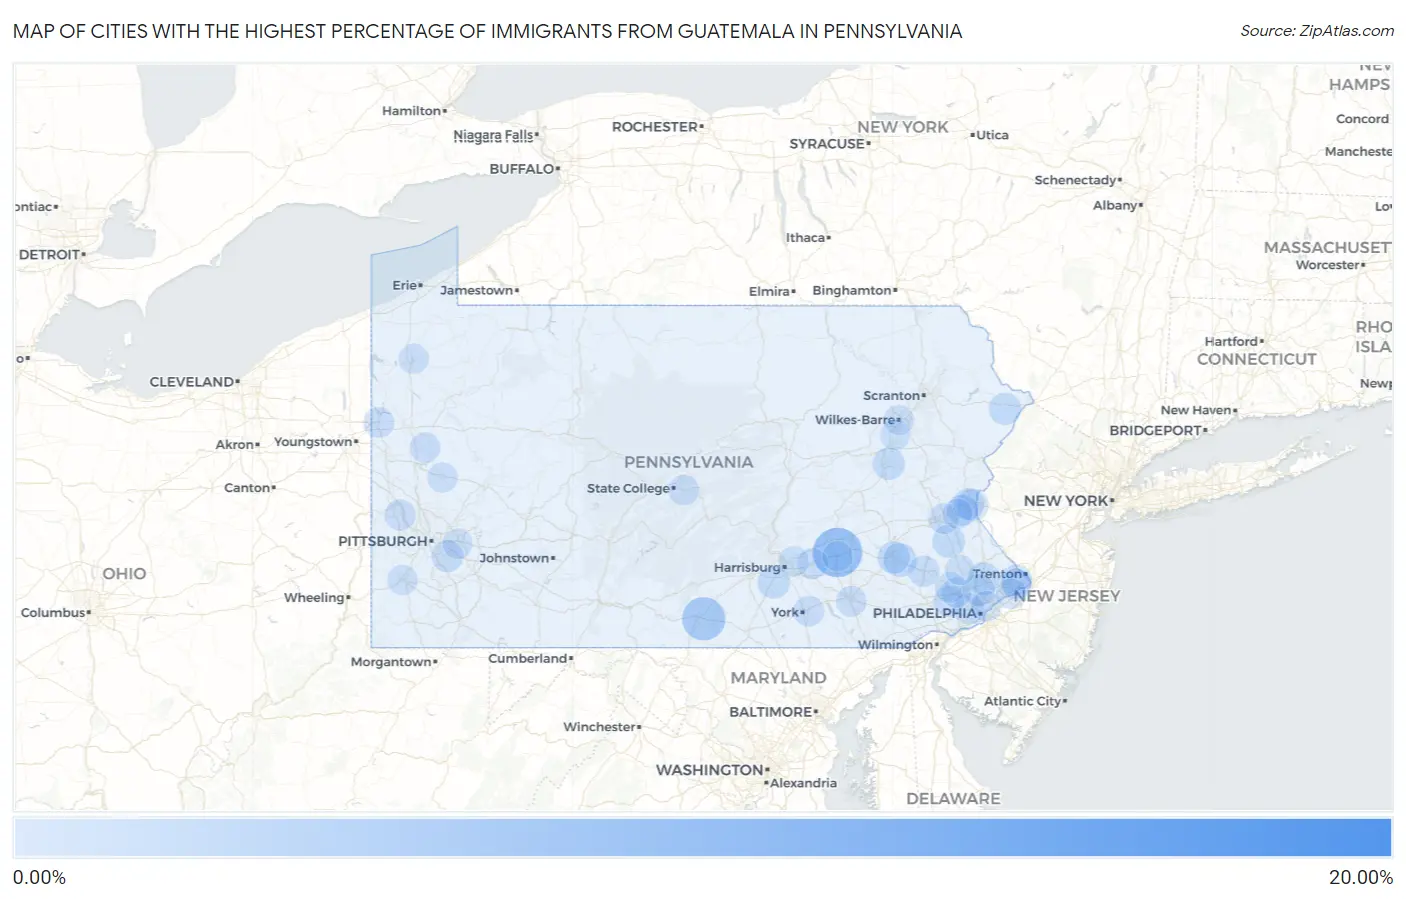
Map of Cities with the Highest Percentage of Immigrants from Guatemala in Pennsylvania
0.00%
20.00%
Cities with the Highest Percentage of Immigrants from Guatemala in Pennsylvania
| City | Guatemala | vs State | vs National | |
| 1. | Avondale Borough | 18.51% | 0.10%(+18.4)#-1 | 0.32%(+18.2)#0 |
| 2. | Sand Hill | 7.01% | 0.10%(+6.90)#0 | 0.32%(+6.69)#1 |
| 3. | Guilford | 4.75% | 0.10%(+4.65)#1 | 0.32%(+4.44)#2 |
| 4. | West Hazleton Borough | 4.31% | 0.10%(+4.21)#2 | 0.32%(+3.99)#3 |
| 5. | Chambersburg Borough | 3.80% | 0.10%(+3.70)#46 | 0.32%(+3.48)#860 |
| 6. | Mont Clare | 3.65% | 0.10%(+3.54)#47 | 0.32%(+3.33)#861 |
| 7. | Osceola Mills Borough | 2.30% | 0.10%(+2.19)#48 | 0.32%(+1.98)#862 |
| 8. | Mifflin Borough | 1.42% | 0.10%(+1.32)#49 | 0.32%(+1.11)#863 |
| 9. | Quarryville Borough | 1.34% | 0.10%(+1.24)#50 | 0.32%(+1.02)#864 |
| 10. | Lansdale Borough | 1.30% | 0.10%(+1.20)#51 | 0.32%(+0.985)#865 |
| 11. | Reiffton | 1.30% | 0.10%(+1.20)#52 | 0.32%(+0.982)#866 |
| 12. | Yardley Borough | 1.24% | 0.10%(+1.13)#53 | 0.32%(+0.917)#867 |
| 13. | West York Borough | 1.20% | 0.10%(+1.10)#54 | 0.32%(+0.886)#868 |
| 14. | Telford Borough | 1.16% | 0.10%(+1.06)#55 | 0.32%(+0.847)#869 |
| 15. | Horsham | 1.06% | 0.10%(+0.956)#56 | 0.32%(+0.741)#870 |
| 16. | Spinnerstown | 1.02% | 0.10%(+0.915)#57 | 0.32%(+0.700)#871 |
| 17. | East Prospect Borough | 0.89% | 0.10%(+0.792)#58 | 0.32%(+0.576)#872 |
| 18. | West View Borough | 0.89% | 0.10%(+0.784)#115 | 0.32%(+0.568)#1,821 |
| 19. | Reading | 0.88% | 0.10%(+0.779)#122 | 0.32%(+0.564)#2,018 |
| 20. | Messiah College | 0.85% | 0.10%(+0.744)#123 | 0.32%(+0.528)#2,019 |
| 21. | Hazleton | 0.79% | 0.10%(+0.690)#124 | 0.32%(+0.474)#2,020 |
| 22. | Gold Key Lake | 0.77% | 0.10%(+0.672)#125 | 0.32%(+0.457)#2,021 |
| 23. | Easton | 0.77% | 0.10%(+0.663)#126 | 0.32%(+0.447)#2,022 |
| 24. | Oreland | 0.73% | 0.10%(+0.633)#127 | 0.32%(+0.417)#2,023 |
| 25. | Mckeesport | 0.72% | 0.10%(+0.619)#128 | 0.32%(+0.403)#2,024 |
| 26. | Hooversville Borough | 0.69% | 0.10%(+0.590)#129 | 0.32%(+0.375)#2,025 |
| 27. | Edinboro Borough | 0.69% | 0.10%(+0.584)#130 | 0.32%(+0.368)#2,026 |
| 28. | Shenandoah Borough | 0.65% | 0.10%(+0.551)#131 | 0.32%(+0.335)#2,027 |
| 29. | Springdale Borough | 0.65% | 0.10%(+0.550)#132 | 0.32%(+0.335)#2,028 |
| 30. | Topton Borough | 0.61% | 0.10%(+0.513)#133 | 0.32%(+0.297)#2,029 |
| 31. | California Borough | 0.60% | 0.10%(+0.498)#134 | 0.32%(+0.283)#2,030 |
| 32. | Bellwood Borough | 0.59% | 0.10%(+0.493)#135 | 0.32%(+0.277)#2,031 |
| 33. | Blossburg Borough | 0.54% | 0.10%(+0.443)#136 | 0.32%(+0.227)#2,032 |
| 34. | North Catasauqua Borough | 0.54% | 0.10%(+0.439)#137 | 0.32%(+0.224)#2,033 |
| 35. | Parkesburg Borough | 0.54% | 0.10%(+0.438)#138 | 0.32%(+0.222)#2,034 |
| 36. | Palmer Heights | 0.54% | 0.10%(+0.437)#139 | 0.32%(+0.222)#2,035 |
| 37. | Bowmanstown Borough | 0.53% | 0.10%(+0.424)#140 | 0.32%(+0.209)#2,036 |
| 38. | Chestnut Hill | 0.51% | 0.10%(+0.406)#141 | 0.32%(+0.191)#2,037 |
| 39. | Fairless Hills | 0.48% | 0.10%(+0.381)#142 | 0.32%(+0.165)#2,038 |
| 40. | Wilson Borough | 0.48% | 0.10%(+0.373)#143 | 0.32%(+0.157)#2,039 |
| 41. | South Pottstown | 0.46% | 0.10%(+0.360)#144 | 0.32%(+0.144)#2,040 |
| 42. | Dublin Borough | 0.45% | 0.10%(+0.351)#145 | 0.32%(+0.136)#2,041 |
| 43. | Morrisville Borough | 0.45% | 0.10%(+0.350)#146 | 0.32%(+0.135)#2,042 |
| 44. | North Belle Vernon Borough | 0.44% | 0.10%(+0.336)#147 | 0.32%(+0.120)#2,043 |
| 45. | East Washington Borough | 0.41% | 0.10%(+0.308)#148 | 0.32%(+0.093)#2,044 |
| 46. | South Coatesville Borough | 0.40% | 0.10%(+0.298)#149 | 0.32%(+0.082)#2,045 |
| 47. | Ambler Borough | 0.40% | 0.10%(+0.296)#150 | 0.32%(+0.081)#2,046 |
| 48. | Athens Borough | 0.40% | 0.10%(+0.295)#151 | 0.32%(+0.080)#2,047 |
| 49. | Aliquippa | 0.39% | 0.10%(+0.289)#152 | 0.32%(+0.074)#2,048 |
| 50. | Middletown | 0.39% | 0.10%(+0.284)#153 | 0.32%(+0.069)#2,049 |
| 51. | Lansdowne Borough | 0.38% | 0.10%(+0.278)#154 | 0.32%(+0.062)#2,050 |
| 52. | Denver Borough | 0.37% | 0.10%(+0.267)#155 | 0.32%(+0.052)#2,051 |
| 53. | Freeland Borough | 0.37% | 0.10%(+0.266)#156 | 0.32%(+0.050)#2,052 |
| 54. | Hershey | 0.36% | 0.10%(+0.259)#157 | 0.32%(+0.043)#2,053 |
| 55. | East Stroudsburg Borough | 0.35% | 0.10%(+0.251)#158 | 0.32%(+0.035)#2,054 |
| 56. | East York | 0.34% | 0.10%(+0.237)#159 | 0.32%(+0.021)#2,055 |
| 57. | Sharon Hill Borough | 0.33% | 0.10%(+0.233)#160 | 0.32%(+0.017)#2,056 |
| 58. | Shippensburg Borough | 0.33% | 0.10%(+0.232)#161 | 0.32%(+0.016)#2,057 |
| 59. | Penn Wynne | 0.33% | 0.10%(+0.224)#162 | 0.32%(+0.009)#2,058 |
| 60. | Marysville Borough | 0.30% | 0.10%(+0.200)#163 | 0.32%(-0.016)#2,059 |
| 61. | Berwyn | 0.30% | 0.10%(+0.195)#164 | 0.32%(-0.020)#2,060 |
| 62. | North York Borough | 0.29% | 0.10%(+0.193)#165 | 0.32%(-0.023)#2,061 |
| 63. | Swissvale Borough | 0.28% | 0.10%(+0.177)#166 | 0.32%(-0.038)#2,393 |
| 64. | Hellertown Borough | 0.28% | 0.10%(+0.176)#167 | 0.32%(-0.039)#2,394 |
| 65. | Hermitage | 0.27% | 0.10%(+0.169)#168 | 0.32%(-0.046)#2,395 |
| 66. | Ramey Borough | 0.26% | 0.10%(+0.159)#169 | 0.32%(-0.057)#2,396 |
| 67. | Huntingdon Borough | 0.26% | 0.10%(+0.159)#170 | 0.32%(-0.057)#2,397 |
| 68. | South Williamsport Borough | 0.24% | 0.10%(+0.138)#171 | 0.32%(-0.078)#2,398 |
| 69. | New Bethlehem Borough | 0.24% | 0.10%(+0.135)#172 | 0.32%(-0.081)#2,399 |
| 70. | Philadelphia | 0.24% | 0.10%(+0.133)#173 | 0.32%(-0.082)#2,400 |
| 71. | Lancaster | 0.23% | 0.10%(+0.131)#174 | 0.32%(-0.085)#2,879 |
| 72. | Boalsburg | 0.23% | 0.10%(+0.131)#175 | 0.32%(-0.085)#2,880 |
| 73. | Levittown | 0.23% | 0.10%(+0.127)#176 | 0.32%(-0.089)#2,881 |
| 74. | Croydon | 0.23% | 0.10%(+0.123)#177 | 0.32%(-0.092)#2,882 |
| 75. | Slippery Rock University | 0.22% | 0.10%(+0.122)#178 | 0.32%(-0.094)#2,883 |
| 76. | Carnegie Borough | 0.22% | 0.10%(+0.121)#179 | 0.32%(-0.095)#2,884 |
| 77. | Allentown | 0.20% | 0.10%(+0.100)#180 | 0.32%(-0.116)#2,885 |
| 78. | Berwick Borough | 0.18% | 0.10%(+0.082)#181 | 0.32%(-0.134)#2,886 |
| 79. | Indiana Borough | 0.18% | 0.10%(+0.075)#182 | 0.32%(-0.140)#2,887 |
| 80. | Phoenixville Borough | 0.15% | 0.10%(+0.053)#183 | 0.32%(-0.163)#2,888 |
| 81. | Lebanon | 0.15% | 0.10%(+0.052)#184 | 0.32%(-0.164)#2,889 |
| 82. | Carlisle Borough | 0.14% | 0.10%(+0.042)#185 | 0.32%(-0.174)#2,890 |
| 83. | Monroeville | 0.14% | 0.10%(+0.042)#186 | 0.32%(-0.174)#2,891 |
| 84. | King Of Prussia | 0.14% | 0.10%(+0.037)#187 | 0.32%(-0.179)#2,892 |
| 85. | Meadville | 0.13% | 0.10%(+0.029)#188 | 0.32%(-0.186)#2,893 |
| 86. | Audubon | 0.13% | 0.10%(+0.029)#189 | 0.32%(-0.186)#2,894 |
| 87. | Churchill Borough | 0.13% | 0.10%(+0.026)#190 | 0.32%(-0.190)#2,895 |
| 88. | Colonial Park | 0.11% | 0.10%(+0.010)#191 | 0.32%(-0.205)#2,896 |
| 89. | Mountain Top | 0.11% | 0.10%(+0.008)#192 | 0.32%(-0.207)#2,897 |
| 90. | Pottstown Borough | 0.098% | 0.10%(-0.004)#193 | 0.32%(-0.219)#2,898 |
| 91. | Butler | 0.097% | 0.10%(-0.005)#194 | 0.32%(-0.221)#2,899 |
| 92. | Wilkes Barre | 0.091% | 0.10%(-0.011)#195 | 0.32%(-0.227)#2,900 |
| 93. | Bethlehem | 0.090% | 0.10%(-0.012)#196 | 0.32%(-0.228)#2,901 |
| 94. | Norristown Borough | 0.081% | 0.10%(-0.021)#197 | 0.32%(-0.237)#2,902 |
| 95. | Swarthmore Borough | 0.077% | 0.10%(-0.025)#198 | 0.32%(-0.241)#2,903 |
| 96. | Washington | 0.075% | 0.10%(-0.027)#199 | 0.32%(-0.243)#2,904 |
| 97. | Downingtown Borough | 0.074% | 0.10%(-0.028)#200 | 0.32%(-0.244)#2,905 |
| 98. | Castle Shannon Borough | 0.072% | 0.10%(-0.030)#201 | 0.32%(-0.245)#2,906 |
| 99. | Kulpsville | 0.068% | 0.10%(-0.035)#202 | 0.32%(-0.250)#2,907 |
| 100. | Darby Borough | 0.066% | 0.10%(-0.037)#203 | 0.32%(-0.252)#2,908 |
Common Questions
What are the Top 10 Cities with the Highest Percentage of Immigrants from Guatemala in Pennsylvania?
Top 10 Cities with the Highest Percentage of Immigrants from Guatemala in Pennsylvania are:
#1
7.01%
#2
4.75%
#3
1.30%
#4
1.06%
#5
1.02%
#6
0.88%
#7
0.85%
#8
0.79%
#9
0.77%
#10
0.77%
What city has the Highest Percentage of Immigrants from Guatemala in Pennsylvania?
Sand Hill has the Highest Percentage of Immigrants from Guatemala in Pennsylvania with 7.01%.
What is the Percentage of Immigrants from Guatemala in the State of Pennsylvania?
Percentage of Immigrants from Guatemala in Pennsylvania is 0.10%.
What is the Percentage of Immigrants from Guatemala in the United States?
Percentage of Immigrants from Guatemala in the United States is 0.32%.