Cities with the Highest Percentage of Immigrants from Guatemala in Delaware
RELATED REPORTS & OPTIONS
Guatemala
Delaware
Compare Cities
Map of Cities with the Highest Percentage of Immigrants from Guatemala in Delaware
0.00%
25.00%
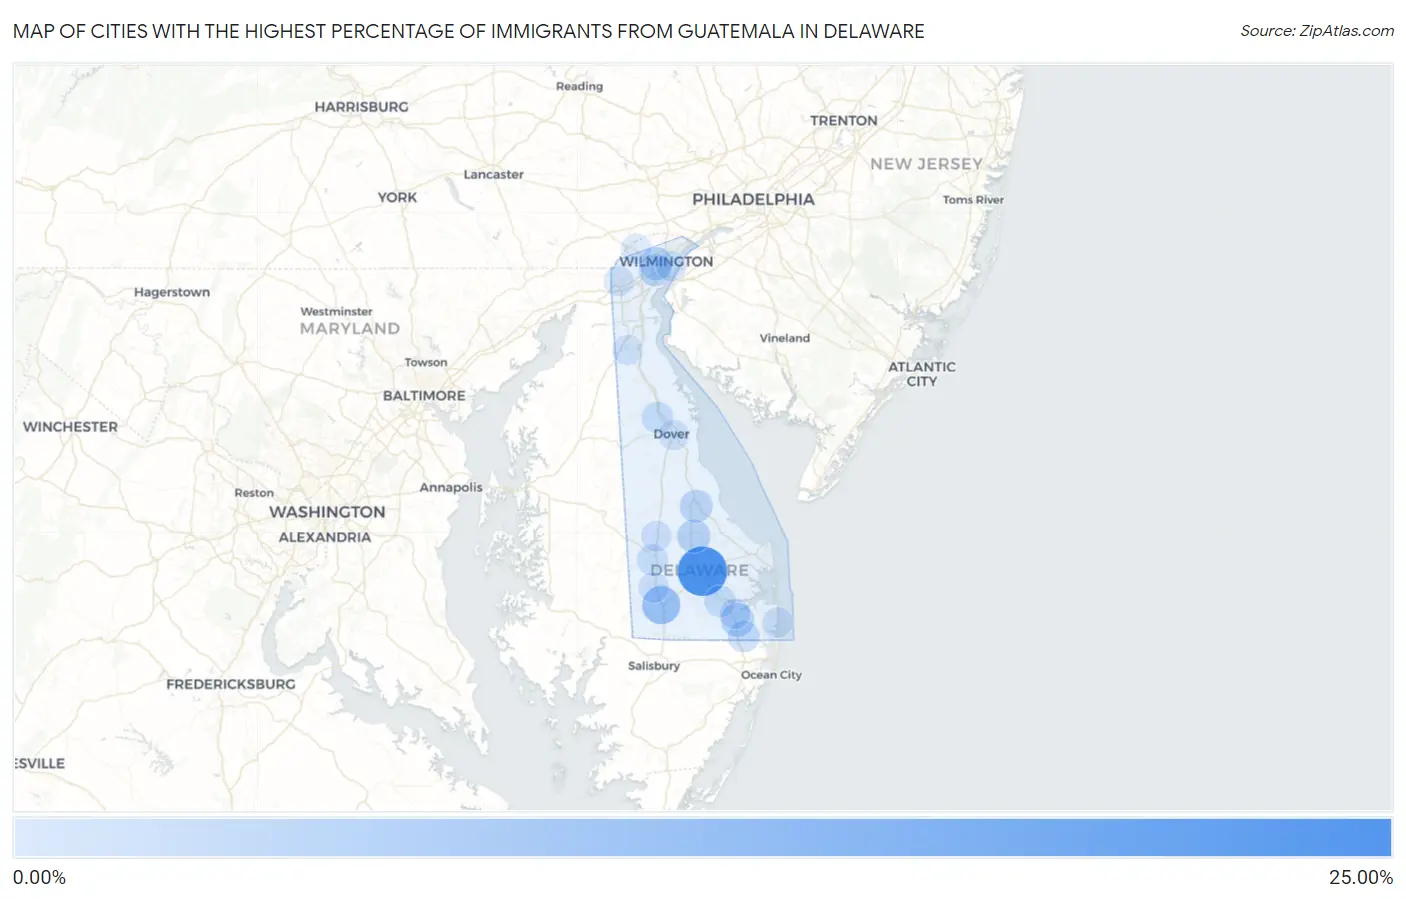
Cities with the Highest Percentage of Immigrants from Guatemala in Delaware
| City | Guatemala | vs State | vs National | |
| 1. | Georgetown | 20.92% | 0.58%(+20.3)#-1 | 0.32%(+20.6)#0 |
| 2. | Laurel | 8.45% | 0.58%(+7.86)#0 | 0.32%(+8.13)#1 |
| 3. | Frankford | 3.56% | 0.58%(+2.98)#10 | 0.32%(+3.25)#1,164 |
| 4. | Ellendale | 3.28% | 0.58%(+2.70)#11 | 0.32%(+2.97)#1,165 |
| 5. | Elsmere | 3.00% | 0.58%(+2.42)#12 | 0.32%(+2.69)#1,275 |
| 6. | Milford | 2.89% | 0.58%(+2.30)#18 | 0.32%(+2.57)#1,847 |
| 7. | Newport | 2.36% | 0.58%(+1.77)#19 | 0.32%(+2.04)#1,848 |
| 8. | Selbyville | 1.69% | 0.58%(+1.10)#20 | 0.32%(+1.37)#1,849 |
| 9. | Millsboro | 1.44% | 0.58%(+0.856)#21 | 0.32%(+1.12)#1,850 |
| 10. | Cheswold | 1.28% | 0.58%(+0.697)#22 | 0.32%(+0.964)#1,851 |
| 11. | Bridgeville | 0.97% | 0.58%(+0.381)#23 | 0.32%(+0.648)#1,852 |
| 12. | Greenwood | 0.51% | 0.58%(-0.070)#24 | 0.32%(+0.196)#1,935 |
| 13. | Dagsboro | 0.37% | 0.58%(-0.210)#25 | 0.32%(+0.056)#1,936 |
| 14. | Blades | 0.31% | 0.58%(-0.272)#26 | 0.32%(-0.005)#1,937 |
| 15. | South Bethany | 0.20% | 0.58%(-0.380)#27 | 0.32%(-0.114)#1,938 |
| 16. | Hockessin | 0.16% | 0.58%(-0.425)#28 | 0.32%(-0.159)#1,939 |
| 17. | Middletown | 0.093% | 0.58%(-0.491)#29 | 0.32%(-0.224)#1,940 |
| 18. | Wilmington | 0.080% | 0.58%(-0.504)#30 | 0.32%(-0.237)#1,941 |
| 19. | Dover | 0.075% | 0.58%(-0.509)#31 | 0.32%(-0.243)#1,942 |
| 20. | Newark | 0.016% | 0.58%(-0.568)#32 | 0.32%(-0.301)#2,227 |
1
Common Questions
What are the Top 10 Cities with the Highest Percentage of Immigrants from Guatemala in Delaware?
Top 10 Cities with the Highest Percentage of Immigrants from Guatemala in Delaware are:
#1
20.92%
#2
8.45%
#3
3.56%
#4
3.28%
#5
3.00%
#6
2.89%
#7
2.36%
#8
1.69%
#9
1.44%
#10
1.28%
What city has the Highest Percentage of Immigrants from Guatemala in Delaware?
Georgetown has the Highest Percentage of Immigrants from Guatemala in Delaware with 20.92%.
What is the Percentage of Immigrants from Guatemala in the State of Delaware?
Percentage of Immigrants from Guatemala in Delaware is 0.58%.
What is the Percentage of Immigrants from Guatemala in the United States?
Percentage of Immigrants from Guatemala in the United States is 0.32%.