Cities with the Highest Percentage of Immigrants from China in Minnesota
RELATED REPORTS & OPTIONS
China
Minnesota
Compare Cities
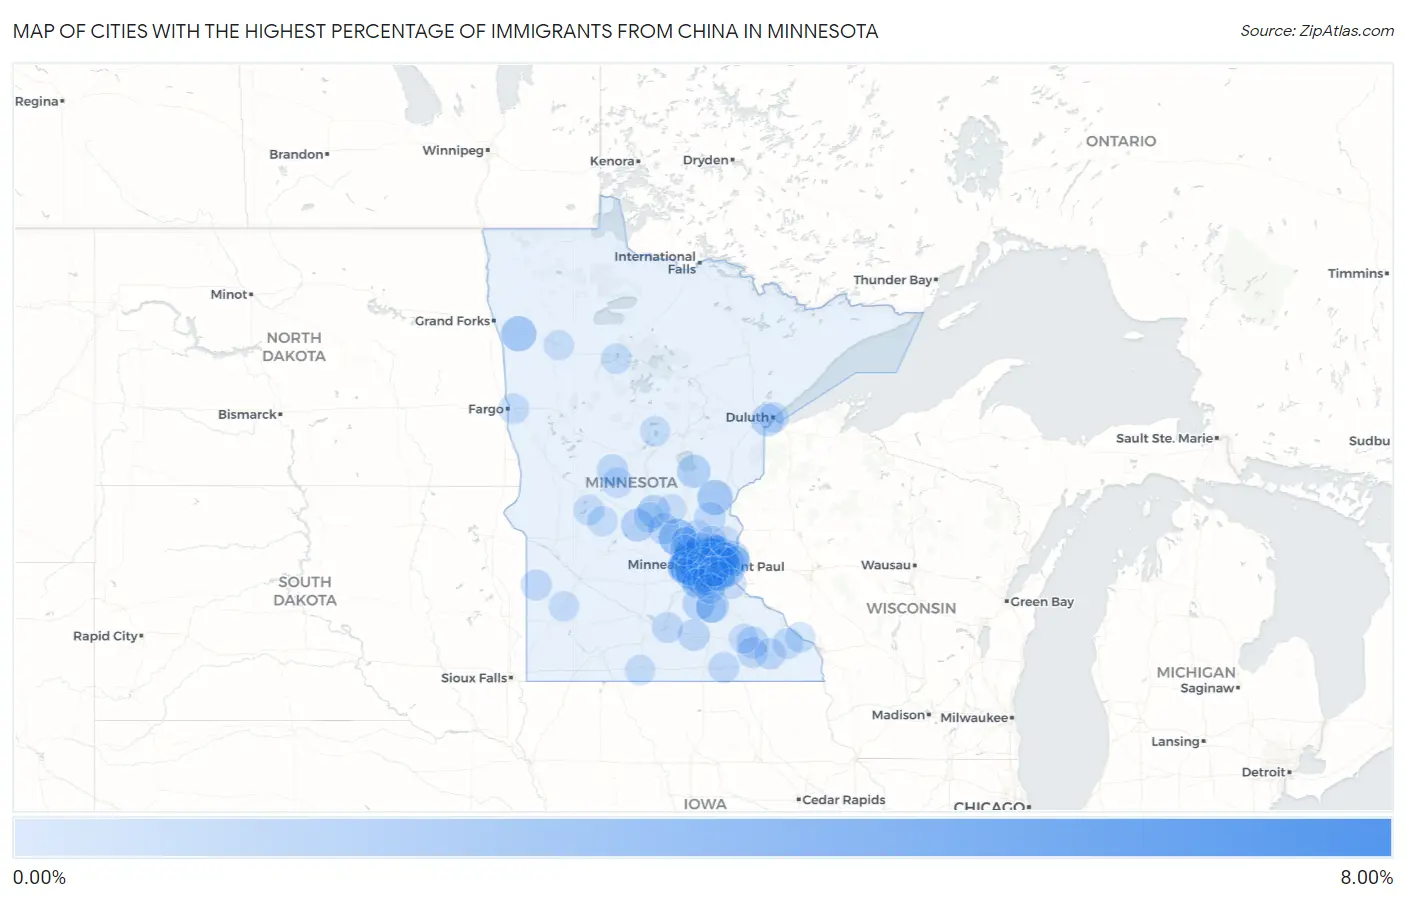
Map of Cities with the Highest Percentage of Immigrants from China in Minnesota
0.00%
8.00%
Cities with the Highest Percentage of Immigrants from China in Minnesota
| City | China | vs State | vs National | |
| 1. | Lauderdale | 6.07% | 0.36%(+5.71)#1 | 0.85%(+5.22)#193 |
| 2. | Falcon Heights | 3.82% | 0.36%(+3.46)#2 | 0.85%(+2.97)#393 |
| 3. | Orono | 3.31% | 0.36%(+2.95)#3 | 0.85%(+2.45)#473 |
| 4. | St. John's University | 2.74% | 0.36%(+2.38)#4 | 0.85%(+1.88)#611 |
| 5. | Monticello | 2.28% | 0.36%(+1.92)#5 | 0.85%(+1.43)#743 |
| 6. | Medina | 2.22% | 0.36%(+1.86)#6 | 0.85%(+1.37)#763 |
| 7. | Shoreview | 2.16% | 0.36%(+1.80)#7 | 0.85%(+1.31)#793 |
| 8. | North Oaks | 1.91% | 0.36%(+1.54)#8 | 0.85%(+1.05)#926 |
| 9. | Crookston | 1.69% | 0.36%(+1.32)#9 | 0.85%(+0.832)#1,060 |
| 10. | Grasston | 1.68% | 0.36%(+1.32)#10 | 0.85%(+0.826)#1,062 |
| 11. | Arden Hills | 1.66% | 0.36%(+1.30)#11 | 0.85%(+0.808)#1,077 |
| 12. | Eden Prairie | 1.49% | 0.36%(+1.13)#12 | 0.85%(+0.632)#1,214 |
| 13. | Sunfish Lake | 1.45% | 0.36%(+1.09)#13 | 0.85%(+0.592)#1,244 |
| 14. | St Anthony City Hennepin And Ramsey Counties | 1.35% | 0.36%(+0.989)#14 | 0.85%(+0.496)#1,332 |
| 15. | Edina | 1.32% | 0.36%(+0.960)#15 | 0.85%(+0.467)#1,361 |
| 16. | Wahkon | 1.11% | 0.36%(+0.745)#16 | 0.85%(+0.253)#1,623 |
| 17. | Woodbury | 1.10% | 0.36%(+0.741)#17 | 0.85%(+0.248)#1,625 |
| 18. | Stillwater | 1.10% | 0.36%(+0.736)#18 | 0.85%(+0.243)#1,631 |
| 19. | Richmond | 1.05% | 0.36%(+0.692)#19 | 0.85%(+0.199)#1,709 |
| 20. | Mound | 1.04% | 0.36%(+0.674)#20 | 0.85%(+0.181)#1,734 |
| 21. | Northfield | 0.97% | 0.36%(+0.608)#21 | 0.85%(+0.115)#1,839 |
| 22. | Sartell | 0.96% | 0.36%(+0.603)#22 | 0.85%(+0.110)#1,851 |
| 23. | Proctor | 0.96% | 0.36%(+0.602)#23 | 0.85%(+0.109)#1,854 |
| 24. | Circle Pines | 0.96% | 0.36%(+0.599)#24 | 0.85%(+0.106)#1,857 |
| 25. | Plymouth | 0.92% | 0.36%(+0.562)#25 | 0.85%(+0.069)#1,928 |
| 26. | Lilydale | 0.92% | 0.36%(+0.558)#26 | 0.85%(+0.065)#1,937 |
| 27. | Pine Springs | 0.90% | 0.36%(+0.541)#27 | 0.85%(+0.049)#1,962 |
| 28. | Minnetonka | 0.86% | 0.36%(+0.494)#28 | 0.85%(+0.001)#2,046 |
| 29. | Lonsdale | 0.85% | 0.36%(+0.485)#29 | 0.85%(-0.008)#2,071 |
| 30. | Corcoran | 0.82% | 0.36%(+0.463)#30 | 0.85%(-0.030)#2,108 |
| 31. | St Louis Park | 0.75% | 0.36%(+0.384)#31 | 0.85%(-0.109)#2,292 |
| 32. | Minneapolis | 0.74% | 0.36%(+0.383)#32 | 0.85%(-0.110)#2,297 |
| 33. | New Brighton | 0.70% | 0.36%(+0.334)#33 | 0.85%(-0.159)#2,420 |
| 34. | Rochester | 0.68% | 0.36%(+0.319)#34 | 0.85%(-0.173)#2,455 |
| 35. | Lake Elmo | 0.67% | 0.36%(+0.304)#35 | 0.85%(-0.188)#2,487 |
| 36. | Maple Grove | 0.65% | 0.36%(+0.286)#36 | 0.85%(-0.207)#2,547 |
| 37. | Waseca | 0.64% | 0.36%(+0.279)#37 | 0.85%(-0.214)#2,569 |
| 38. | Roseville | 0.63% | 0.36%(+0.265)#38 | 0.85%(-0.228)#2,619 |
| 39. | Clarissa | 0.59% | 0.36%(+0.230)#39 | 0.85%(-0.263)#2,721 |
| 40. | Columbia Heights | 0.58% | 0.36%(+0.220)#40 | 0.85%(-0.272)#2,752 |
| 41. | Chatfield | 0.58% | 0.36%(+0.219)#41 | 0.85%(-0.274)#2,757 |
| 42. | St Paul | 0.58% | 0.36%(+0.217)#42 | 0.85%(-0.276)#2,766 |
| 43. | Clearwater | 0.58% | 0.36%(+0.215)#43 | 0.85%(-0.278)#2,772 |
| 44. | Cambridge | 0.56% | 0.36%(+0.194)#44 | 0.85%(-0.299)#2,853 |
| 45. | Wayzata | 0.55% | 0.36%(+0.188)#45 | 0.85%(-0.305)#2,874 |
| 46. | Little Canada | 0.55% | 0.36%(+0.184)#46 | 0.85%(-0.308)#2,891 |
| 47. | Austin | 0.53% | 0.36%(+0.170)#47 | 0.85%(-0.323)#2,956 |
| 48. | Apple Valley | 0.53% | 0.36%(+0.167)#48 | 0.85%(-0.326)#2,966 |
| 49. | Bloomington | 0.53% | 0.36%(+0.166)#49 | 0.85%(-0.327)#2,972 |
| 50. | Blaine | 0.53% | 0.36%(+0.164)#50 | 0.85%(-0.329)#2,984 |
| 51. | Stewartville | 0.52% | 0.36%(+0.162)#51 | 0.85%(-0.331)#2,996 |
| 52. | Robbinsdale | 0.51% | 0.36%(+0.150)#52 | 0.85%(-0.342)#3,053 |
| 53. | Richfield | 0.51% | 0.36%(+0.146)#53 | 0.85%(-0.346)#3,069 |
| 54. | Hilltop | 0.50% | 0.36%(+0.136)#54 | 0.85%(-0.357)#3,123 |
| 55. | Shakopee | 0.48% | 0.36%(+0.123)#55 | 0.85%(-0.370)#3,171 |
| 56. | Canby | 0.47% | 0.36%(+0.112)#56 | 0.85%(-0.381)#3,222 |
| 57. | Mankato | 0.46% | 0.36%(+0.102)#57 | 0.85%(-0.391)#3,262 |
| 58. | Eagan | 0.46% | 0.36%(+0.097)#58 | 0.85%(-0.396)#3,290 |
| 59. | Mounds View | 0.46% | 0.36%(+0.096)#59 | 0.85%(-0.396)#3,297 |
| 60. | Maplewood | 0.45% | 0.36%(+0.088)#60 | 0.85%(-0.405)#3,344 |
| 61. | Minnetrista | 0.44% | 0.36%(+0.082)#61 | 0.85%(-0.411)#3,379 |
| 62. | Oak Park Heights | 0.44% | 0.36%(+0.077)#62 | 0.85%(-0.416)#3,408 |
| 63. | Chanhassen | 0.43% | 0.36%(+0.064)#63 | 0.85%(-0.429)#3,485 |
| 64. | Glenwood | 0.42% | 0.36%(+0.057)#64 | 0.85%(-0.436)#3,528 |
| 65. | Newport | 0.41% | 0.36%(+0.047)#65 | 0.85%(-0.446)#3,587 |
| 66. | Shorewood | 0.40% | 0.36%(+0.040)#66 | 0.85%(-0.453)#3,630 |
| 67. | Otsego | 0.40% | 0.36%(+0.034)#67 | 0.85%(-0.458)#3,649 |
| 68. | Lewiston | 0.40% | 0.36%(+0.034)#68 | 0.85%(-0.459)#3,651 |
| 69. | Savage | 0.39% | 0.36%(+0.024)#69 | 0.85%(-0.469)#3,719 |
| 70. | Nowthen | 0.38% | 0.36%(+0.015)#70 | 0.85%(-0.478)#3,768 |
| 71. | St Joseph | 0.37% | 0.36%(+0.006)#71 | 0.85%(-0.486)#3,816 |
| 72. | Dilworth | 0.37% | 0.36%(+0.006)#72 | 0.85%(-0.487)#3,818 |
| 73. | Albertville | 0.37% | 0.36%(+0.006)#73 | 0.85%(-0.487)#3,819 |
| 74. | Mahtomedi | 0.36% | 0.36%(-0.002)#74 | 0.85%(-0.495)#3,871 |
| 75. | Long Prairie | 0.36% | 0.36%(-0.007)#75 | 0.85%(-0.499)#3,897 |
| 76. | Champlin | 0.35% | 0.36%(-0.007)#76 | 0.85%(-0.499)#3,898 |
| 77. | Dundas | 0.35% | 0.36%(-0.012)#77 | 0.85%(-0.505)#3,928 |
| 78. | Brooten | 0.35% | 0.36%(-0.016)#78 | 0.85%(-0.508)#3,948 |
| 79. | North St Paul | 0.34% | 0.36%(-0.017)#79 | 0.85%(-0.509)#3,956 |
| 80. | Golden Valley | 0.33% | 0.36%(-0.036)#80 | 0.85%(-0.529)#4,082 |
| 81. | Burnsville | 0.32% | 0.36%(-0.040)#81 | 0.85%(-0.533)#4,107 |
| 82. | Bemidji | 0.31% | 0.36%(-0.051)#82 | 0.85%(-0.544)#4,176 |
| 83. | Bayport | 0.31% | 0.36%(-0.054)#83 | 0.85%(-0.547)#4,207 |
| 84. | Fairmont | 0.30% | 0.36%(-0.064)#84 | 0.85%(-0.557)#4,270 |
| 85. | Ham Lake | 0.30% | 0.36%(-0.064)#85 | 0.85%(-0.557)#4,278 |
| 86. | Oakdale | 0.29% | 0.36%(-0.076)#86 | 0.85%(-0.569)#4,361 |
| 87. | Winona | 0.28% | 0.36%(-0.078)#87 | 0.85%(-0.571)#4,368 |
| 88. | Prior Lake | 0.28% | 0.36%(-0.079)#88 | 0.85%(-0.572)#4,380 |
| 89. | Hastings | 0.28% | 0.36%(-0.081)#89 | 0.85%(-0.573)#4,391 |
| 90. | Lakeville | 0.28% | 0.36%(-0.082)#90 | 0.85%(-0.574)#4,400 |
| 91. | Duluth | 0.27% | 0.36%(-0.092)#91 | 0.85%(-0.585)#4,472 |
| 92. | Breezy Point | 0.27% | 0.36%(-0.093)#92 | 0.85%(-0.586)#4,480 |
| 93. | Marshall | 0.26% | 0.36%(-0.105)#93 | 0.85%(-0.598)#4,568 |
| 94. | Inver Grove Heights | 0.24% | 0.36%(-0.123)#94 | 0.85%(-0.616)#4,716 |
| 95. | Mcintosh | 0.24% | 0.36%(-0.124)#95 | 0.85%(-0.617)#4,721 |
| 96. | Forest Lake | 0.23% | 0.36%(-0.128)#96 | 0.85%(-0.621)#4,749 |
| 97. | Hanover | 0.23% | 0.36%(-0.130)#97 | 0.85%(-0.623)#4,764 |
| 98. | Mendota Heights | 0.22% | 0.36%(-0.138)#98 | 0.85%(-0.631)#4,823 |
| 99. | Foley | 0.22% | 0.36%(-0.139)#99 | 0.85%(-0.632)#4,828 |
| 100. | Byron | 0.22% | 0.36%(-0.142)#100 | 0.85%(-0.635)#4,856 |
Common Questions
What are the Top 10 Cities with the Highest Percentage of Immigrants from China in Minnesota?
Top 10 Cities with the Highest Percentage of Immigrants from China in Minnesota are:
#1
6.07%
#2
3.82%
#3
3.31%
#4
2.28%
#5
2.22%
#6
2.16%
#7
1.91%
#8
1.69%
#9
1.68%
#10
1.66%
What city has the Highest Percentage of Immigrants from China in Minnesota?
Lauderdale has the Highest Percentage of Immigrants from China in Minnesota with 6.07%.
What is the Percentage of Immigrants from China in the State of Minnesota?
Percentage of Immigrants from China in Minnesota is 0.36%.
What is the Percentage of Immigrants from China in the United States?
Percentage of Immigrants from China in the United States is 0.85%.