Cities with the Highest Percentage of Immigrants from China in Ohio
RELATED REPORTS & OPTIONS
China
Ohio
Compare Cities
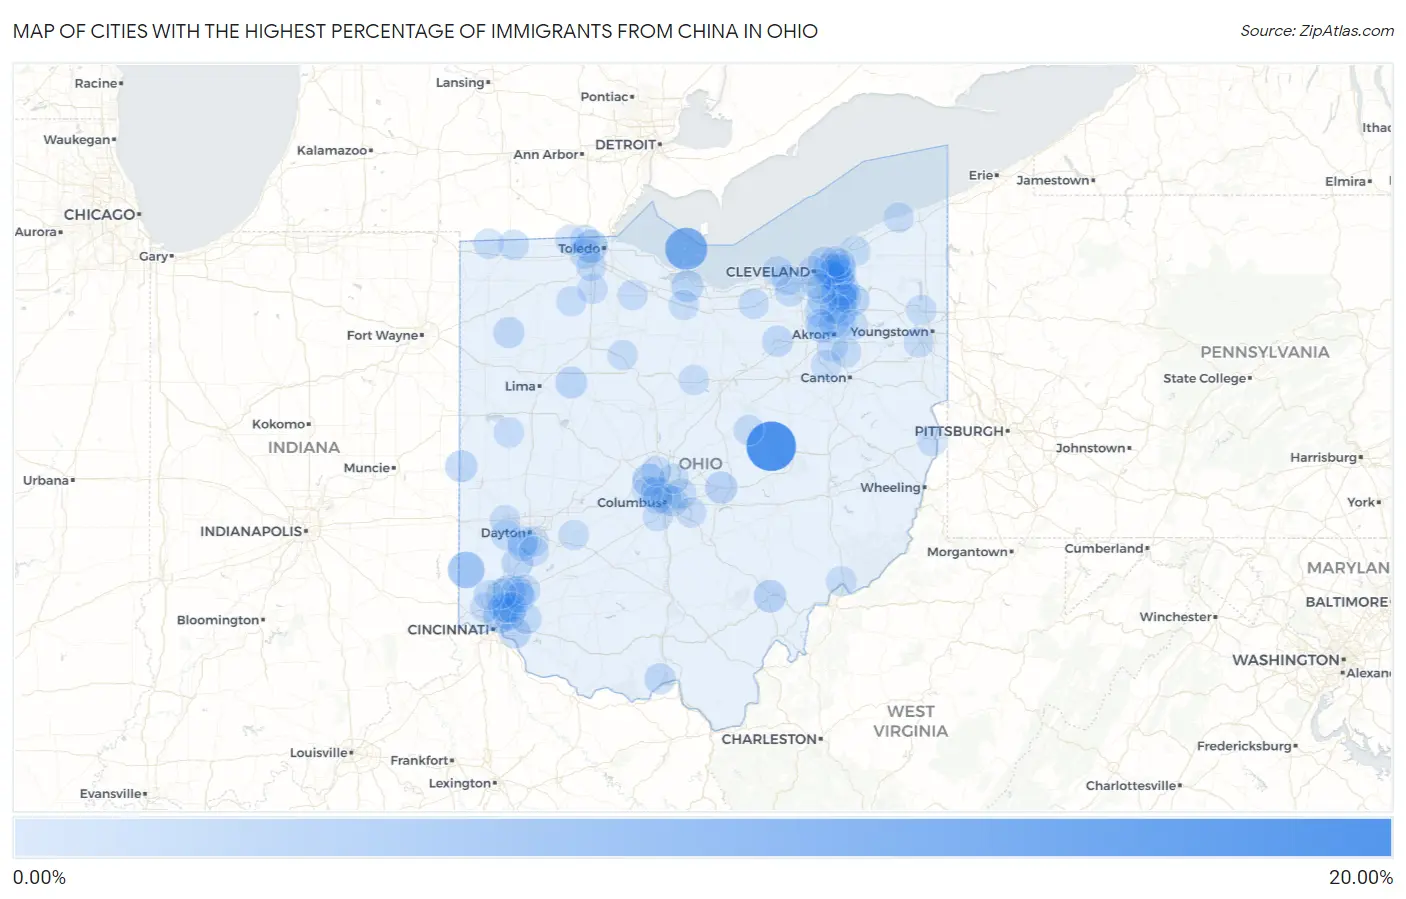
Map of Cities with the Highest Percentage of Immigrants from China in Ohio
0.00%
20.00%
Cities with the Highest Percentage of Immigrants from China in Ohio
| City | China | vs State | vs National | |
| 1. | Nellie | 18.18% | 0.35%(+17.8)#1 | 0.85%(+17.3)#26 |
| 2. | Put In Bay | 11.24% | 0.35%(+10.9)#2 | 0.85%(+10.4)#58 |
| 3. | Oxford | 6.14% | 0.35%(+5.78)#3 | 0.85%(+5.28)#191 |
| 4. | Glenwillow | 4.83% | 0.35%(+4.48)#4 | 0.85%(+3.97)#269 |
| 5. | Golf Manor | 3.75% | 0.35%(+3.40)#5 | 0.85%(+2.90)#400 |
| 6. | Solon | 3.56% | 0.35%(+3.21)#6 | 0.85%(+2.71)#426 |
| 7. | Ottawa Hills | 3.12% | 0.35%(+2.76)#7 | 0.85%(+2.26)#506 |
| 8. | Wetherington | 2.91% | 0.35%(+2.56)#8 | 0.85%(+2.06)#554 |
| 9. | Dublin | 2.90% | 0.35%(+2.55)#9 | 0.85%(+2.05)#558 |
| 10. | Athens | 2.59% | 0.35%(+2.24)#10 | 0.85%(+1.74)#644 |
| 11. | Kenwood | 2.44% | 0.35%(+2.08)#11 | 0.85%(+1.58)#688 |
| 12. | Mason | 2.37% | 0.35%(+2.02)#12 | 0.85%(+1.52)#706 |
| 13. | Granville | 2.35% | 0.35%(+2.00)#13 | 0.85%(+1.50)#710 |
| 14. | Upper Arlington | 2.18% | 0.35%(+1.83)#14 | 0.85%(+1.33)#782 |
| 15. | Castalia | 2.17% | 0.35%(+1.81)#15 | 0.85%(+1.31)#787 |
| 16. | Beachwood | 2.09% | 0.35%(+1.74)#16 | 0.85%(+1.24)#819 |
| 17. | Union City | 2.09% | 0.35%(+1.74)#17 | 0.85%(+1.24)#820 |
| 18. | Ada | 1.99% | 0.35%(+1.63)#18 | 0.85%(+1.13)#879 |
| 19. | Aurora | 1.88% | 0.35%(+1.53)#19 | 0.85%(+1.03)#937 |
| 20. | Orange | 1.81% | 0.35%(+1.45)#20 | 0.85%(+0.952)#979 |
| 21. | Jersey | 1.77% | 0.35%(+1.42)#21 | 0.85%(+0.915)#1,004 |
| 22. | Cherry Grove | 1.73% | 0.35%(+1.37)#22 | 0.85%(+0.872)#1,028 |
| 23. | Franklin | 1.71% | 0.35%(+1.36)#23 | 0.85%(+0.859)#1,039 |
| 24. | Bratenahl | 1.69% | 0.35%(+1.34)#24 | 0.85%(+0.833)#1,059 |
| 25. | Cleveland Heights | 1.58% | 0.35%(+1.23)#25 | 0.85%(+0.723)#1,133 |
| 26. | West Portsmouth | 1.57% | 0.35%(+1.22)#26 | 0.85%(+0.720)#1,136 |
| 27. | Oakwood | 1.57% | 0.35%(+1.22)#27 | 0.85%(+0.715)#1,138 |
| 28. | Lodi | 1.41% | 0.35%(+1.06)#28 | 0.85%(+0.557)#1,275 |
| 29. | Pepper Pike | 1.37% | 0.35%(+1.02)#29 | 0.85%(+0.518)#1,314 |
| 30. | Richfield | 1.34% | 0.35%(+0.992)#30 | 0.85%(+0.490)#1,336 |
| 31. | Evendale | 1.28% | 0.35%(+0.924)#31 | 0.85%(+0.422)#1,431 |
| 32. | Fairlawn | 1.22% | 0.35%(+0.869)#32 | 0.85%(+0.367)#1,492 |
| 33. | Blue Ash | 1.19% | 0.35%(+0.833)#33 | 0.85%(+0.331)#1,531 |
| 34. | Day Heights | 1.10% | 0.35%(+0.743)#34 | 0.85%(+0.241)#1,635 |
| 35. | Silver Lake | 1.07% | 0.35%(+0.716)#35 | 0.85%(+0.214)#1,684 |
| 36. | Moraine | 1.06% | 0.35%(+0.712)#36 | 0.85%(+0.210)#1,690 |
| 37. | Landen | 1.04% | 0.35%(+0.690)#37 | 0.85%(+0.189)#1,724 |
| 38. | Kirtland Hills | 1.03% | 0.35%(+0.680)#38 | 0.85%(+0.178)#1,739 |
| 39. | Shaker Heights | 1.02% | 0.35%(+0.666)#39 | 0.85%(+0.164)#1,757 |
| 40. | Gahanna | 0.99% | 0.35%(+0.641)#40 | 0.85%(+0.139)#1,806 |
| 41. | Hudson | 0.98% | 0.35%(+0.625)#41 | 0.85%(+0.124)#1,829 |
| 42. | Holland | 0.96% | 0.35%(+0.608)#42 | 0.85%(+0.106)#1,856 |
| 43. | New Lebanon | 0.94% | 0.35%(+0.591)#43 | 0.85%(+0.090)#1,888 |
| 44. | Twinsburg | 0.89% | 0.35%(+0.539)#44 | 0.85%(+0.037)#1,977 |
| 45. | Oberlin | 0.88% | 0.35%(+0.526)#45 | 0.85%(+0.024)#2,002 |
| 46. | Portage Lakes | 0.86% | 0.35%(+0.503)#46 | 0.85%(+0.001)#2,044 |
| 47. | Fayette | 0.85% | 0.35%(+0.497)#47 | 0.85%(-0.005)#2,058 |
| 48. | Westlake | 0.83% | 0.35%(+0.482)#48 | 0.85%(-0.020)#2,089 |
| 49. | South Lebanon | 0.83% | 0.35%(+0.479)#49 | 0.85%(-0.023)#2,099 |
| 50. | Cuyahoga Falls | 0.83% | 0.35%(+0.476)#50 | 0.85%(-0.026)#2,103 |
| 51. | Mayfield Heights | 0.82% | 0.35%(+0.472)#51 | 0.85%(-0.030)#2,107 |
| 52. | Reminderville | 0.81% | 0.35%(+0.458)#52 | 0.85%(-0.044)#2,129 |
| 53. | Lyndhurst | 0.81% | 0.35%(+0.457)#53 | 0.85%(-0.045)#2,130 |
| 54. | Columbus | 0.81% | 0.35%(+0.457)#54 | 0.85%(-0.045)#2,135 |
| 55. | Bexley | 0.79% | 0.35%(+0.438)#55 | 0.85%(-0.064)#2,190 |
| 56. | Olmsted Falls | 0.77% | 0.35%(+0.420)#56 | 0.85%(-0.082)#2,224 |
| 57. | Danville | 0.77% | 0.35%(+0.413)#57 | 0.85%(-0.089)#2,244 |
| 58. | Canal Fulton | 0.75% | 0.35%(+0.400)#58 | 0.85%(-0.102)#2,283 |
| 59. | Montgomery | 0.75% | 0.35%(+0.396)#59 | 0.85%(-0.106)#2,286 |
| 60. | Avon Lake | 0.75% | 0.35%(+0.393)#60 | 0.85%(-0.109)#2,293 |
| 61. | New Bremen | 0.74% | 0.35%(+0.385)#61 | 0.85%(-0.117)#2,311 |
| 62. | Uniontown | 0.73% | 0.35%(+0.381)#62 | 0.85%(-0.120)#2,322 |
| 63. | Helena | 0.73% | 0.35%(+0.377)#63 | 0.85%(-0.125)#2,338 |
| 64. | Hilliard | 0.73% | 0.35%(+0.373)#64 | 0.85%(-0.129)#2,346 |
| 65. | Boston Heights | 0.72% | 0.35%(+0.372)#65 | 0.85%(-0.130)#2,350 |
| 66. | Howland Center | 0.72% | 0.35%(+0.366)#66 | 0.85%(-0.136)#2,365 |
| 67. | Beckett Ridge | 0.71% | 0.35%(+0.356)#67 | 0.85%(-0.146)#2,387 |
| 68. | Canfield | 0.70% | 0.35%(+0.352)#68 | 0.85%(-0.150)#2,395 |
| 69. | Kent | 0.70% | 0.35%(+0.346)#69 | 0.85%(-0.156)#2,413 |
| 70. | Brecksville | 0.69% | 0.35%(+0.338)#70 | 0.85%(-0.164)#2,433 |
| 71. | Pickerington | 0.69% | 0.35%(+0.336)#71 | 0.85%(-0.166)#2,436 |
| 72. | Highland Heights | 0.67% | 0.35%(+0.318)#72 | 0.85%(-0.184)#2,479 |
| 73. | Cedarville | 0.66% | 0.35%(+0.311)#73 | 0.85%(-0.190)#2,494 |
| 74. | Brookville | 0.66% | 0.35%(+0.310)#74 | 0.85%(-0.192)#2,498 |
| 75. | Northbrook | 0.66% | 0.35%(+0.308)#75 | 0.85%(-0.194)#2,507 |
| 76. | Independence | 0.65% | 0.35%(+0.297)#76 | 0.85%(-0.204)#2,537 |
| 77. | Berkey | 0.65% | 0.35%(+0.293)#77 | 0.85%(-0.209)#2,553 |
| 78. | West Carrollton | 0.64% | 0.35%(+0.291)#78 | 0.85%(-0.211)#2,557 |
| 79. | Bowling Green | 0.63% | 0.35%(+0.277)#79 | 0.85%(-0.224)#2,608 |
| 80. | Pioneer | 0.60% | 0.35%(+0.248)#80 | 0.85%(-0.254)#2,693 |
| 81. | Marble Cliff | 0.59% | 0.35%(+0.242)#81 | 0.85%(-0.260)#2,708 |
| 82. | Westerville | 0.59% | 0.35%(+0.238)#82 | 0.85%(-0.263)#2,724 |
| 83. | Marietta | 0.59% | 0.35%(+0.238)#83 | 0.85%(-0.263)#2,725 |
| 84. | Sylvania | 0.59% | 0.35%(+0.236)#84 | 0.85%(-0.266)#2,735 |
| 85. | Kettering | 0.58% | 0.35%(+0.231)#85 | 0.85%(-0.270)#2,748 |
| 86. | Crestline | 0.58% | 0.35%(+0.226)#86 | 0.85%(-0.275)#2,763 |
| 87. | Powell | 0.57% | 0.35%(+0.221)#87 | 0.85%(-0.280)#2,780 |
| 88. | Bellevue | 0.57% | 0.35%(+0.220)#88 | 0.85%(-0.282)#2,787 |
| 89. | Carey | 0.57% | 0.35%(+0.216)#89 | 0.85%(-0.286)#2,807 |
| 90. | Montrose Ghent | 0.56% | 0.35%(+0.211)#90 | 0.85%(-0.291)#2,825 |
| 91. | Centerville | 0.56% | 0.35%(+0.206)#91 | 0.85%(-0.295)#2,840 |
| 92. | Geneva On The Lake | 0.55% | 0.35%(+0.200)#92 | 0.85%(-0.301)#2,861 |
| 93. | Richmond Heights | 0.55% | 0.35%(+0.198)#93 | 0.85%(-0.304)#2,871 |
| 94. | Grove City | 0.54% | 0.35%(+0.191)#94 | 0.85%(-0.311)#2,905 |
| 95. | Steubenville | 0.54% | 0.35%(+0.187)#95 | 0.85%(-0.315)#2,923 |
| 96. | Cleveland | 0.54% | 0.35%(+0.184)#96 | 0.85%(-0.318)#2,937 |
| 97. | Fairfield | 0.53% | 0.35%(+0.181)#97 | 0.85%(-0.321)#2,950 |
| 98. | Brooklyn Heights | 0.53% | 0.35%(+0.181)#98 | 0.85%(-0.321)#2,952 |
| 99. | Milton Center | 0.53% | 0.35%(+0.179)#99 | 0.85%(-0.323)#2,954 |
| 100. | Perrysburg | 0.53% | 0.35%(+0.178)#100 | 0.85%(-0.323)#2,958 |
Common Questions
What are the Top 10 Cities with the Highest Percentage of Immigrants from China in Ohio?
Top 10 Cities with the Highest Percentage of Immigrants from China in Ohio are:
#1
18.18%
#2
11.24%
#3
6.14%
#4
4.83%
#5
3.75%
#6
3.56%
#7
3.12%
#8
2.91%
#9
2.90%
#10
2.59%
What city has the Highest Percentage of Immigrants from China in Ohio?
Nellie has the Highest Percentage of Immigrants from China in Ohio with 18.18%.
What is the Percentage of Immigrants from China in the State of Ohio?
Percentage of Immigrants from China in Ohio is 0.35%.
What is the Percentage of Immigrants from China in the United States?
Percentage of Immigrants from China in the United States is 0.85%.