Cities with the Highest Percentage of Immigrants from China in Pennsylvania
RELATED REPORTS & OPTIONS
China
Pennsylvania
Compare Cities
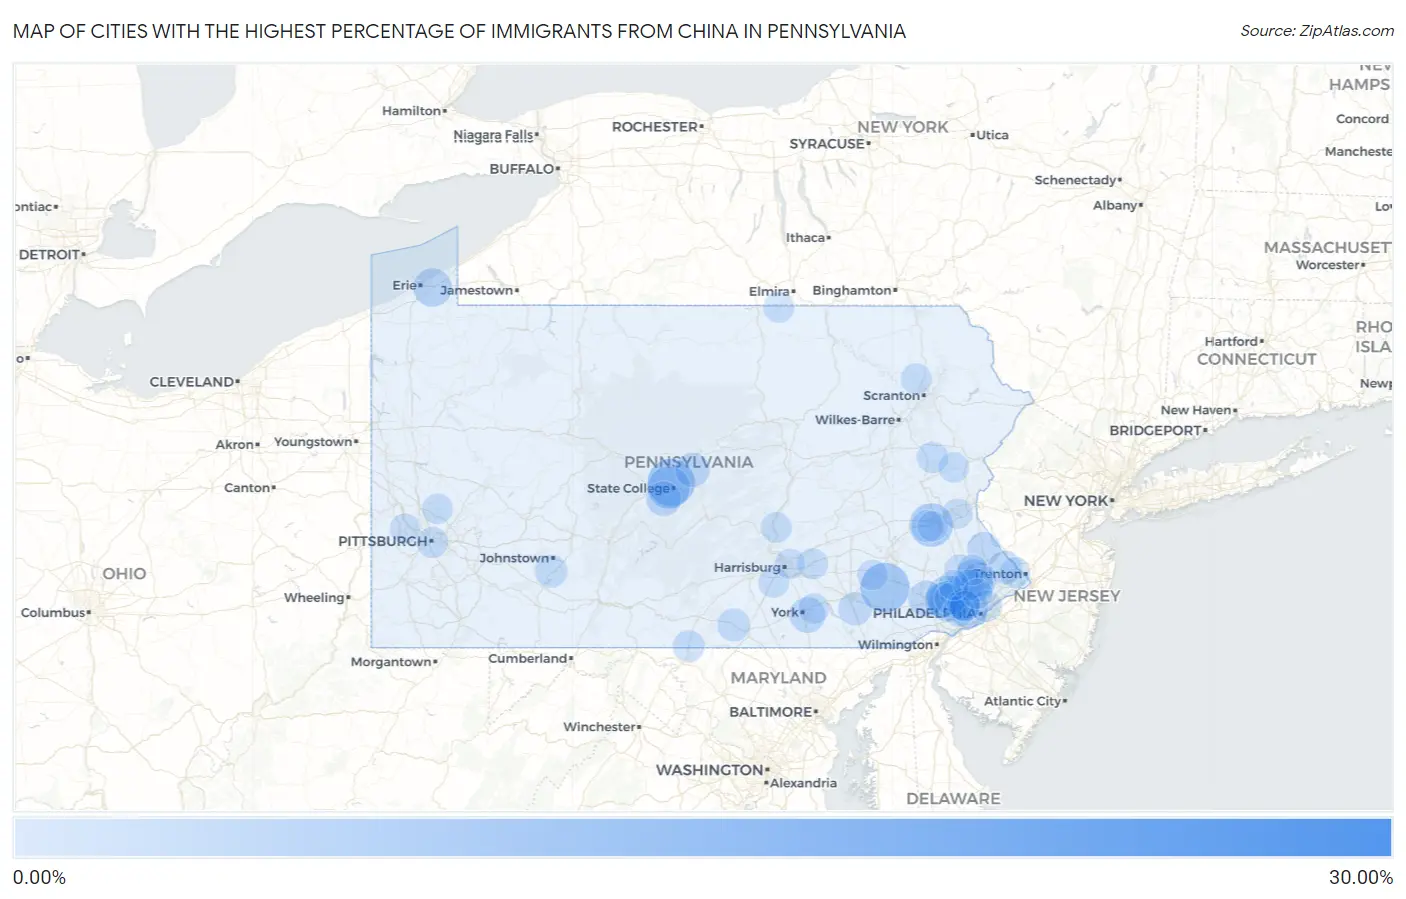
Map of Cities with the Highest Percentage of Immigrants from China in Pennsylvania
0.00%
30.00%
Cities with the Highest Percentage of Immigrants from China in Pennsylvania
| City | China | vs State | vs National | |
| 1. | Morgan Hill | 29.68% | 0.59%(+29.1)#1 | 0.85%(+28.8)#9 |
| 2. | Goodville | 8.54% | 0.59%(+7.95)#2 | 0.85%(+7.69)#94 |
| 3. | Toftrees | 7.91% | 0.59%(+7.32)#3 | 0.85%(+7.06)#116 |
| 4. | Trexlertown | 6.26% | 0.59%(+5.67)#4 | 0.85%(+5.41)#183 |
| 5. | Park Forest Village | 5.82% | 0.59%(+5.23)#5 | 0.85%(+4.97)#209 |
| 6. | Chesterbrook | 5.47% | 0.59%(+4.88)#6 | 0.85%(+4.62)#227 |
| 7. | Aspinwall Borough | 5.22% | 0.59%(+4.63)#7 | 0.85%(+4.37)#241 |
| 8. | Berwyn | 5.22% | 0.59%(+4.62)#8 | 0.85%(+4.36)#243 |
| 9. | Avondale Borough | 4.94% | 0.59%(+4.35)#9 | 0.85%(+4.09)#260 |
| 10. | Dilworthtown | 4.85% | 0.59%(+4.26)#10 | 0.85%(+4.00)#266 |
| 11. | Rosemont | 4.48% | 0.59%(+3.89)#11 | 0.85%(+3.63)#312 |
| 12. | Swarthmore Borough | 4.44% | 0.59%(+3.85)#12 | 0.85%(+3.59)#313 |
| 13. | Penn State Erie Behrend | 4.41% | 0.59%(+3.81)#13 | 0.85%(+3.55)#317 |
| 14. | Penn Wynne | 4.39% | 0.59%(+3.80)#14 | 0.85%(+3.54)#319 |
| 15. | St. Davids | 4.37% | 0.59%(+3.77)#15 | 0.85%(+3.51)#322 |
| 16. | State College Borough | 4.34% | 0.59%(+3.75)#16 | 0.85%(+3.49)#327 |
| 17. | Narberth Borough | 4.33% | 0.59%(+3.74)#17 | 0.85%(+3.48)#329 |
| 18. | Spring House | 4.32% | 0.59%(+3.73)#18 | 0.85%(+3.46)#330 |
| 19. | Paxtang Borough | 4.22% | 0.59%(+3.63)#19 | 0.85%(+3.37)#342 |
| 20. | Penn Farms | 3.44% | 0.59%(+2.85)#20 | 0.85%(+2.59)#446 |
| 21. | Millbourne Borough | 3.44% | 0.59%(+2.85)#21 | 0.85%(+2.58)#448 |
| 22. | Rutledge Borough | 3.42% | 0.59%(+2.83)#22 | 0.85%(+2.57)#451 |
| 23. | Lionville | 3.33% | 0.59%(+2.74)#23 | 0.85%(+2.48)#467 |
| 24. | Queens Gate | 3.27% | 0.59%(+2.67)#24 | 0.85%(+2.41)#483 |
| 25. | Wesleyville Borough | 3.24% | 0.59%(+2.65)#25 | 0.85%(+2.39)#488 |
| 26. | Garrett Borough | 3.18% | 0.59%(+2.59)#26 | 0.85%(+2.32)#496 |
| 27. | Paoli | 3.09% | 0.59%(+2.49)#27 | 0.85%(+2.23)#513 |
| 28. | Franklin Park Borough | 3.06% | 0.59%(+2.47)#28 | 0.85%(+2.21)#521 |
| 29. | Maple Glen | 3.01% | 0.59%(+2.42)#29 | 0.85%(+2.16)#535 |
| 30. | Big Beaver Borough | 3.01% | 0.59%(+2.41)#30 | 0.85%(+2.15)#537 |
| 31. | Ramblewood | 2.97% | 0.59%(+2.37)#31 | 0.85%(+2.11)#546 |
| 32. | North Belle Vernon Borough | 2.82% | 0.59%(+2.22)#32 | 0.85%(+1.96)#590 |
| 33. | Zion | 2.82% | 0.59%(+2.22)#33 | 0.85%(+1.96)#591 |
| 34. | Blawnox Borough | 2.74% | 0.59%(+2.15)#34 | 0.85%(+1.89)#609 |
| 35. | Morton Borough | 2.54% | 0.59%(+1.94)#35 | 0.85%(+1.68)#661 |
| 36. | Bradford Woods Borough | 2.51% | 0.59%(+1.92)#36 | 0.85%(+1.66)#667 |
| 37. | Plumsteadville | 2.49% | 0.59%(+1.90)#37 | 0.85%(+1.64)#673 |
| 38. | Newtown Grant | 2.48% | 0.59%(+1.89)#38 | 0.85%(+1.62)#678 |
| 39. | Willow Street | 2.41% | 0.59%(+1.81)#39 | 0.85%(+1.55)#695 |
| 40. | King Of Prussia | 2.33% | 0.59%(+1.73)#40 | 0.85%(+1.47)#726 |
| 41. | Apollo Borough | 2.25% | 0.59%(+1.65)#41 | 0.85%(+1.39)#756 |
| 42. | Mcknightstown | 2.19% | 0.59%(+1.60)#42 | 0.85%(+1.33)#776 |
| 43. | Connoquenessing Borough | 2.16% | 0.59%(+1.57)#43 | 0.85%(+1.31)#789 |
| 44. | Davidsville | 2.14% | 0.59%(+1.55)#44 | 0.85%(+1.29)#796 |
| 45. | Media Borough | 2.12% | 0.59%(+1.52)#45 | 0.85%(+1.26)#802 |
| 46. | Conyngham Borough | 2.08% | 0.59%(+1.48)#46 | 0.85%(+1.22)#825 |
| 47. | Bryn Mawr | 2.05% | 0.59%(+1.46)#47 | 0.85%(+1.20)#842 |
| 48. | Haverford College | 2.05% | 0.59%(+1.46)#48 | 0.85%(+1.20)#843 |
| 49. | Fort Washington | 2.03% | 0.59%(+1.43)#49 | 0.85%(+1.17)#852 |
| 50. | Merion Station | 2.02% | 0.59%(+1.43)#50 | 0.85%(+1.17)#859 |
| 51. | Fox Chapel Borough | 2.02% | 0.59%(+1.43)#51 | 0.85%(+1.16)#862 |
| 52. | Breinigsville | 1.91% | 0.59%(+1.32)#52 | 0.85%(+1.06)#921 |
| 53. | Bala Cynwyd | 1.90% | 0.59%(+1.30)#53 | 0.85%(+1.04)#931 |
| 54. | University Of Pittsburgh Bradford | 1.85% | 0.59%(+1.25)#54 | 0.85%(+0.993)#954 |
| 55. | State Line | 1.83% | 0.59%(+1.23)#55 | 0.85%(+0.972)#965 |
| 56. | Castle Shannon Borough | 1.81% | 0.59%(+1.22)#56 | 0.85%(+0.957)#975 |
| 57. | Great Bend Borough | 1.78% | 0.59%(+1.19)#57 | 0.85%(+0.929)#997 |
| 58. | Kulpmont Borough | 1.78% | 0.59%(+1.18)#58 | 0.85%(+0.922)#999 |
| 59. | Malvern Borough | 1.77% | 0.59%(+1.18)#59 | 0.85%(+0.916)#1,003 |
| 60. | West Reading Borough | 1.76% | 0.59%(+1.17)#60 | 0.85%(+0.910)#1,006 |
| 61. | Mckinley | 1.68% | 0.59%(+1.08)#61 | 0.85%(+0.822)#1,066 |
| 62. | Saegertown Borough | 1.65% | 0.59%(+1.06)#62 | 0.85%(+0.800)#1,083 |
| 63. | Philadelphia | 1.65% | 0.59%(+1.06)#63 | 0.85%(+0.794)#1,087 |
| 64. | Devon | 1.64% | 0.59%(+1.05)#64 | 0.85%(+0.786)#1,095 |
| 65. | Towamensing Trails | 1.64% | 0.59%(+1.04)#65 | 0.85%(+0.781)#1,101 |
| 66. | Eagleville Cdp Montgomery County | 1.59% | 0.59%(+0.995)#66 | 0.85%(+0.734)#1,125 |
| 67. | Kulpsville | 1.58% | 0.59%(+0.984)#67 | 0.85%(+0.723)#1,134 |
| 68. | East Side Borough | 1.54% | 0.59%(+0.951)#68 | 0.85%(+0.690)#1,151 |
| 69. | Dublin Borough | 1.54% | 0.59%(+0.948)#69 | 0.85%(+0.687)#1,156 |
| 70. | Broomall | 1.54% | 0.59%(+0.945)#70 | 0.85%(+0.684)#1,160 |
| 71. | Pittsburgh | 1.53% | 0.59%(+0.938)#71 | 0.85%(+0.676)#1,170 |
| 72. | Woodcock Borough | 1.52% | 0.59%(+0.922)#72 | 0.85%(+0.661)#1,188 |
| 73. | Marcus Hook Borough | 1.44% | 0.59%(+0.848)#73 | 0.85%(+0.587)#1,247 |
| 74. | Glenburn | 1.44% | 0.59%(+0.846)#74 | 0.85%(+0.584)#1,251 |
| 75. | Hershey | 1.41% | 0.59%(+0.817)#75 | 0.85%(+0.555)#1,276 |
| 76. | Ford Cliff Borough | 1.41% | 0.59%(+0.815)#76 | 0.85%(+0.554)#1,277 |
| 77. | Blue Bell | 1.37% | 0.59%(+0.776)#77 | 0.85%(+0.515)#1,316 |
| 78. | Lenkerville | 1.35% | 0.59%(+0.762)#78 | 0.85%(+0.500)#1,328 |
| 79. | Woodside | 1.32% | 0.59%(+0.726)#79 | 0.85%(+0.465)#1,365 |
| 80. | Avalon Borough | 1.31% | 0.59%(+0.715)#80 | 0.85%(+0.454)#1,384 |
| 81. | Brodheadsville | 1.30% | 0.59%(+0.711)#81 | 0.85%(+0.450)#1,391 |
| 82. | Reamstown | 1.30% | 0.59%(+0.710)#82 | 0.85%(+0.449)#1,393 |
| 83. | Millerton | 1.30% | 0.59%(+0.702)#83 | 0.85%(+0.441)#1,405 |
| 84. | Bakerstown | 1.29% | 0.59%(+0.701)#84 | 0.85%(+0.440)#1,408 |
| 85. | Messiah College | 1.29% | 0.59%(+0.698)#85 | 0.85%(+0.437)#1,414 |
| 86. | Ardmore | 1.29% | 0.59%(+0.693)#86 | 0.85%(+0.432)#1,420 |
| 87. | Parkesburg Borough | 1.29% | 0.59%(+0.693)#87 | 0.85%(+0.431)#1,422 |
| 88. | Montgomeryville | 1.28% | 0.59%(+0.691)#88 | 0.85%(+0.429)#1,424 |
| 89. | Trooper | 1.23% | 0.59%(+0.641)#89 | 0.85%(+0.380)#1,475 |
| 90. | Stonybrook | 1.23% | 0.59%(+0.637)#90 | 0.85%(+0.376)#1,480 |
| 91. | Millerstown Borough | 1.23% | 0.59%(+0.636)#91 | 0.85%(+0.375)#1,481 |
| 92. | Jefferson Hills Borough | 1.21% | 0.59%(+0.619)#92 | 0.85%(+0.357)#1,498 |
| 93. | Ancient Oaks | 1.20% | 0.59%(+0.602)#93 | 0.85%(+0.341)#1,521 |
| 94. | Wyndmoor | 1.19% | 0.59%(+0.600)#94 | 0.85%(+0.339)#1,523 |
| 95. | Sellersville Borough | 1.19% | 0.59%(+0.597)#95 | 0.85%(+0.336)#1,527 |
| 96. | Bethlehem | 1.18% | 0.59%(+0.585)#96 | 0.85%(+0.324)#1,544 |
| 97. | Carnot Moon | 1.18% | 0.59%(+0.583)#97 | 0.85%(+0.322)#1,549 |
| 98. | Clarion Borough | 1.17% | 0.59%(+0.572)#98 | 0.85%(+0.311)#1,561 |
| 99. | Progress | 1.16% | 0.59%(+0.568)#99 | 0.85%(+0.307)#1,566 |
| 100. | Wayne | 1.14% | 0.59%(+0.550)#100 | 0.85%(+0.288)#1,583 |
Common Questions
What are the Top 10 Cities with the Highest Percentage of Immigrants from China in Pennsylvania?
Top 10 Cities with the Highest Percentage of Immigrants from China in Pennsylvania are:
#1
8.54%
#2
7.91%
#3
6.26%
#4
5.82%
#5
5.47%
#6
5.22%
#7
4.41%
#8
4.39%
#9
4.32%
#10
3.33%
What city has the Highest Percentage of Immigrants from China in Pennsylvania?
Goodville has the Highest Percentage of Immigrants from China in Pennsylvania with 8.54%.
What is the Percentage of Immigrants from China in the State of Pennsylvania?
Percentage of Immigrants from China in Pennsylvania is 0.59%.
What is the Percentage of Immigrants from China in the United States?
Percentage of Immigrants from China in the United States is 0.85%.