Cities with the Highest Percentage of Population Employed in Educational Services in Indiana
RELATED REPORTS & OPTIONS
Educational Services
Indiana
Compare Cities
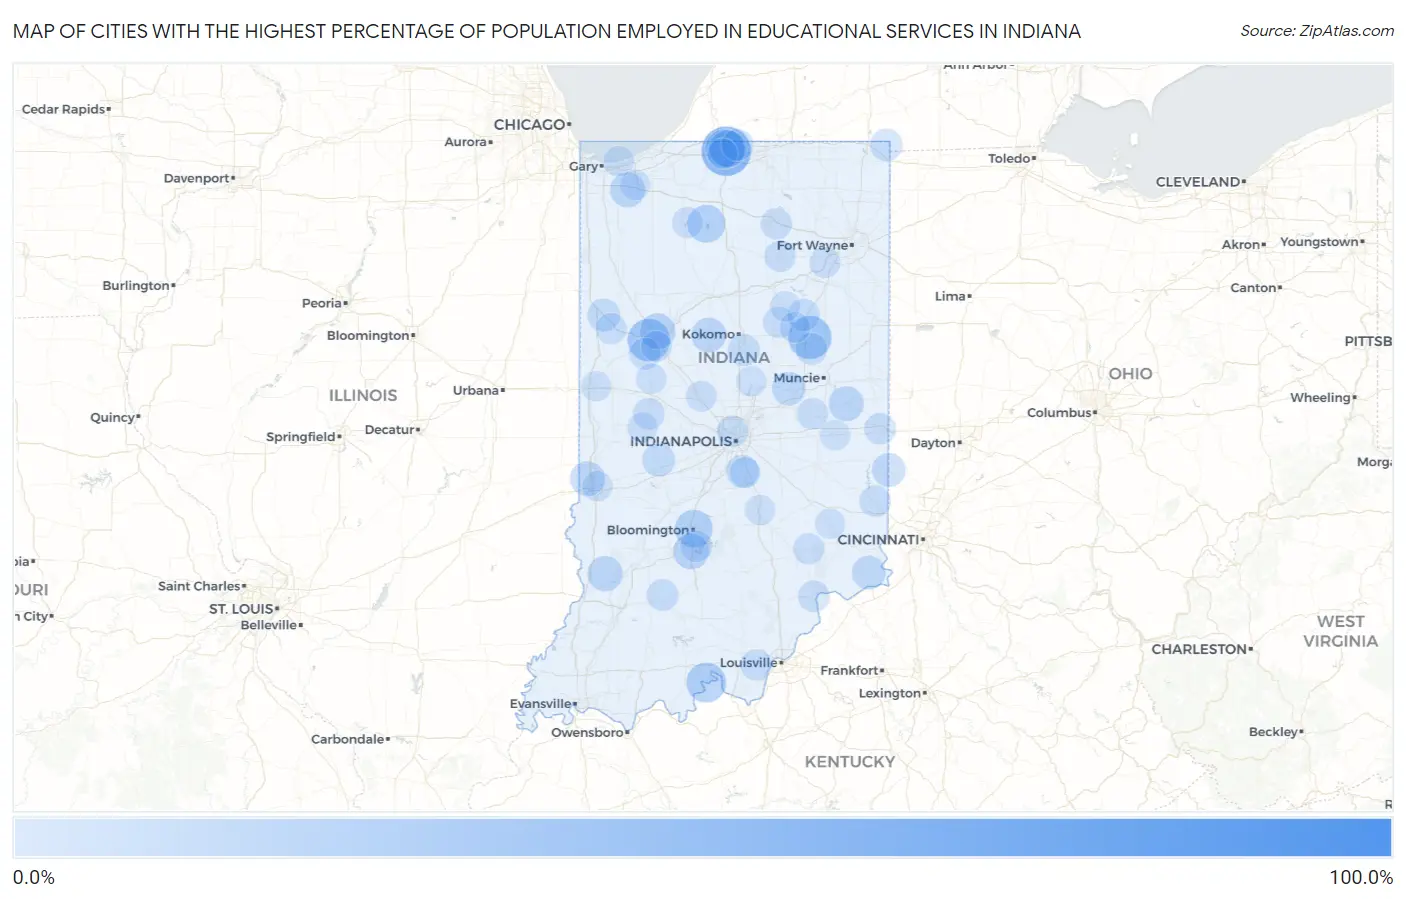
Map of Cities with the Highest Percentage of Population Employed in Educational Services in Indiana
0.0%
100.0%
Cities with the Highest Percentage of Population Employed in Educational Services in Indiana
| City | % Employed | vs State | vs National | |
| 1. | Hemlock | 100.0% | 9.0%(+91.0)#1 | 9.3%(+90.7)#21 |
| 2. | Notre Dame | 53.8% | 9.0%(+44.8)#2 | 9.3%(+44.5)#170 |
| 3. | Big Lake | 51.7% | 9.0%(+42.7)#3 | 9.3%(+42.4)#184 |
| 4. | New Lebanon | 51.2% | 9.0%(+42.2)#4 | 9.3%(+41.9)#194 |
| 5. | Cowan | 45.9% | 9.0%(+36.9)#5 | 9.3%(+36.6)#271 |
| 6. | Buckskin | 42.9% | 9.0%(+33.8)#6 | 9.3%(+33.5)#330 |
| 7. | Stone Bluff | 42.6% | 9.0%(+33.5)#7 | 9.3%(+33.2)#338 |
| 8. | Deer Creek | 42.1% | 9.0%(+33.1)#8 | 9.3%(+32.8)#348 |
| 9. | Upland | 40.8% | 9.0%(+31.8)#9 | 9.3%(+31.5)#376 |
| 10. | West Lafayette | 39.3% | 9.0%(+30.3)#10 | 9.3%(+30.0)#408 |
| 11. | Graysville | 36.8% | 9.0%(+27.8)#11 | 9.3%(+27.5)#486 |
| 12. | Lake Everett | 34.8% | 9.0%(+25.8)#12 | 9.3%(+25.5)#575 |
| 13. | Petroleum | 34.4% | 9.0%(+25.4)#13 | 9.3%(+25.1)#603 |
| 14. | Boone Grove | 33.3% | 9.0%(+24.3)#14 | 9.3%(+24.0)#648 |
| 15. | Alton | 33.3% | 9.0%(+24.3)#15 | 9.3%(+24.0)#652 |
| 16. | Roseland | 31.5% | 9.0%(+22.5)#16 | 9.3%(+22.2)#729 |
| 17. | Bridgeton | 31.4% | 9.0%(+22.4)#17 | 9.3%(+22.1)#735 |
| 18. | Jefferson | 30.9% | 9.0%(+21.9)#18 | 9.3%(+21.6)#771 |
| 19. | Culver | 29.6% | 9.0%(+20.6)#19 | 9.3%(+20.2)#851 |
| 20. | Bloomington | 29.3% | 9.0%(+20.3)#20 | 9.3%(+20.0)#862 |
| 21. | Wooster | 28.6% | 9.0%(+19.6)#21 | 9.3%(+19.3)#918 |
| 22. | Indian Village | 27.8% | 9.0%(+18.8)#22 | 9.3%(+18.5)#993 |
| 23. | Millgrove | 27.3% | 9.0%(+18.3)#23 | 9.3%(+18.0)#1,038 |
| 24. | Battle Ground | 25.6% | 9.0%(+16.6)#24 | 9.3%(+16.3)#1,184 |
| 25. | Harrodsburg | 25.4% | 9.0%(+16.4)#25 | 9.3%(+16.1)#1,213 |
| 26. | Webster | 25.0% | 9.0%(+16.0)#26 | 9.3%(+15.7)#1,246 |
| 27. | Freelandville | 24.4% | 9.0%(+15.4)#27 | 9.3%(+15.1)#1,319 |
| 28. | Romney | 23.9% | 9.0%(+14.9)#28 | 9.3%(+14.6)#1,377 |
| 29. | Aberdeen | 23.8% | 9.0%(+14.8)#29 | 9.3%(+14.5)#1,388 |
| 30. | Losantville | 23.7% | 9.0%(+14.7)#30 | 9.3%(+14.4)#1,416 |
| 31. | Burlington | 23.2% | 9.0%(+14.2)#31 | 9.3%(+13.9)#1,483 |
| 32. | St Mary Of The Woods | 23.2% | 9.0%(+14.2)#32 | 9.3%(+13.9)#1,493 |
| 33. | Rob Roy | 22.7% | 9.0%(+13.7)#33 | 9.3%(+13.4)#1,571 |
| 34. | Groverton | 22.2% | 9.0%(+13.2)#34 | 9.3%(+12.9)#1,648 |
| 35. | Andersonville | 22.0% | 9.0%(+13.0)#35 | 9.3%(+12.7)#1,690 |
| 36. | Delaware | 21.5% | 9.0%(+12.5)#36 | 9.3%(+12.2)#1,775 |
| 37. | East Enterprise | 21.4% | 9.0%(+12.4)#37 | 9.3%(+12.1)#1,786 |
| 38. | Woodlawn Heights | 21.2% | 9.0%(+12.1)#38 | 9.3%(+11.8)#1,838 |
| 39. | West College Corner | 21.1% | 9.0%(+12.1)#39 | 9.3%(+11.8)#1,863 |
| 40. | Patricksburg | 21.0% | 9.0%(+12.0)#40 | 9.3%(+11.7)#1,887 |
| 41. | Hillsdale | 20.4% | 9.0%(+11.4)#41 | 9.3%(+11.1)#2,035 |
| 42. | Mace | 20.0% | 9.0%(+11.0)#42 | 9.3%(+10.7)#2,115 |
| 43. | Greencastle | 19.7% | 9.0%(+10.7)#43 | 9.3%(+10.4)#2,204 |
| 44. | Prospect | 19.5% | 9.0%(+10.5)#44 | 9.3%(+10.2)#2,259 |
| 45. | Fowler | 19.5% | 9.0%(+10.5)#45 | 9.3%(+10.2)#2,266 |
| 46. | New Whiteland | 19.4% | 9.0%(+10.4)#46 | 9.3%(+10.1)#2,290 |
| 47. | Stendal | 19.0% | 9.0%(+10.0)#47 | 9.3%(+9.73)#2,376 |
| 48. | Bringhurst | 18.4% | 9.0%(+9.41)#48 | 9.3%(+9.11)#2,593 |
| 49. | Chili | 18.4% | 9.0%(+9.41)#49 | 9.3%(+9.11)#2,594 |
| 50. | Oakville | 18.3% | 9.0%(+9.32)#50 | 9.3%(+9.02)#2,630 |
| 51. | Clear Lake | 18.3% | 9.0%(+9.28)#51 | 9.3%(+8.98)#2,649 |
| 52. | Landess | 18.2% | 9.0%(+9.17)#52 | 9.3%(+8.87)#2,693 |
| 53. | Pleasant Lake | 17.9% | 9.0%(+8.86)#53 | 9.3%(+8.56)#2,798 |
| 54. | Sharpsville | 17.8% | 9.0%(+8.75)#54 | 9.3%(+8.45)#2,834 |
| 55. | Granger | 17.3% | 9.0%(+8.33)#55 | 9.3%(+8.03)#3,010 |
| 56. | Azalia | 17.1% | 9.0%(+8.13)#56 | 9.3%(+7.83)#3,105 |
| 57. | Smithville Sanders | 17.1% | 9.0%(+8.11)#57 | 9.3%(+7.81)#3,113 |
| 58. | New Market | 17.1% | 9.0%(+8.11)#58 | 9.3%(+7.81)#3,118 |
| 59. | Dover Hill | 17.1% | 9.0%(+8.06)#59 | 9.3%(+7.76)#3,148 |
| 60. | Spring Grove | 17.0% | 9.0%(+8.03)#60 | 9.3%(+7.73)#3,150 |
| 61. | Shadeland | 17.0% | 9.0%(+8.01)#61 | 9.3%(+7.71)#3,159 |
| 62. | Alford | 17.0% | 9.0%(+8.01)#62 | 9.3%(+7.71)#3,161 |
| 63. | Matthews | 17.0% | 9.0%(+7.98)#63 | 9.3%(+7.67)#3,171 |
| 64. | Gwynneville | 16.9% | 9.0%(+7.93)#64 | 9.3%(+7.63)#3,193 |
| 65. | Hanover | 16.7% | 9.0%(+7.70)#65 | 9.3%(+7.40)#3,299 |
| 66. | Bretzville | 16.7% | 9.0%(+7.65)#66 | 9.3%(+7.35)#3,343 |
| 67. | Cedar Grove | 16.7% | 9.0%(+7.65)#67 | 9.3%(+7.35)#3,345 |
| 68. | Spring Hill | 16.7% | 9.0%(+7.65)#68 | 9.3%(+7.35)#3,358 |
| 69. | Sweetser | 16.6% | 9.0%(+7.59)#69 | 9.3%(+7.29)#3,404 |
| 70. | Lanesville | 16.6% | 9.0%(+7.54)#70 | 9.3%(+7.24)#3,426 |
| 71. | Cadiz | 16.4% | 9.0%(+7.35)#71 | 9.3%(+7.05)#3,508 |
| 72. | Foxcliff Estates | 16.2% | 9.0%(+7.21)#72 | 9.3%(+6.91)#3,582 |
| 73. | Winona Lake | 16.1% | 9.0%(+7.12)#73 | 9.3%(+6.82)#3,637 |
| 74. | North Manchester | 16.1% | 9.0%(+7.11)#74 | 9.3%(+6.81)#3,654 |
| 75. | Butlerville | 16.0% | 9.0%(+7.03)#75 | 9.3%(+6.73)#3,690 |
| 76. | Oxford | 16.0% | 9.0%(+6.94)#76 | 9.3%(+6.64)#3,749 |
| 77. | Roanoke | 15.8% | 9.0%(+6.82)#77 | 9.3%(+6.52)#3,804 |
| 78. | Whiteland | 15.7% | 9.0%(+6.65)#78 | 9.3%(+6.35)#3,901 |
| 79. | Folsomville | 15.5% | 9.0%(+6.45)#79 | 9.3%(+6.15)#4,023 |
| 80. | Wawaka | 15.4% | 9.0%(+6.37)#80 | 9.3%(+6.07)#4,084 |
| 81. | Bass Lake | 15.2% | 9.0%(+6.22)#81 | 9.3%(+5.91)#4,168 |
| 82. | Ulen | 15.1% | 9.0%(+6.08)#82 | 9.3%(+5.78)#4,242 |
| 83. | Lafayette | 15.1% | 9.0%(+6.06)#83 | 9.3%(+5.76)#4,254 |
| 84. | Marion | 14.9% | 9.0%(+5.89)#84 | 9.3%(+5.59)#4,371 |
| 85. | Fairbanks | 14.8% | 9.0%(+5.82)#85 | 9.3%(+5.52)#4,409 |
| 86. | Ogden Dunes | 14.7% | 9.0%(+5.71)#86 | 9.3%(+5.41)#4,495 |
| 87. | Arcadia | 14.7% | 9.0%(+5.66)#87 | 9.3%(+5.36)#4,533 |
| 88. | Straughn | 14.6% | 9.0%(+5.62)#88 | 9.3%(+5.32)#4,558 |
| 89. | Linden | 14.6% | 9.0%(+5.60)#89 | 9.3%(+5.30)#4,581 |
| 90. | Terre Haute | 14.6% | 9.0%(+5.58)#90 | 9.3%(+5.28)#4,605 |
| 91. | New London | 14.6% | 9.0%(+5.57)#91 | 9.3%(+5.27)#4,616 |
| 92. | Taylorsville | 14.5% | 9.0%(+5.45)#92 | 9.3%(+5.15)#4,700 |
| 93. | La Fontaine | 14.5% | 9.0%(+5.44)#93 | 9.3%(+5.14)#4,711 |
| 94. | Wyatt | 14.3% | 9.0%(+5.27)#94 | 9.3%(+4.97)#4,863 |
| 95. | Russellville | 14.2% | 9.0%(+5.20)#95 | 9.3%(+4.90)#4,928 |
| 96. | South Bend | 14.2% | 9.0%(+5.19)#96 | 9.3%(+4.89)#4,937 |
| 97. | Anoka | 14.1% | 9.0%(+5.13)#97 | 9.3%(+4.83)#4,981 |
| 98. | Covington | 14.1% | 9.0%(+5.08)#98 | 9.3%(+4.78)#5,014 |
| 99. | Napoleon | 14.0% | 9.0%(+4.99)#99 | 9.3%(+4.68)#5,118 |
| 100. | Valparaiso | 14.0% | 9.0%(+4.95)#100 | 9.3%(+4.65)#5,148 |
Common Questions
What are the Top 10 Cities with the Highest Percentage of Population Employed in Educational Services in Indiana?
Top 10 Cities with the Highest Percentage of Population Employed in Educational Services in Indiana are:
#1
53.8%
#2
40.8%
#3
39.3%
#4
33.3%
#5
31.5%
#6
29.6%
#7
29.3%
#8
27.8%
#9
25.6%
#10
25.4%
What city has the Highest Percentage of Population Employed in Educational Services in Indiana?
Notre Dame has the Highest Percentage of Population Employed in Educational Services in Indiana with 53.8%.
What is the Percentage of Population Employed in Educational Services in the State of Indiana?
Percentage of Population Employed in Educational Services in Indiana is 9.0%.
What is the Percentage of Population Employed in Educational Services in the United States?
Percentage of Population Employed in Educational Services in the United States is 9.3%.