Cities with the Highest Percentage of Population Employed in Educational Services in Iowa
RELATED REPORTS & OPTIONS
Educational Services
Iowa
Compare Cities
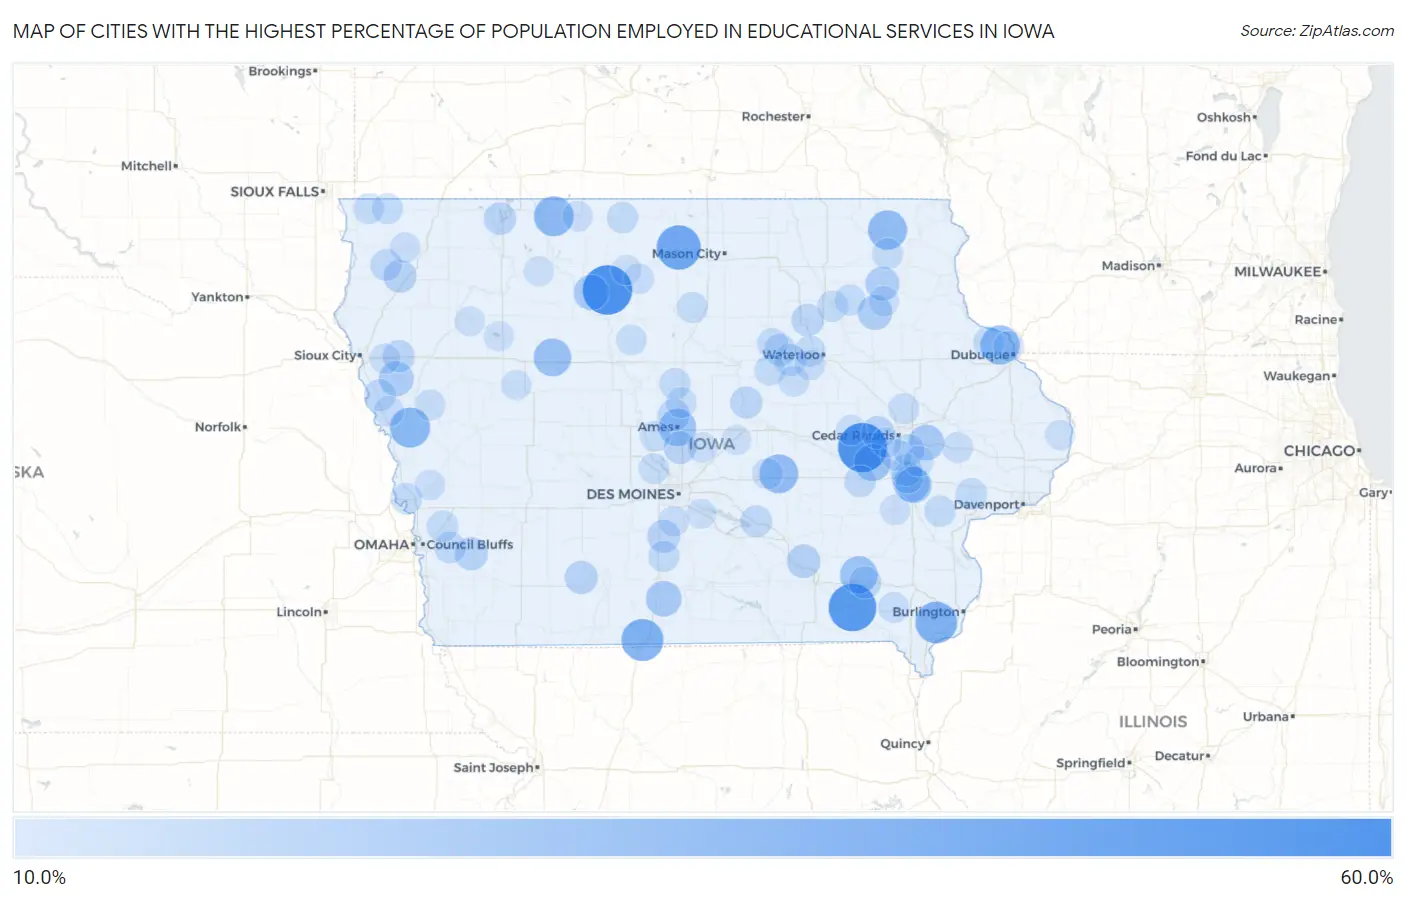
Map of Cities with the Highest Percentage of Population Employed in Educational Services in Iowa
0.0%
60.0%
Cities with the Highest Percentage of Population Employed in Educational Services in Iowa
| City | % Employed | vs State | vs National | |
| 1. | St Joseph | 55.6% | 10.0%(+45.6)#1 | 9.3%(+46.2)#152 |
| 2. | Watkins | 54.5% | 10.0%(+44.6)#2 | 9.3%(+45.2)#163 |
| 3. | Douds | 51.5% | 10.0%(+41.5)#3 | 9.3%(+42.2)#190 |
| 4. | Miller | 44.0% | 10.0%(+34.0)#4 | 9.3%(+34.7)#304 |
| 5. | Lamoni | 39.1% | 10.0%(+29.1)#5 | 9.3%(+29.8)#416 |
| 6. | Denmark | 38.5% | 10.0%(+28.6)#6 | 9.3%(+29.2)#432 |
| 7. | Turin | 35.2% | 10.0%(+25.2)#7 | 9.3%(+25.9)#559 |
| 8. | Gruver | 34.6% | 10.0%(+24.6)#8 | 9.3%(+25.3)#590 |
| 9. | Durango | 33.3% | 10.0%(+23.4)#9 | 9.3%(+24.0)#649 |
| 10. | Decorah | 33.2% | 10.0%(+23.2)#10 | 9.3%(+23.9)#656 |
| 11. | Grinnell | 32.4% | 10.0%(+22.5)#11 | 9.3%(+23.1)#690 |
| 12. | Kingston | 32.0% | 10.0%(+22.0)#12 | 9.3%(+22.7)#707 |
| 13. | Jolley | 30.0% | 10.0%(+20.0)#13 | 9.3%(+20.7)#825 |
| 14. | Maharishi Vedic City | 29.7% | 10.0%(+19.7)#14 | 9.3%(+20.4)#844 |
| 15. | Ames | 29.3% | 10.0%(+19.3)#15 | 9.3%(+20.0)#864 |
| 16. | Middle Amana | 28.7% | 10.0%(+18.7)#16 | 9.3%(+19.4)#911 |
| 17. | University Heights | 26.5% | 10.0%(+16.5)#17 | 9.3%(+17.2)#1,098 |
| 18. | Iowa City | 26.2% | 10.0%(+16.2)#18 | 9.3%(+16.9)#1,123 |
| 19. | Mount Vernon | 25.8% | 10.0%(+15.8)#19 | 9.3%(+16.4)#1,172 |
| 20. | Weldon | 25.7% | 10.0%(+15.7)#20 | 9.3%(+16.4)#1,177 |
| 21. | Ottosen | 25.0% | 10.0%(+15.0)#21 | 9.3%(+15.7)#1,256 |
| 22. | Climbing Hill | 24.0% | 10.0%(+14.0)#22 | 9.3%(+14.7)#1,368 |
| 23. | Maynard | 23.7% | 10.0%(+13.7)#23 | 9.3%(+14.4)#1,423 |
| 24. | Fairport | 22.6% | 10.0%(+12.7)#24 | 9.3%(+13.3)#1,583 |
| 25. | West Union | 22.5% | 10.0%(+12.6)#25 | 9.3%(+13.2)#1,602 |
| 26. | Wever | 22.2% | 10.0%(+12.2)#26 | 9.3%(+12.9)#1,649 |
| 27. | Kirkville | 21.4% | 10.0%(+11.4)#27 | 9.3%(+12.1)#1,800 |
| 28. | Cromwell | 20.7% | 10.0%(+10.7)#28 | 9.3%(+11.4)#1,962 |
| 29. | Macedonia | 20.6% | 10.0%(+10.6)#29 | 9.3%(+11.2)#1,986 |
| 30. | Orange City | 20.4% | 10.0%(+10.4)#30 | 9.3%(+11.0)#2,040 |
| 31. | St Marys | 20.3% | 10.0%(+10.3)#31 | 9.3%(+11.0)#2,056 |
| 32. | Atkins | 20.2% | 10.0%(+10.2)#32 | 9.3%(+10.9)#2,067 |
| 33. | Huxley | 20.1% | 10.0%(+10.1)#33 | 9.3%(+10.8)#2,094 |
| 34. | Wahpeton | 19.5% | 10.0%(+9.56)#34 | 9.3%(+10.2)#2,248 |
| 35. | Waverly | 19.2% | 10.0%(+9.19)#35 | 9.3%(+9.85)#2,344 |
| 36. | Fairfield | 19.0% | 10.0%(+8.98)#36 | 9.3%(+9.65)#2,396 |
| 37. | Moville | 18.8% | 10.0%(+8.87)#37 | 9.3%(+9.53)#2,432 |
| 38. | Liscomb | 18.8% | 10.0%(+8.84)#38 | 9.3%(+9.51)#2,445 |
| 39. | Gilbert | 18.6% | 10.0%(+8.61)#39 | 9.3%(+9.28)#2,531 |
| 40. | Stout | 18.5% | 10.0%(+8.51)#40 | 9.3%(+9.18)#2,564 |
| 41. | Dike | 18.2% | 10.0%(+8.22)#41 | 9.3%(+8.88)#2,678 |
| 42. | North Liberty | 18.1% | 10.0%(+8.11)#42 | 9.3%(+8.78)#2,719 |
| 43. | Pella | 18.1% | 10.0%(+8.08)#43 | 9.3%(+8.75)#2,728 |
| 44. | Williamsburg | 17.9% | 10.0%(+7.96)#44 | 9.3%(+8.62)#2,775 |
| 45. | Sioux Center | 17.9% | 10.0%(+7.92)#45 | 9.3%(+8.58)#2,791 |
| 46. | Sloan | 17.9% | 10.0%(+7.91)#46 | 9.3%(+8.57)#2,793 |
| 47. | Coralville | 17.8% | 10.0%(+7.84)#47 | 9.3%(+8.51)#2,812 |
| 48. | Treynor | 17.8% | 10.0%(+7.79)#48 | 9.3%(+8.46)#2,829 |
| 49. | Ely | 17.6% | 10.0%(+7.59)#49 | 9.3%(+8.26)#2,919 |
| 50. | Swisher | 17.5% | 10.0%(+7.49)#50 | 9.3%(+8.15)#2,955 |
| 51. | California Junction | 17.4% | 10.0%(+7.41)#51 | 9.3%(+8.08)#2,988 |
| 52. | Underwood | 17.4% | 10.0%(+7.40)#52 | 9.3%(+8.07)#2,991 |
| 53. | Nichols | 17.3% | 10.0%(+7.37)#53 | 9.3%(+8.03)#3,008 |
| 54. | Wilton | 17.3% | 10.0%(+7.28)#54 | 9.3%(+7.95)#3,054 |
| 55. | Lakota | 17.1% | 10.0%(+7.09)#55 | 9.3%(+7.76)#3,146 |
| 56. | New Virginia | 17.0% | 10.0%(+7.05)#56 | 9.3%(+7.72)#3,157 |
| 57. | Jewell Junction | 17.0% | 10.0%(+6.99)#57 | 9.3%(+7.65)#3,184 |
| 58. | Rickardsville | 16.9% | 10.0%(+6.96)#58 | 9.3%(+7.62)#3,203 |
| 59. | Holland | 16.7% | 10.0%(+6.69)#59 | 9.3%(+7.35)#3,337 |
| 60. | Alexander | 16.7% | 10.0%(+6.69)#60 | 9.3%(+7.35)#3,347 |
| 61. | Parkersburg | 16.6% | 10.0%(+6.65)#61 | 9.3%(+7.31)#3,390 |
| 62. | Ossian | 16.6% | 10.0%(+6.58)#62 | 9.3%(+7.25)#3,424 |
| 63. | Tripoli | 16.5% | 10.0%(+6.56)#63 | 9.3%(+7.22)#3,437 |
| 64. | Sumner | 16.5% | 10.0%(+6.54)#64 | 9.3%(+7.20)#3,451 |
| 65. | Cedar Falls | 16.3% | 10.0%(+6.36)#65 | 9.3%(+7.03)#3,516 |
| 66. | Rock Rapids | 16.3% | 10.0%(+6.31)#66 | 9.3%(+6.98)#3,540 |
| 67. | Lester | 16.3% | 10.0%(+6.30)#67 | 9.3%(+6.96)#3,549 |
| 68. | Stanwood | 16.2% | 10.0%(+6.21)#68 | 9.3%(+6.87)#3,610 |
| 69. | Mapleton | 16.2% | 10.0%(+6.18)#69 | 9.3%(+6.85)#3,623 |
| 70. | Story City | 16.1% | 10.0%(+6.09)#70 | 9.3%(+6.76)#3,681 |
| 71. | Hillsboro | 16.0% | 10.0%(+6.02)#71 | 9.3%(+6.68)#3,718 |
| 72. | Alburnett | 16.0% | 10.0%(+6.01)#72 | 9.3%(+6.68)#3,726 |
| 73. | Whiting | 15.9% | 10.0%(+5.92)#73 | 9.3%(+6.59)#3,764 |
| 74. | Oakland Acres | 15.8% | 10.0%(+5.86)#74 | 9.3%(+6.53)#3,801 |
| 75. | Reinbeck | 15.8% | 10.0%(+5.80)#75 | 9.3%(+6.47)#3,843 |
| 76. | Luther | 15.7% | 10.0%(+5.75)#76 | 9.3%(+6.41)#3,862 |
| 77. | Granger | 15.7% | 10.0%(+5.72)#77 | 9.3%(+6.39)#3,879 |
| 78. | Vincent | 15.6% | 10.0%(+5.61)#78 | 9.3%(+6.27)#3,947 |
| 79. | Van Horne | 15.5% | 10.0%(+5.57)#79 | 9.3%(+6.23)#3,974 |
| 80. | Armstrong | 15.5% | 10.0%(+5.50)#80 | 9.3%(+6.17)#4,007 |
| 81. | Boyden | 15.4% | 10.0%(+5.42)#81 | 9.3%(+6.09)#4,059 |
| 82. | Sageville | 15.4% | 10.0%(+5.41)#82 | 9.3%(+6.07)#4,086 |
| 83. | Logan | 15.4% | 10.0%(+5.38)#83 | 9.3%(+6.05)#4,094 |
| 84. | Corwith | 15.3% | 10.0%(+5.33)#84 | 9.3%(+5.99)#4,137 |
| 85. | Fayette | 15.2% | 10.0%(+5.25)#85 | 9.3%(+5.91)#4,170 |
| 86. | Spring Hill | 15.2% | 10.0%(+5.24)#86 | 9.3%(+5.90)#4,179 |
| 87. | Kalona | 15.1% | 10.0%(+5.15)#87 | 9.3%(+5.81)#4,216 |
| 88. | Maxwell | 15.0% | 10.0%(+5.05)#88 | 9.3%(+5.71)#4,279 |
| 89. | Lake View | 15.0% | 10.0%(+5.04)#89 | 9.3%(+5.71)#4,281 |
| 90. | Solon | 15.0% | 10.0%(+5.03)#90 | 9.3%(+5.70)#4,289 |
| 91. | Lawton | 15.0% | 10.0%(+5.03)#91 | 9.3%(+5.69)#4,292 |
| 92. | Hudson | 15.0% | 10.0%(+5.02)#92 | 9.3%(+5.68)#4,314 |
| 93. | Ayrshire | 14.8% | 10.0%(+4.84)#93 | 9.3%(+5.50)#4,430 |
| 94. | St Benedict | 14.8% | 10.0%(+4.84)#94 | 9.3%(+5.50)#4,434 |
| 95. | Melbourne | 14.8% | 10.0%(+4.81)#95 | 9.3%(+5.47)#4,445 |
| 96. | Lakeside | 14.8% | 10.0%(+4.79)#96 | 9.3%(+5.46)#4,456 |
| 97. | Aurelia | 14.6% | 10.0%(+4.66)#97 | 9.3%(+5.32)#4,555 |
| 98. | Andover | 14.6% | 10.0%(+4.66)#98 | 9.3%(+5.32)#4,562 |
| 99. | Hartford | 14.5% | 10.0%(+4.57)#99 | 9.3%(+5.23)#4,643 |
| 100. | Fairfax | 14.5% | 10.0%(+4.56)#100 | 9.3%(+5.22)#4,647 |
Common Questions
What are the Top 10 Cities with the Highest Percentage of Population Employed in Educational Services in Iowa?
Top 10 Cities with the Highest Percentage of Population Employed in Educational Services in Iowa are:
What city has the Highest Percentage of Population Employed in Educational Services in Iowa?
St Joseph has the Highest Percentage of Population Employed in Educational Services in Iowa with 55.6%.
What is the Percentage of Population Employed in Educational Services in the State of Iowa?
Percentage of Population Employed in Educational Services in Iowa is 10.0%.
What is the Percentage of Population Employed in Educational Services in the United States?
Percentage of Population Employed in Educational Services in the United States is 9.3%.