Cities with the Highest Percentage of Population Employed in Educational Services in Connecticut
RELATED REPORTS & OPTIONS
Educational Services
Connecticut
Compare Cities
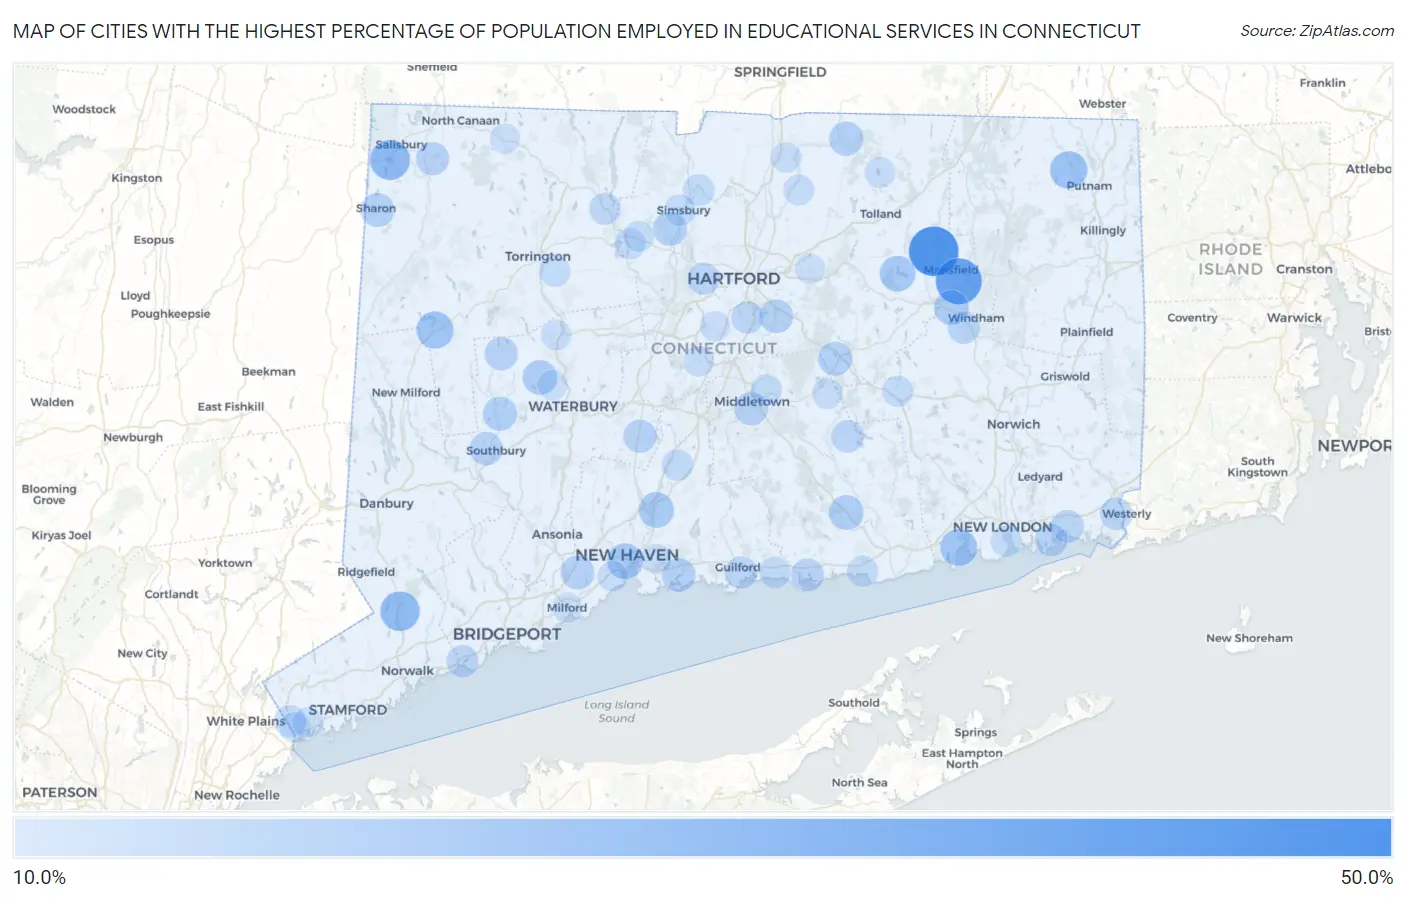
Map of Cities with the Highest Percentage of Population Employed in Educational Services in Connecticut
0.0%
50.0%
Cities with the Highest Percentage of Population Employed in Educational Services in Connecticut
| City | % Employed | vs State | vs National | |
| 1. | Quinnipiac University | 49.5% | 11.1%(+38.4)#1 | 9.3%(+40.1)#222 |
| 2. | Storrs | 47.9% | 11.1%(+36.8)#2 | 9.3%(+38.6)#242 |
| 3. | Mansfield Center | 40.7% | 11.1%(+29.7)#3 | 9.3%(+31.4)#380 |
| 4. | Lake Chaffee | 35.1% | 11.1%(+24.0)#4 | 9.3%(+25.8)#565 |
| 5. | Fairfield University | 34.8% | 11.1%(+23.8)#5 | 9.3%(+25.5)#576 |
| 6. | Sacred Heart University | 30.7% | 11.1%(+19.6)#6 | 9.3%(+21.4)#785 |
| 7. | Lakeville | 28.7% | 11.1%(+17.6)#7 | 9.3%(+19.4)#910 |
| 8. | Cannondale | 27.8% | 11.1%(+16.8)#8 | 9.3%(+18.5)#988 |
| 9. | Hawleyville | 26.3% | 11.1%(+15.3)#9 | 9.3%(+17.0)#1,110 |
| 10. | Litchfield Borough | 25.5% | 11.1%(+14.5)#10 | 9.3%(+16.2)#1,197 |
| 11. | South Woodstock | 24.0% | 11.1%(+13.0)#11 | 9.3%(+14.7)#1,364 |
| 12. | New Preston | 23.6% | 11.1%(+12.6)#12 | 9.3%(+14.3)#1,435 |
| 13. | Niantic | 22.9% | 11.1%(+11.9)#13 | 9.3%(+13.6)#1,537 |
| 14. | Route 7 Gateway | 22.7% | 11.1%(+11.7)#14 | 9.3%(+13.4)#1,561 |
| 15. | Quasset Lake | 22.1% | 11.1%(+11.0)#15 | 9.3%(+12.8)#1,681 |
| 16. | Cornwall | 21.4% | 11.1%(+10.4)#16 | 9.3%(+12.1)#1,790 |
| 17. | New Haven | 20.9% | 11.1%(+9.82)#17 | 9.3%(+11.6)#1,914 |
| 18. | Lakes East | 20.8% | 11.1%(+9.71)#18 | 9.3%(+11.4)#1,941 |
| 19. | Coventry Lake | 20.7% | 11.1%(+9.69)#19 | 9.3%(+11.4)#1,943 |
| 20. | East | 20.7% | 11.1%(+9.63)#20 | 9.3%(+11.4)#1,966 |
| 21. | North Haven | 20.3% | 11.1%(+9.26)#21 | 9.3%(+11.0)#2,049 |
| 22. | Watertown | 19.1% | 11.1%(+8.06)#22 | 9.3%(+9.79)#2,361 |
| 23. | Willimantic | 18.7% | 11.1%(+7.64)#23 | 9.3%(+9.38)#2,490 |
| 24. | Deep River Center | 18.6% | 11.1%(+7.58)#24 | 9.3%(+9.31)#2,513 |
| 25. | Old Hill | 18.4% | 11.1%(+7.39)#25 | 9.3%(+9.13)#2,581 |
| 26. | Somers | 17.8% | 11.1%(+6.73)#26 | 9.3%(+8.46)#2,824 |
| 27. | Woodbury Center | 17.7% | 11.1%(+6.68)#27 | 9.3%(+8.41)#2,853 |
| 28. | Weatogue | 17.5% | 11.1%(+6.43)#28 | 9.3%(+8.16)#2,949 |
| 29. | Terramuggus | 17.3% | 11.1%(+6.26)#29 | 9.3%(+8.00)#3,027 |
| 30. | Glastonbury Center | 17.2% | 11.1%(+6.13)#30 | 9.3%(+7.86)#3,087 |
| 31. | Poplar Plains | 17.1% | 11.1%(+6.09)#31 | 9.3%(+7.83)#3,099 |
| 32. | Orange | 17.1% | 11.1%(+6.07)#32 | 9.3%(+7.81)#3,114 |
| 33. | Dayville | 17.1% | 11.1%(+6.04)#33 | 9.3%(+7.77)#3,135 |
| 34. | Sharon | 17.1% | 11.1%(+6.04)#34 | 9.3%(+7.77)#3,136 |
| 35. | Branford Center | 16.9% | 11.1%(+5.86)#35 | 9.3%(+7.60)#3,212 |
| 36. | Woodmont Borough | 16.8% | 11.1%(+5.76)#36 | 9.3%(+7.49)#3,265 |
| 37. | Tashua | 16.8% | 11.1%(+5.75)#37 | 9.3%(+7.49)#3,266 |
| 38. | Pleasant Valley | 16.8% | 11.1%(+5.75)#38 | 9.3%(+7.48)#3,267 |
| 39. | West Cornwall | 16.7% | 11.1%(+5.62)#39 | 9.3%(+7.35)#3,365 |
| 40. | Middletown | 16.5% | 11.1%(+5.48)#40 | 9.3%(+7.22)#3,439 |
| 41. | Heritage Village | 16.4% | 11.1%(+5.39)#41 | 9.3%(+7.13)#3,478 |
| 42. | Bethlehem Village | 16.1% | 11.1%(+5.08)#42 | 9.3%(+6.82)#3,640 |
| 43. | Cheshire Village | 16.1% | 11.1%(+5.04)#43 | 9.3%(+6.78)#3,669 |
| 44. | Falls Village | 16.0% | 11.1%(+4.93)#44 | 9.3%(+6.67)#3,731 |
| 45. | Trumbull Center | 15.9% | 11.1%(+4.80)#45 | 9.3%(+6.54)#3,792 |
| 46. | Rock Ridge | 15.7% | 11.1%(+4.62)#46 | 9.3%(+6.35)#3,898 |
| 47. | Clinton | 15.4% | 11.1%(+4.30)#47 | 9.3%(+6.03)#4,107 |
| 48. | Mystic | 15.2% | 11.1%(+4.19)#48 | 9.3%(+5.93)#4,161 |
| 49. | Newtown Borough | 15.1% | 11.1%(+4.08)#49 | 9.3%(+5.82)#4,212 |
| 50. | Pawcatuck | 15.0% | 11.1%(+4.00)#50 | 9.3%(+5.73)#4,269 |
| 51. | Witches Woods | 15.0% | 11.1%(+3.95)#51 | 9.3%(+5.68)#4,300 |
| 52. | Moodus | 14.9% | 11.1%(+3.85)#52 | 9.3%(+5.58)#4,375 |
| 53. | Noank | 14.8% | 11.1%(+3.74)#53 | 9.3%(+5.47)#4,446 |
| 54. | South Windham | 14.7% | 11.1%(+3.63)#54 | 9.3%(+5.37)#4,528 |
| 55. | Lake Bungee | 14.4% | 11.1%(+3.36)#55 | 9.3%(+5.09)#4,746 |
| 56. | Guilford Center | 14.4% | 11.1%(+3.31)#56 | 9.3%(+5.04)#4,784 |
| 57. | Wethersfield | 14.3% | 11.1%(+3.29)#57 | 9.3%(+5.02)#4,805 |
| 58. | Mill Plain | 14.2% | 11.1%(+3.16)#58 | 9.3%(+4.89)#4,930 |
| 59. | Southport | 14.0% | 11.1%(+2.99)#59 | 9.3%(+4.73)#5,070 |
| 60. | West Hartford | 14.0% | 11.1%(+2.94)#60 | 9.3%(+4.68)#5,126 |
| 61. | Glenville | 14.0% | 11.1%(+2.90)#61 | 9.3%(+4.64)#5,158 |
| 62. | New Hartford Center | 13.7% | 11.1%(+2.70)#62 | 9.3%(+4.43)#5,325 |
| 63. | Lakes West | 13.7% | 11.1%(+2.64)#63 | 9.3%(+4.37)#5,361 |
| 64. | Wallingford Center | 13.0% | 11.1%(+1.91)#64 | 9.3%(+3.65)#6,056 |
| 65. | Madison Center | 12.9% | 11.1%(+1.88)#65 | 9.3%(+3.61)#6,100 |
| 66. | Tariffville | 12.9% | 11.1%(+1.86)#66 | 9.3%(+3.60)#6,113 |
| 67. | Portland | 12.6% | 11.1%(+1.58)#67 | 9.3%(+3.32)#6,404 |
| 68. | Lakeside Woods | 12.5% | 11.1%(+1.45)#68 | 9.3%(+3.18)#6,541 |
| 69. | New London | 12.5% | 11.1%(+1.43)#69 | 9.3%(+3.16)#6,595 |
| 70. | Colchester | 12.4% | 11.1%(+1.37)#70 | 9.3%(+3.10)#6,662 |
| 71. | Simsbury Center | 12.4% | 11.1%(+1.31)#71 | 9.3%(+3.04)#6,719 |
| 72. | Topstone | 12.3% | 11.1%(+1.26)#72 | 9.3%(+2.99)#6,784 |
| 73. | Northwest Harwinton | 12.2% | 11.1%(+1.17)#73 | 9.3%(+2.90)#6,895 |
| 74. | Saybrook Manor | 12.2% | 11.1%(+1.12)#74 | 9.3%(+2.85)#6,958 |
| 75. | Sandy Hook | 12.1% | 11.1%(+1.09)#75 | 9.3%(+2.83)#6,984 |
| 76. | Plattsville | 12.1% | 11.1%(+1.09)#76 | 9.3%(+2.82)#6,996 |
| 77. | Collinsville | 12.0% | 11.1%(+0.910)#77 | 9.3%(+2.65)#7,220 |
| 78. | Pemberwick | 11.9% | 11.1%(+0.885)#78 | 9.3%(+2.62)#7,261 |
| 79. | Darien Downtown | 11.9% | 11.1%(+0.831)#79 | 9.3%(+2.57)#7,319 |
| 80. | Crystal Lake | 11.8% | 11.1%(+0.780)#80 | 9.3%(+2.52)#7,388 |
| 81. | Oronoque | 11.8% | 11.1%(+0.719)#81 | 9.3%(+2.45)#7,459 |
| 82. | Broad Brook | 11.7% | 11.1%(+0.641)#82 | 9.3%(+2.38)#7,577 |
| 83. | Canton Valley | 11.6% | 11.1%(+0.522)#83 | 9.3%(+2.26)#7,740 |
| 84. | Southwood Acres | 11.4% | 11.1%(+0.397)#84 | 9.3%(+2.13)#7,922 |
| 85. | East Hampton | 11.4% | 11.1%(+0.388)#85 | 9.3%(+2.12)#7,935 |
| 86. | Kensington | 11.4% | 11.1%(+0.328)#86 | 9.3%(+2.06)#8,021 |
| 87. | Thomaston | 11.3% | 11.1%(+0.278)#87 | 9.3%(+2.01)#8,073 |
| 88. | Brookfield Center | 11.1% | 11.1%(+0.061)#88 | 9.3%(+1.80)#8,436 |
| 89. | West Haven | 11.0% | 11.1%(-0.067)#89 | 9.3%(+1.67)#8,635 |
| 90. | Groton Long Point Borough | 10.9% | 11.1%(-0.113)#90 | 9.3%(+1.62)#8,700 |
| 91. | Naugatuck Borough | 10.9% | 11.1%(-0.163)#91 | 9.3%(+1.57)#8,764 |
| 92. | Newington | 10.8% | 11.1%(-0.296)#92 | 9.3%(+1.44)#8,989 |
| 93. | Northford | 10.7% | 11.1%(-0.333)#93 | 9.3%(+1.40)#9,036 |
| 94. | Manchester | 10.7% | 11.1%(-0.369)#94 | 9.3%(+1.37)#9,091 |
| 95. | Oakville | 10.6% | 11.1%(-0.428)#95 | 9.3%(+1.31)#9,182 |
| 96. | Norfolk | 10.5% | 11.1%(-0.509)#96 | 9.3%(+1.23)#9,317 |
| 97. | Greenwich | 10.5% | 11.1%(-0.570)#97 | 9.3%(+1.16)#9,428 |
| 98. | Milford City Balance | 10.5% | 11.1%(-0.580)#98 | 9.3%(+1.15)#9,446 |
| 99. | Gaylordsville | 10.4% | 11.1%(-0.603)#99 | 9.3%(+1.13)#9,476 |
| 100. | East Haven | 10.4% | 11.1%(-0.671)#100 | 9.3%(+1.06)#9,587 |
Common Questions
What are the Top 10 Cities with the Highest Percentage of Population Employed in Educational Services in Connecticut?
Top 10 Cities with the Highest Percentage of Population Employed in Educational Services in Connecticut are:
#1
47.9%
#2
40.7%
#3
28.7%
#4
27.8%
#5
24.0%
#6
23.6%
#7
22.9%
#8
20.9%
#9
20.7%
#10
20.3%
What city has the Highest Percentage of Population Employed in Educational Services in Connecticut?
Storrs has the Highest Percentage of Population Employed in Educational Services in Connecticut with 47.9%.
What is the Percentage of Population Employed in Educational Services in the State of Connecticut?
Percentage of Population Employed in Educational Services in Connecticut is 11.1%.
What is the Percentage of Population Employed in Educational Services in the United States?
Percentage of Population Employed in Educational Services in the United States is 9.3%.