Cities with the Highest Percentage of Population Employed in Educational Services in Oregon
RELATED REPORTS & OPTIONS
Educational Services
Oregon
Compare Cities
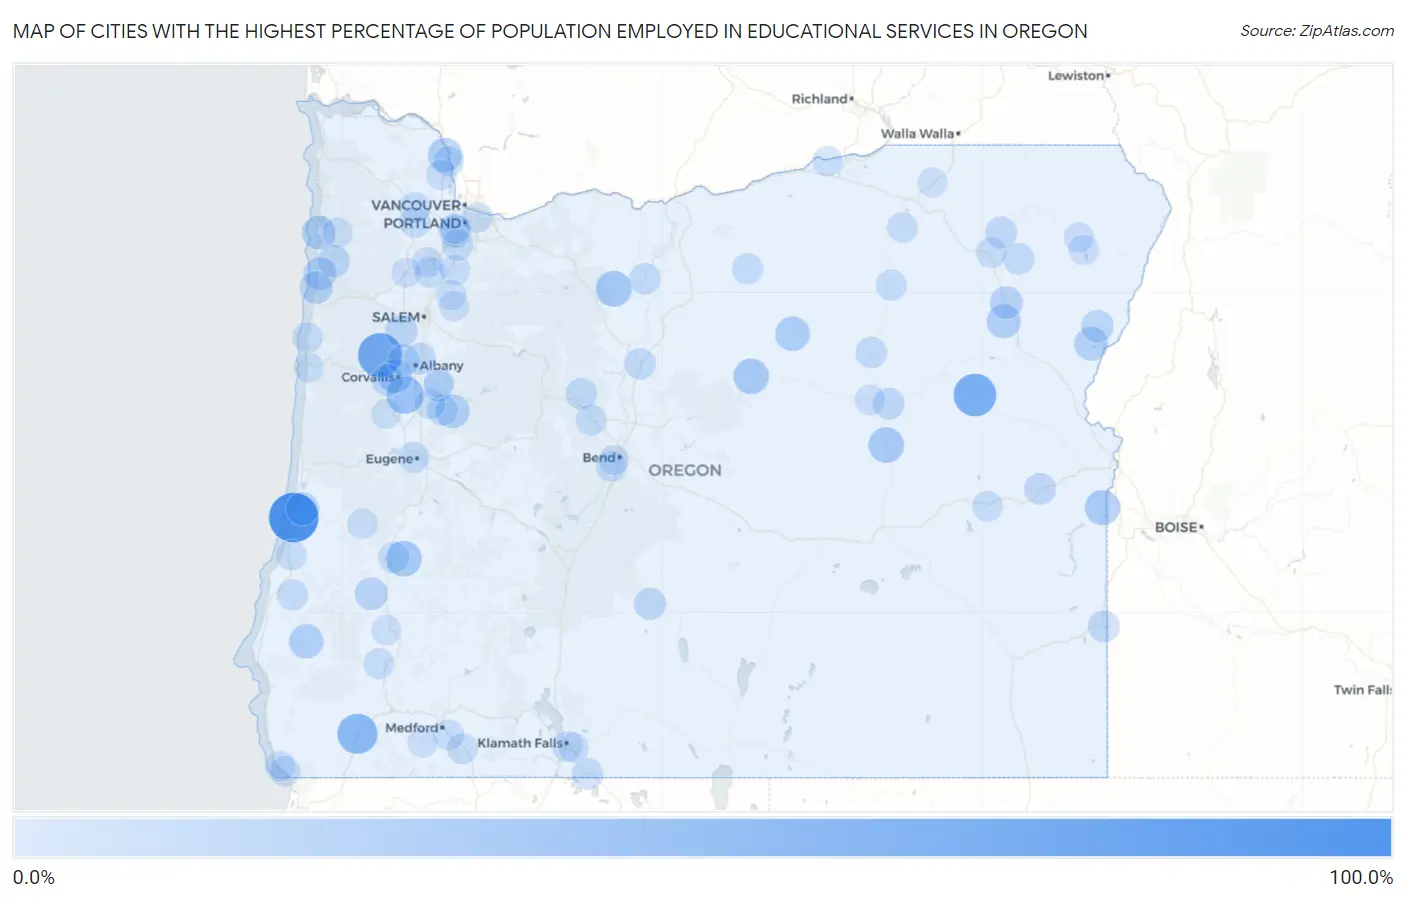
Map of Cities with the Highest Percentage of Population Employed in Educational Services in Oregon
0.0%
100.0%
Cities with the Highest Percentage of Population Employed in Educational Services in Oregon
| City | % Employed | vs State | vs National | |
| 1. | Winchester Bay | 100.0% | 8.5%(+91.5)#1 | 9.3%(+90.7)#1 |
| 2. | Kings Valley | 73.5% | 8.5%(+65.0)#2 | 9.3%(+64.2)#61 |
| 3. | Unity | 66.7% | 8.5%(+58.2)#3 | 9.3%(+57.4)#83 |
| 4. | Beaver Marsh | 59.6% | 8.5%(+51.1)#4 | 9.3%(+50.3)#121 |
| 5. | Selma | 55.3% | 8.5%(+46.7)#5 | 9.3%(+45.9)#157 |
| 6. | Peoria | 43.8% | 8.5%(+35.2)#6 | 9.3%(+34.4)#312 |
| 7. | Pine Grove | 35.7% | 8.5%(+27.2)#7 | 9.3%(+26.4)#528 |
| 8. | Fair Oaks | 35.4% | 8.5%(+26.9)#8 | 9.3%(+26.1)#544 |
| 9. | Seneca | 34.5% | 8.5%(+26.0)#9 | 9.3%(+25.2)#595 |
| 10. | Mitchell | 33.3% | 8.5%(+24.8)#10 | 9.3%(+24.0)#639 |
| 11. | Adrian | 32.3% | 8.5%(+23.7)#11 | 9.3%(+22.9)#698 |
| 12. | Spray | 30.2% | 8.5%(+21.7)#12 | 9.3%(+20.9)#813 |
| 13. | Deer Island | 29.2% | 8.5%(+20.7)#13 | 9.3%(+19.9)#873 |
| 14. | Powers | 28.7% | 8.5%(+20.2)#14 | 9.3%(+19.4)#909 |
| 15. | Corvallis | 27.9% | 8.5%(+19.4)#15 | 9.3%(+18.6)#978 |
| 16. | Mckay | 27.7% | 8.5%(+19.2)#16 | 9.3%(+18.4)#1,000 |
| 17. | Haines | 27.4% | 8.5%(+18.9)#17 | 9.3%(+18.1)#1,021 |
| 18. | Richland | 26.8% | 8.5%(+18.3)#18 | 9.3%(+17.5)#1,070 |
| 19. | Holley | 26.6% | 8.5%(+18.1)#19 | 9.3%(+17.3)#1,087 |
| 20. | Oceanside | 26.6% | 8.5%(+18.1)#20 | 9.3%(+17.3)#1,090 |
| 21. | Orient | 23.9% | 8.5%(+15.4)#21 | 9.3%(+14.6)#1,373 |
| 22. | Gardiner | 23.5% | 8.5%(+15.0)#22 | 9.3%(+14.2)#1,448 |
| 23. | Pacific City | 23.3% | 8.5%(+14.8)#23 | 9.3%(+14.0)#1,471 |
| 24. | North Powder | 22.1% | 8.5%(+13.6)#24 | 9.3%(+12.8)#1,669 |
| 25. | Lookingglass | 22.0% | 8.5%(+13.5)#25 | 9.3%(+12.7)#1,696 |
| 26. | Neskowin | 21.8% | 8.5%(+13.3)#26 | 9.3%(+12.5)#1,719 |
| 27. | Trent | 21.3% | 8.5%(+12.8)#27 | 9.3%(+12.0)#1,818 |
| 28. | Garden Home Whitford | 21.0% | 8.5%(+12.5)#28 | 9.3%(+11.7)#1,885 |
| 29. | Monmouth | 20.8% | 8.5%(+12.2)#29 | 9.3%(+11.4)#1,942 |
| 30. | Neotsu | 20.1% | 8.5%(+11.6)#30 | 9.3%(+10.8)#2,088 |
| 31. | Halfway | 19.8% | 8.5%(+11.3)#31 | 9.3%(+10.5)#2,165 |
| 32. | Beaver | 19.2% | 8.5%(+10.7)#32 | 9.3%(+9.92)#2,328 |
| 33. | Saunders Lake | 18.8% | 8.5%(+10.3)#33 | 9.3%(+9.50)#2,447 |
| 34. | Silver Lake | 18.7% | 8.5%(+10.1)#34 | 9.3%(+9.34)#2,500 |
| 35. | Millersburg | 18.2% | 8.5%(+9.68)#35 | 9.3%(+8.88)#2,679 |
| 36. | Philomath | 18.0% | 8.5%(+9.47)#36 | 9.3%(+8.68)#2,753 |
| 37. | Adair Village | 17.9% | 8.5%(+9.41)#37 | 9.3%(+8.61)#2,784 |
| 38. | Imbler | 17.7% | 8.5%(+9.22)#38 | 9.3%(+8.42)#2,850 |
| 39. | Harper | 17.1% | 8.5%(+8.63)#39 | 9.3%(+7.83)#3,104 |
| 40. | Canyon City | 17.1% | 8.5%(+8.56)#40 | 9.3%(+7.76)#3,140 |
| 41. | Cheshire | 17.0% | 8.5%(+8.45)#41 | 9.3%(+7.65)#3,185 |
| 42. | Jordan Valley | 16.9% | 8.5%(+8.37)#42 | 9.3%(+7.57)#3,226 |
| 43. | Madras | 16.6% | 8.5%(+8.04)#43 | 9.3%(+7.24)#3,428 |
| 44. | Maupin | 16.4% | 8.5%(+7.89)#44 | 9.3%(+7.09)#3,490 |
| 45. | Green Meadows | 16.2% | 8.5%(+7.71)#45 | 9.3%(+6.91)#3,590 |
| 46. | Long Creek | 15.9% | 8.5%(+7.39)#46 | 9.3%(+6.59)#3,762 |
| 47. | Merrill | 15.8% | 8.5%(+7.27)#47 | 9.3%(+6.47)#3,830 |
| 48. | Camp Sherman | 15.6% | 8.5%(+7.07)#48 | 9.3%(+6.27)#3,944 |
| 49. | Cove | 15.5% | 8.5%(+7.02)#49 | 9.3%(+6.22)#3,982 |
| 50. | Eugene | 15.4% | 8.5%(+6.83)#50 | 9.3%(+6.04)#4,106 |
| 51. | Oakland | 15.3% | 8.5%(+6.75)#51 | 9.3%(+5.95)#4,147 |
| 52. | Rivergrove | 14.9% | 8.5%(+6.42)#52 | 9.3%(+5.62)#4,349 |
| 53. | Condon | 14.9% | 8.5%(+6.36)#53 | 9.3%(+5.56)#4,393 |
| 54. | Coquille | 14.6% | 8.5%(+6.03)#54 | 9.3%(+5.24)#4,639 |
| 55. | Banks | 14.4% | 8.5%(+5.86)#55 | 9.3%(+5.06)#4,770 |
| 56. | Ukiah | 14.1% | 8.5%(+5.61)#56 | 9.3%(+4.82)#4,990 |
| 57. | Crawfordsville | 14.1% | 8.5%(+5.55)#57 | 9.3%(+4.75)#5,039 |
| 58. | Sisters | 13.9% | 8.5%(+5.43)#58 | 9.3%(+4.63)#5,162 |
| 59. | St Paul | 13.9% | 8.5%(+5.37)#59 | 9.3%(+4.57)#5,206 |
| 60. | Forest Grove | 13.7% | 8.5%(+5.22)#60 | 9.3%(+4.42)#5,328 |
| 61. | Seventh Mountain | 13.7% | 8.5%(+5.14)#61 | 9.3%(+4.34)#5,386 |
| 62. | South Lebanon | 13.6% | 8.5%(+5.11)#62 | 9.3%(+4.31)#5,425 |
| 63. | Klamath Falls | 13.6% | 8.5%(+5.05)#63 | 9.3%(+4.25)#5,478 |
| 64. | Island City | 13.3% | 8.5%(+4.79)#64 | 9.3%(+3.99)#5,709 |
| 65. | Ashland | 13.0% | 8.5%(+4.49)#65 | 9.3%(+3.69)#6,017 |
| 66. | Phoenix | 12.8% | 8.5%(+4.29)#66 | 9.3%(+3.49)#6,230 |
| 67. | Pilot Rock | 12.8% | 8.5%(+4.25)#67 | 9.3%(+3.45)#6,253 |
| 68. | Glendale | 12.5% | 8.5%(+4.02)#68 | 9.3%(+3.22)#6,495 |
| 69. | River Road | 12.5% | 8.5%(+4.02)#69 | 9.3%(+3.22)#6,498 |
| 70. | Juntura | 12.5% | 8.5%(+3.98)#70 | 9.3%(+3.18)#6,578 |
| 71. | Dundee | 12.5% | 8.5%(+3.97)#71 | 9.3%(+3.17)#6,586 |
| 72. | Brownsville | 12.4% | 8.5%(+3.90)#72 | 9.3%(+3.10)#6,664 |
| 73. | Columbia City | 12.3% | 8.5%(+3.82)#73 | 9.3%(+3.03)#6,736 |
| 74. | Glasgow | 12.3% | 8.5%(+3.82)#74 | 9.3%(+3.02)#6,742 |
| 75. | Harbor | 12.3% | 8.5%(+3.81)#75 | 9.3%(+3.01)#6,758 |
| 76. | Warren | 12.3% | 8.5%(+3.77)#76 | 9.3%(+2.97)#6,798 |
| 77. | Raleigh Hills | 12.0% | 8.5%(+3.53)#77 | 9.3%(+2.73)#7,114 |
| 78. | Depoe Bay | 11.9% | 8.5%(+3.39)#78 | 9.3%(+2.59)#7,287 |
| 79. | Aurora | 11.8% | 8.5%(+3.32)#79 | 9.3%(+2.52)#7,384 |
| 80. | Maywood Park | 11.8% | 8.5%(+3.29)#80 | 9.3%(+2.49)#7,423 |
| 81. | Brookings | 11.8% | 8.5%(+3.24)#81 | 9.3%(+2.44)#7,493 |
| 82. | Silverton | 11.7% | 8.5%(+3.18)#82 | 9.3%(+2.38)#7,576 |
| 83. | Mount Vernon | 11.7% | 8.5%(+3.15)#83 | 9.3%(+2.35)#7,613 |
| 84. | Elkton | 11.5% | 8.5%(+3.02)#84 | 9.3%(+2.22)#7,794 |
| 85. | Joseph | 11.4% | 8.5%(+2.86)#85 | 9.3%(+2.06)#8,020 |
| 86. | Tetherow | 11.3% | 8.5%(+2.76)#86 | 9.3%(+1.96)#8,150 |
| 87. | Mount Angel | 11.0% | 8.5%(+2.53)#87 | 9.3%(+1.73)#8,541 |
| 88. | Fairview | 11.0% | 8.5%(+2.44)#88 | 9.3%(+1.64)#8,666 |
| 89. | Irrigon | 10.9% | 8.5%(+2.41)#89 | 9.3%(+1.61)#8,710 |
| 90. | Enterprise | 10.9% | 8.5%(+2.39)#90 | 9.3%(+1.59)#8,746 |
| 91. | Heceta Beach | 10.7% | 8.5%(+2.22)#91 | 9.3%(+1.43)#9,010 |
| 92. | Newport | 10.7% | 8.5%(+2.22)#92 | 9.3%(+1.42)#9,018 |
| 93. | Lebanon | 10.7% | 8.5%(+2.21)#93 | 9.3%(+1.41)#9,027 |
| 94. | Alpine | 10.4% | 8.5%(+1.86)#94 | 9.3%(+1.06)#9,595 |
| 95. | Ruch | 10.3% | 8.5%(+1.82)#95 | 9.3%(+1.02)#9,666 |
| 96. | Riddle | 10.3% | 8.5%(+1.81)#96 | 9.3%(+1.01)#9,687 |
| 97. | Altamont | 10.2% | 8.5%(+1.72)#97 | 9.3%(+0.919)#9,839 |
| 98. | Jasper | 10.1% | 8.5%(+1.57)#98 | 9.3%(+0.769)#10,103 |
| 99. | Mcminnville | 10.1% | 8.5%(+1.55)#99 | 9.3%(+0.751)#10,139 |
| 100. | Adams | 10.1% | 8.5%(+1.54)#100 | 9.3%(+0.744)#10,149 |
Common Questions
What are the Top 10 Cities with the Highest Percentage of Population Employed in Educational Services in Oregon?
Top 10 Cities with the Highest Percentage of Population Employed in Educational Services in Oregon are:
#1
100.0%
#2
73.5%
#3
66.7%
#4
55.3%
#5
43.8%
#6
35.7%
#7
35.4%
#8
34.5%
#9
33.3%
#10
32.3%
What city has the Highest Percentage of Population Employed in Educational Services in Oregon?
Winchester Bay has the Highest Percentage of Population Employed in Educational Services in Oregon with 100.0%.
What is the Percentage of Population Employed in Educational Services in the State of Oregon?
Percentage of Population Employed in Educational Services in Oregon is 8.5%.
What is the Percentage of Population Employed in Educational Services in the United States?
Percentage of Population Employed in Educational Services in the United States is 9.3%.