Cities with the Highest Percentage of Population Employed in Educational Services in Massachusetts
RELATED REPORTS & OPTIONS
Educational Services
Massachusetts
Compare Cities
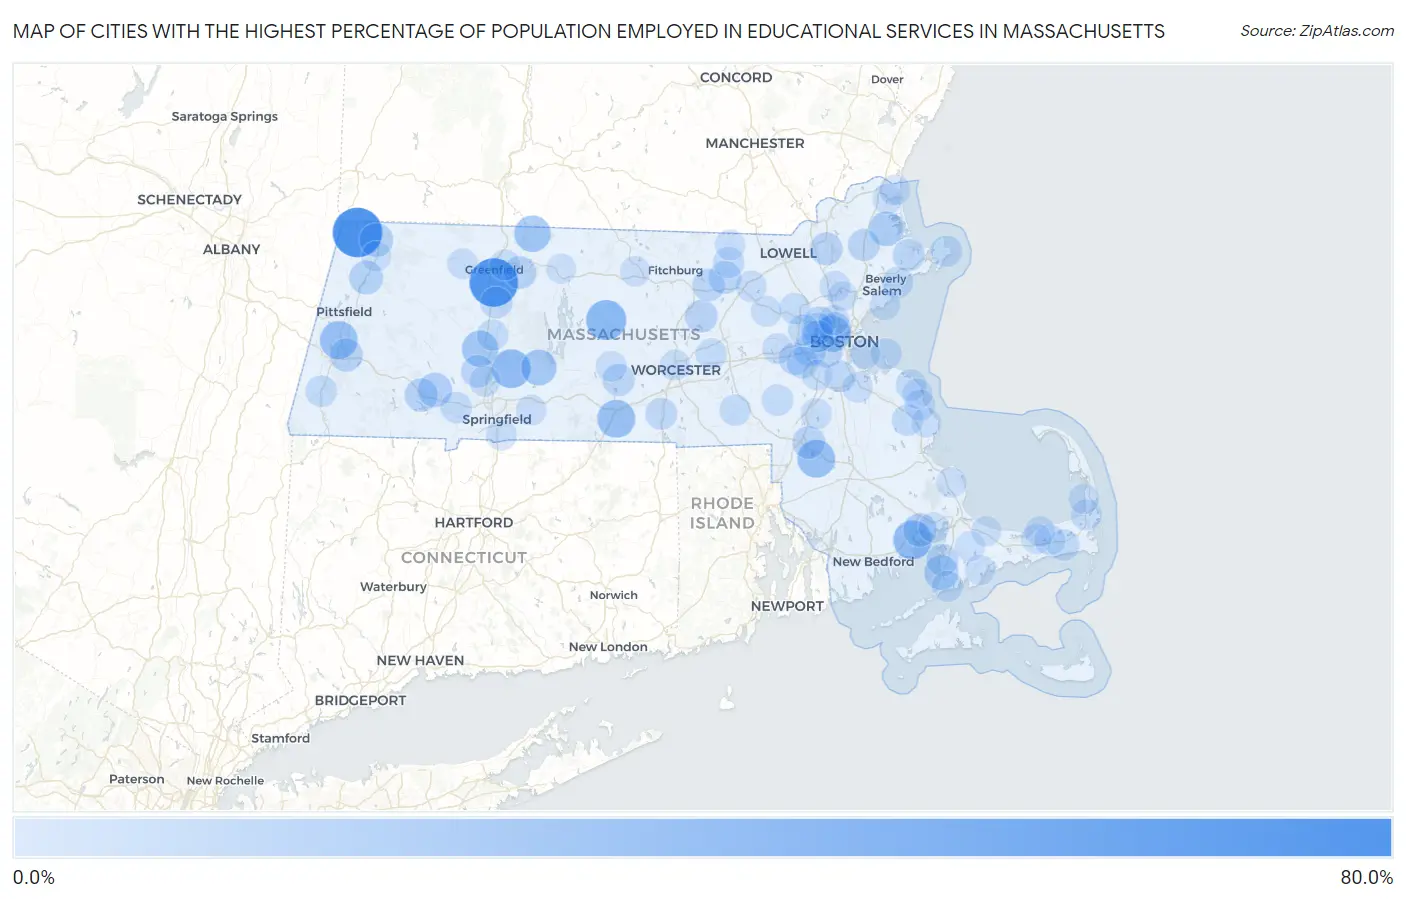
Map of Cities with the Highest Percentage of Population Employed in Educational Services in Massachusetts
0.0%
80.0%
Cities with the Highest Percentage of Population Employed in Educational Services in Massachusetts
| City | % Employed | vs State | vs National | |
| 1. | Williamstown | 62.4% | 11.7%(+50.6)#1 | 9.3%(+53.1)#101 |
| 2. | Deerfield | 59.6% | 11.7%(+47.8)#2 | 9.3%(+50.3)#122 |
| 3. | Amherst | 40.8% | 11.7%(+29.0)#3 | 9.3%(+31.5)#377 |
| 4. | Barre | 37.0% | 11.7%(+25.2)#4 | 9.3%(+27.7)#480 |
| 5. | Granby | 33.6% | 11.7%(+21.8)#5 | 9.3%(+24.2)#628 |
| 6. | Marion Center | 33.5% | 11.7%(+21.8)#6 | 9.3%(+24.2)#631 |
| 7. | Sturbridge | 31.5% | 11.7%(+19.7)#7 | 9.3%(+22.1)#730 |
| 8. | Lenox | 31.3% | 11.7%(+19.6)#8 | 9.3%(+22.0)#737 |
| 9. | Norton Center | 31.2% | 11.7%(+19.5)#9 | 9.3%(+21.9)#752 |
| 10. | Cambridge | 27.6% | 11.7%(+15.8)#10 | 9.3%(+18.2)#1,005 |
| 11. | Northfield | 27.5% | 11.7%(+15.7)#11 | 9.3%(+18.2)#1,013 |
| 12. | Northampton | 27.2% | 11.7%(+15.5)#12 | 9.3%(+17.9)#1,045 |
| 13. | Belchertown | 25.9% | 11.7%(+14.2)#13 | 9.3%(+16.6)#1,150 |
| 14. | West Warren | 23.7% | 11.7%(+12.0)#14 | 9.3%(+14.4)#1,412 |
| 15. | Rowley | 23.3% | 11.7%(+11.5)#15 | 9.3%(+14.0)#1,476 |
| 16. | West Falmouth | 22.3% | 11.7%(+10.5)#16 | 9.3%(+13.0)#1,641 |
| 17. | Russell | 22.3% | 11.7%(+10.5)#17 | 9.3%(+12.9)#1,642 |
| 18. | Cheshire | 21.2% | 11.7%(+9.44)#18 | 9.3%(+11.9)#1,831 |
| 19. | North Adams | 20.8% | 11.7%(+9.08)#19 | 9.3%(+11.5)#1,932 |
| 20. | Weweantic | 20.4% | 11.7%(+8.67)#20 | 9.3%(+11.1)#2,025 |
| 21. | Cedar Crest | 19.8% | 11.7%(+8.08)#21 | 9.3%(+10.5)#2,170 |
| 22. | Blandford | 19.7% | 11.7%(+7.91)#22 | 9.3%(+10.3)#2,217 |
| 23. | Lee | 19.5% | 11.7%(+7.80)#23 | 9.3%(+10.2)#2,247 |
| 24. | Mansfield Center | 18.8% | 11.7%(+7.03)#24 | 9.3%(+9.47)#2,458 |
| 25. | Somerville | 18.6% | 11.7%(+6.90)#25 | 9.3%(+9.33)#2,503 |
| 26. | South Lancaster | 18.6% | 11.7%(+6.82)#26 | 9.3%(+9.25)#2,544 |
| 27. | Brookline | 18.4% | 11.7%(+6.67)#27 | 9.3%(+9.10)#2,595 |
| 28. | Millers Falls | 18.3% | 11.7%(+6.53)#28 | 9.3%(+8.97)#2,652 |
| 29. | Andover | 18.2% | 11.7%(+6.43)#29 | 9.3%(+8.86)#2,701 |
| 30. | Ayer | 18.0% | 11.7%(+6.26)#30 | 9.3%(+8.69)#2,749 |
| 31. | Newton | 17.9% | 11.7%(+6.19)#31 | 9.3%(+8.63)#2,773 |
| 32. | Easthampton Town | 17.9% | 11.7%(+6.18)#32 | 9.3%(+8.61)#2,782 |
| 33. | Wellesley | 17.8% | 11.7%(+6.04)#33 | 9.3%(+8.48)#2,823 |
| 34. | Shirley | 17.4% | 11.7%(+5.63)#34 | 9.3%(+8.07)#2,995 |
| 35. | Essex | 17.2% | 11.7%(+5.41)#35 | 9.3%(+7.85)#3,093 |
| 36. | Arlington | 16.9% | 11.7%(+5.18)#36 | 9.3%(+7.62)#3,204 |
| 37. | East Brookfield | 16.9% | 11.7%(+5.14)#37 | 9.3%(+7.58)#3,221 |
| 38. | Belmont | 16.9% | 11.7%(+5.10)#38 | 9.3%(+7.54)#3,245 |
| 39. | North Falmouth | 16.7% | 11.7%(+4.99)#39 | 9.3%(+7.42)#3,294 |
| 40. | Green Harbor | 16.6% | 11.7%(+4.80)#40 | 9.3%(+7.24)#3,431 |
| 41. | Boxford | 16.5% | 11.7%(+4.77)#41 | 9.3%(+7.21)#3,444 |
| 42. | South Deerfield | 16.3% | 11.7%(+4.54)#42 | 9.3%(+6.97)#3,544 |
| 43. | Watertown Town | 16.2% | 11.7%(+4.44)#43 | 9.3%(+6.88)#3,609 |
| 44. | Oxford | 15.9% | 11.7%(+4.11)#44 | 9.3%(+6.54)#3,791 |
| 45. | Needham | 15.7% | 11.7%(+3.90)#45 | 9.3%(+6.34)#3,907 |
| 46. | Milton | 15.5% | 11.7%(+3.80)#46 | 9.3%(+6.23)#3,976 |
| 47. | Waltham | 15.2% | 11.7%(+3.48)#47 | 9.3%(+5.92)#4,167 |
| 48. | Westfield | 15.2% | 11.7%(+3.47)#48 | 9.3%(+5.90)#4,174 |
| 49. | Beverly | 15.2% | 11.7%(+3.46)#49 | 9.3%(+5.90)#4,182 |
| 50. | Great Barrington | 15.1% | 11.7%(+3.37)#50 | 9.3%(+5.80)#4,220 |
| 51. | Millis Clicquot | 15.1% | 11.7%(+3.35)#51 | 9.3%(+5.79)#4,230 |
| 52. | North Pembroke | 15.0% | 11.7%(+3.28)#52 | 9.3%(+5.72)#4,276 |
| 53. | Northwest Harwich | 15.0% | 11.7%(+3.27)#53 | 9.3%(+5.70)#4,284 |
| 54. | Rockport | 14.8% | 11.7%(+3.07)#54 | 9.3%(+5.50)#4,422 |
| 55. | Greenfield | 14.8% | 11.7%(+3.05)#55 | 9.3%(+5.48)#4,441 |
| 56. | Hanscom Afb | 14.7% | 11.7%(+2.99)#56 | 9.3%(+5.42)#4,483 |
| 57. | Hatfield | 14.6% | 11.7%(+2.81)#57 | 9.3%(+5.24)#4,634 |
| 58. | Hopedale | 14.5% | 11.7%(+2.76)#58 | 9.3%(+5.20)#4,671 |
| 59. | Falmouth | 14.2% | 11.7%(+2.40)#59 | 9.3%(+4.84)#4,972 |
| 60. | Hull | 14.1% | 11.7%(+2.37)#60 | 9.3%(+4.81)#4,993 |
| 61. | North Scituate | 14.1% | 11.7%(+2.35)#61 | 9.3%(+4.78)#5,013 |
| 62. | Groton | 14.1% | 11.7%(+2.33)#62 | 9.3%(+4.76)#5,028 |
| 63. | Northborough | 14.0% | 11.7%(+2.23)#63 | 9.3%(+4.67)#5,135 |
| 64. | Turners Falls | 13.9% | 11.7%(+2.13)#64 | 9.3%(+4.56)#5,214 |
| 65. | Holyoke | 13.9% | 11.7%(+2.11)#65 | 9.3%(+4.55)#5,224 |
| 66. | Littleton Common | 13.8% | 11.7%(+2.08)#66 | 9.3%(+4.52)#5,253 |
| 67. | Longmeadow | 13.8% | 11.7%(+2.05)#67 | 9.3%(+4.48)#5,277 |
| 68. | Sharon | 13.7% | 11.7%(+1.96)#68 | 9.3%(+4.39)#5,353 |
| 69. | North Brookfield | 13.7% | 11.7%(+1.90)#69 | 9.3%(+4.34)#5,393 |
| 70. | Worcester | 13.5% | 11.7%(+1.78)#70 | 9.3%(+4.21)#5,508 |
| 71. | Cochituate | 13.5% | 11.7%(+1.76)#71 | 9.3%(+4.20)#5,515 |
| 72. | South Dennis | 13.4% | 11.7%(+1.65)#72 | 9.3%(+4.08)#5,616 |
| 73. | Reading | 13.4% | 11.7%(+1.65)#73 | 9.3%(+4.08)#5,618 |
| 74. | Boston | 13.3% | 11.7%(+1.56)#74 | 9.3%(+4.00)#5,701 |
| 75. | Marshfield Hills | 13.3% | 11.7%(+1.55)#75 | 9.3%(+3.98)#5,719 |
| 76. | Orleans | 13.3% | 11.7%(+1.55)#76 | 9.3%(+3.98)#5,720 |
| 77. | Shelburne Falls | 13.3% | 11.7%(+1.51)#77 | 9.3%(+3.94)#5,758 |
| 78. | West Concord | 13.2% | 11.7%(+1.42)#78 | 9.3%(+3.85)#5,844 |
| 79. | Salisbury | 13.1% | 11.7%(+1.38)#79 | 9.3%(+3.82)#5,881 |
| 80. | East Pepperell | 12.9% | 11.7%(+1.17)#80 | 9.3%(+3.60)#6,108 |
| 81. | Dedham | 12.9% | 11.7%(+1.15)#81 | 9.3%(+3.58)#6,141 |
| 82. | Medford | 12.9% | 11.7%(+1.14)#82 | 9.3%(+3.57)#6,156 |
| 83. | Wilbraham | 12.8% | 11.7%(+1.08)#83 | 9.3%(+3.51)#6,207 |
| 84. | Onset | 12.8% | 11.7%(+1.01)#84 | 9.3%(+3.44)#6,267 |
| 85. | Swampscott | 12.6% | 11.7%(+0.846)#85 | 9.3%(+3.28)#6,429 |
| 86. | Scituate | 12.6% | 11.7%(+0.822)#86 | 9.3%(+3.26)#6,453 |
| 87. | Dennis | 12.4% | 11.7%(+0.687)#87 | 9.3%(+3.12)#6,636 |
| 88. | Braintree Town | 12.4% | 11.7%(+0.682)#88 | 9.3%(+3.12)#6,649 |
| 89. | North Eastham | 12.4% | 11.7%(+0.604)#89 | 9.3%(+3.04)#6,722 |
| 90. | Mashpee Neck | 12.3% | 11.7%(+0.600)#90 | 9.3%(+3.03)#6,724 |
| 91. | Gardner | 12.2% | 11.7%(+0.493)#91 | 9.3%(+2.93)#6,867 |
| 92. | Yarmouth Port | 12.1% | 11.7%(+0.364)#92 | 9.3%(+2.80)#7,028 |
| 93. | Forestdale | 12.1% | 11.7%(+0.335)#93 | 9.3%(+2.77)#7,069 |
| 94. | East Sandwich | 12.1% | 11.7%(+0.315)#94 | 9.3%(+2.75)#7,094 |
| 95. | Orange | 12.1% | 11.7%(+0.311)#95 | 9.3%(+2.74)#7,100 |
| 96. | The Pinehills | 12.0% | 11.7%(+0.246)#96 | 9.3%(+2.68)#7,185 |
| 97. | Adams | 11.9% | 11.7%(+0.195)#97 | 9.3%(+2.63)#7,247 |
| 98. | Newburyport | 11.9% | 11.7%(+0.150)#98 | 9.3%(+2.58)#7,301 |
| 99. | Marshfield | 11.8% | 11.7%(+0.094)#99 | 9.3%(+2.53)#7,366 |
| 100. | Wakefield | 11.8% | 11.7%(+0.043)#100 | 9.3%(+2.48)#7,444 |
Common Questions
What are the Top 10 Cities with the Highest Percentage of Population Employed in Educational Services in Massachusetts?
Top 10 Cities with the Highest Percentage of Population Employed in Educational Services in Massachusetts are:
#1
62.4%
#2
59.6%
#3
37.0%
#4
33.6%
#5
33.5%
#6
31.5%
#7
31.3%
#8
31.2%
#9
27.6%
#10
27.5%
What city has the Highest Percentage of Population Employed in Educational Services in Massachusetts?
Williamstown has the Highest Percentage of Population Employed in Educational Services in Massachusetts with 62.4%.
What is the Percentage of Population Employed in Educational Services in the State of Massachusetts?
Percentage of Population Employed in Educational Services in Massachusetts is 11.7%.
What is the Percentage of Population Employed in Educational Services in the United States?
Percentage of Population Employed in Educational Services in the United States is 9.3%.