Cities with the Highest Percentage of Population Employed in Educational Services in Texas
RELATED REPORTS & OPTIONS
Educational Services
Texas
Compare Cities
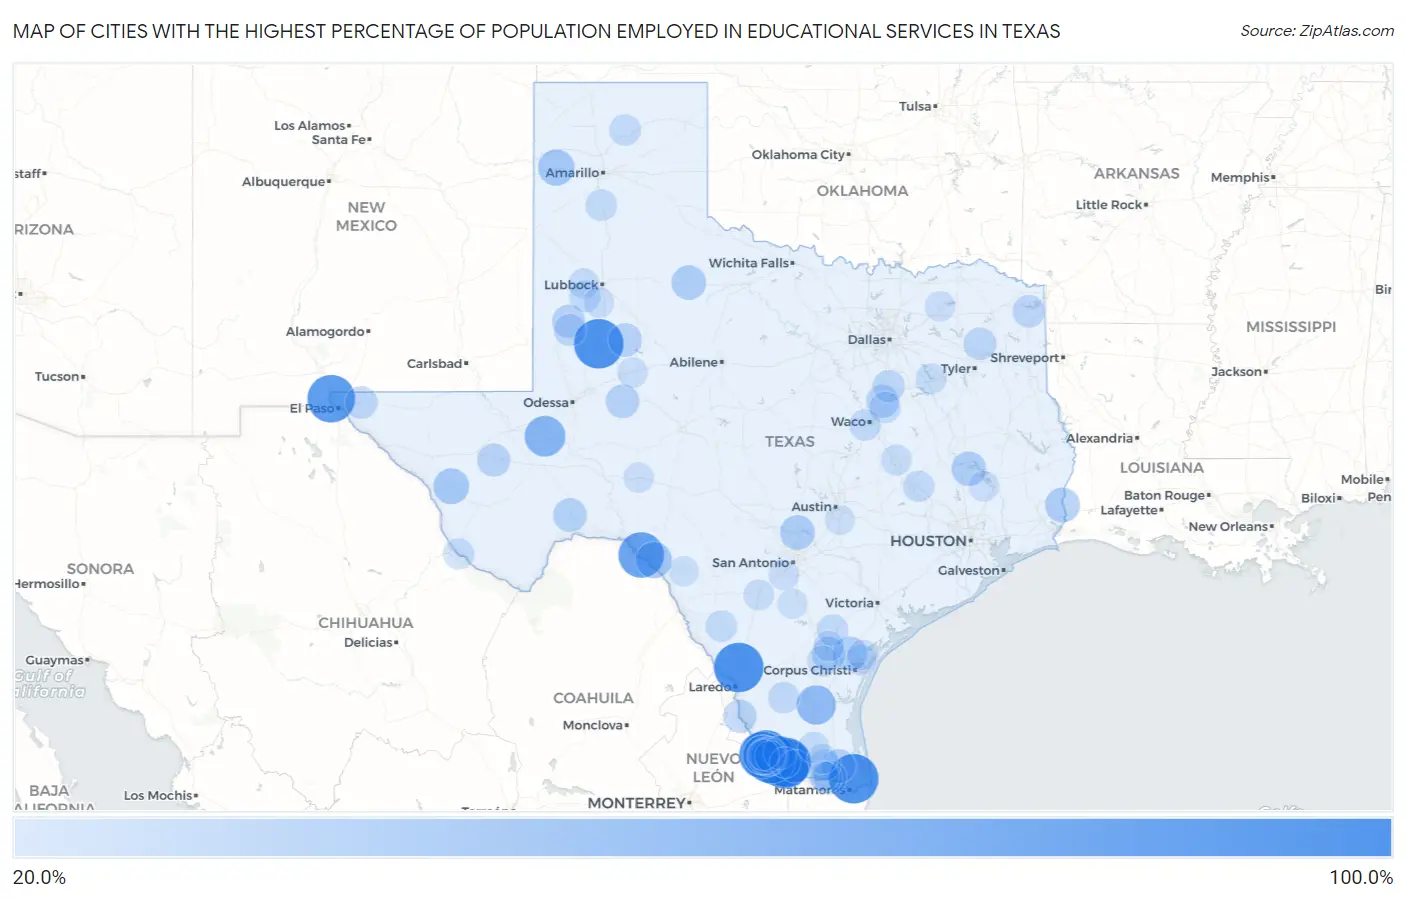
Map of Cities with the Highest Percentage of Population Employed in Educational Services in Texas
0.0%
100.0%
Cities with the Highest Percentage of Population Employed in Educational Services in Texas
| City | % Employed | vs State | vs National | |
| 1. | Chaparrito | 100.0% | 9.6%(+90.4)#1 | 9.3%(+90.7)#2 |
| 2. | North Escobares | 100.0% | 9.6%(+90.4)#2 | 9.3%(+90.7)#3 |
| 3. | Del Mar Heights | 100.0% | 9.6%(+90.4)#3 | 9.3%(+90.7)#9 |
| 4. | Sunset Cdp Starr County | 100.0% | 9.6%(+90.4)#5 | 9.3%(+90.7)#13 |
| 5. | Longoria | 100.0% | 9.6%(+90.4)#6 | 9.3%(+90.7)#14 |
| 6. | Sunset Acres | 100.0% | 9.6%(+90.4)#7 | 9.3%(+90.7)#26 |
| 7. | La Paloma Ranchettes | 100.0% | 9.6%(+90.4)#8 | 9.3%(+90.7)#27 |
| 8. | Santel | 100.0% | 9.6%(+90.4)#9 | 9.3%(+90.7)#36 |
| 9. | Los Ybanez | 100.0% | 9.6%(+90.4)#10 | 9.3%(+90.7)#37 |
| 10. | Prado Verde | 92.5% | 9.6%(+82.9)#11 | 9.3%(+83.2)#42 |
| 11. | Evergreen | 88.1% | 9.6%(+78.5)#12 | 9.3%(+78.8)#43 |
| 12. | Sheffield | 86.4% | 9.6%(+76.8)#13 | 9.3%(+77.0)#44 |
| 13. | Box Canyon | 84.2% | 9.6%(+74.6)#14 | 9.3%(+74.9)#46 |
| 14. | Salineno | 79.2% | 9.6%(+69.6)#15 | 9.3%(+69.9)#52 |
| 15. | Grandfalls | 64.4% | 9.6%(+54.8)#16 | 9.3%(+55.1)#92 |
| 16. | San Juan | 60.9% | 9.6%(+51.3)#17 | 9.3%(+51.6)#110 |
| 17. | Ramos | 60.0% | 9.6%(+50.4)#18 | 9.3%(+50.7)#116 |
| 18. | Airport Road Addition | 58.5% | 9.6%(+49.0)#19 | 9.3%(+49.2)#127 |
| 19. | Fronton Ranchettes | 56.7% | 9.6%(+47.1)#20 | 9.3%(+47.4)#141 |
| 20. | Rancho Viejo | 56.4% | 9.6%(+46.8)#21 | 9.3%(+47.0)#143 |
| 21. | Salineno North | 52.4% | 9.6%(+42.8)#22 | 9.3%(+43.1)#180 |
| 22. | Lake View | 47.0% | 9.6%(+37.4)#23 | 9.3%(+37.7)#249 |
| 23. | Adrian | 46.8% | 9.6%(+37.2)#24 | 9.3%(+37.5)#253 |
| 24. | Harrold | 46.7% | 9.6%(+37.1)#25 | 9.3%(+37.4)#257 |
| 25. | J F Villareal | 45.7% | 9.6%(+36.2)#26 | 9.3%(+36.4)#275 |
| 26. | Mcleod | 45.2% | 9.6%(+35.6)#27 | 9.3%(+35.9)#284 |
| 27. | Valentine | 44.4% | 9.6%(+34.9)#28 | 9.3%(+35.1)#291 |
| 28. | Richards | 43.9% | 9.6%(+34.3)#29 | 9.3%(+34.6)#306 |
| 29. | Miguel Barrera | 43.6% | 9.6%(+34.1)#30 | 9.3%(+34.3)#313 |
| 30. | Los Ebanos Cdp Starr County | 42.0% | 9.6%(+32.5)#31 | 9.3%(+32.7)#349 |
| 31. | Deweyville | 41.0% | 9.6%(+31.4)#32 | 9.3%(+31.7)#371 |
| 32. | Spring Branch | 40.9% | 9.6%(+31.4)#33 | 9.3%(+31.6)#372 |
| 33. | Riverside | 40.1% | 9.6%(+30.5)#34 | 9.3%(+30.8)#389 |
| 34. | Guthrie | 39.7% | 9.6%(+30.1)#35 | 9.3%(+30.4)#399 |
| 35. | Santo | 39.2% | 9.6%(+29.7)#36 | 9.3%(+29.9)#411 |
| 36. | Alamo Beach | 39.1% | 9.6%(+29.6)#37 | 9.3%(+29.8)#415 |
| 37. | Loma Linda | 38.8% | 9.6%(+29.2)#38 | 9.3%(+29.5)#426 |
| 38. | Kopperl | 38.3% | 9.6%(+28.7)#39 | 9.3%(+29.0)#441 |
| 39. | Lasana | 38.0% | 9.6%(+28.4)#40 | 9.3%(+28.7)#446 |
| 40. | Sanderson | 37.0% | 9.6%(+27.4)#41 | 9.3%(+27.7)#478 |
| 41. | Chula Vista Cdp Zavala County | 36.8% | 9.6%(+27.3)#42 | 9.3%(+27.5)#484 |
| 42. | Sandia | 36.7% | 9.6%(+27.1)#43 | 9.3%(+27.3)#494 |
| 43. | Gail | 36.4% | 9.6%(+26.8)#44 | 9.3%(+27.0)#505 |
| 44. | Garden City | 36.4% | 9.6%(+26.8)#45 | 9.3%(+27.0)#506 |
| 45. | Dennis | 36.0% | 9.6%(+26.5)#46 | 9.3%(+26.7)#518 |
| 46. | Rochelle | 35.5% | 9.6%(+25.9)#47 | 9.3%(+26.2)#538 |
| 47. | El Brazil | 35.3% | 9.6%(+25.7)#48 | 9.3%(+26.0)#555 |
| 48. | Wellman | 35.1% | 9.6%(+25.6)#49 | 9.3%(+25.8)#562 |
| 49. | San Ygnacio | 35.0% | 9.6%(+25.5)#50 | 9.3%(+25.7)#567 |
| 50. | Iglesia Antigua | 34.8% | 9.6%(+25.2)#51 | 9.3%(+25.5)#578 |
| 51. | Balmorhea | 34.6% | 9.6%(+25.0)#52 | 9.3%(+25.2)#592 |
| 52. | Penelope | 33.7% | 9.6%(+24.1)#53 | 9.3%(+24.3)#624 |
| 53. | Douglassville | 32.7% | 9.6%(+23.2)#54 | 9.3%(+23.4)#676 |
| 54. | Holly Lake Ranch | 32.7% | 9.6%(+23.2)#55 | 9.3%(+23.4)#677 |
| 55. | La Joya | 32.6% | 9.6%(+23.0)#56 | 9.3%(+23.2)#685 |
| 56. | Butterfield | 32.4% | 9.6%(+22.9)#57 | 9.3%(+23.1)#691 |
| 57. | Whitharral | 32.4% | 9.6%(+22.9)#58 | 9.3%(+23.1)#693 |
| 58. | Frost | 31.2% | 9.6%(+21.6)#59 | 9.3%(+21.9)#754 |
| 59. | Loop | 30.9% | 9.6%(+21.3)#60 | 9.3%(+21.6)#773 |
| 60. | Las Lomitas | 29.0% | 9.6%(+19.5)#61 | 9.3%(+19.7)#884 |
| 61. | Asherton | 28.9% | 9.6%(+19.4)#62 | 9.3%(+19.6)#887 |
| 62. | Happy | 28.7% | 9.6%(+19.2)#63 | 9.3%(+19.4)#906 |
| 63. | Ropesville | 28.6% | 9.6%(+19.0)#64 | 9.3%(+19.3)#914 |
| 64. | South Frydek | 28.6% | 9.6%(+19.0)#65 | 9.3%(+19.3)#916 |
| 65. | Mount Calm | 28.3% | 9.6%(+18.7)#66 | 9.3%(+19.0)#943 |
| 66. | Woodway | 28.3% | 9.6%(+18.7)#67 | 9.3%(+19.0)#948 |
| 67. | Stinnett | 28.2% | 9.6%(+18.6)#68 | 9.3%(+18.9)#953 |
| 68. | Laguna Seca | 28.2% | 9.6%(+18.6)#69 | 9.3%(+18.9)#956 |
| 69. | Washburn | 28.1% | 9.6%(+18.5)#70 | 9.3%(+18.8)#965 |
| 70. | College Station | 28.1% | 9.6%(+18.5)#71 | 9.3%(+18.8)#967 |
| 71. | Blue Berry Hill | 28.1% | 9.6%(+18.5)#72 | 9.3%(+18.7)#968 |
| 72. | Poetry | 27.9% | 9.6%(+18.3)#73 | 9.3%(+18.6)#981 |
| 73. | Rice Tracts | 27.8% | 9.6%(+18.2)#74 | 9.3%(+18.5)#986 |
| 74. | Relampago | 27.6% | 9.6%(+18.0)#75 | 9.3%(+18.2)#1,006 |
| 75. | Linn | 27.6% | 9.6%(+18.0)#76 | 9.3%(+18.2)#1,007 |
| 76. | Presidio | 26.7% | 9.6%(+17.1)#77 | 9.3%(+17.4)#1,081 |
| 77. | Calvert | 26.2% | 9.6%(+16.6)#78 | 9.3%(+16.8)#1,130 |
| 78. | Wadsworth | 26.1% | 9.6%(+16.5)#79 | 9.3%(+16.8)#1,133 |
| 79. | South La Paloma | 26.1% | 9.6%(+16.5)#80 | 9.3%(+16.8)#1,135 |
| 80. | Smyer | 25.8% | 9.6%(+16.3)#81 | 9.3%(+16.5)#1,158 |
| 81. | Beauxart Gardens | 25.8% | 9.6%(+16.2)#82 | 9.3%(+16.5)#1,162 |
| 82. | Star Harbor | 25.6% | 9.6%(+16.1)#83 | 9.3%(+16.3)#1,185 |
| 83. | North Pearsall | 25.3% | 9.6%(+15.8)#84 | 9.3%(+16.0)#1,217 |
| 84. | Coldspring | 25.1% | 9.6%(+15.5)#85 | 9.3%(+15.8)#1,231 |
| 85. | New Home | 25.0% | 9.6%(+15.4)#86 | 9.3%(+15.7)#1,242 |
| 86. | Pablo Pena | 25.0% | 9.6%(+15.4)#87 | 9.3%(+15.7)#1,244 |
| 87. | Lakeshore Gardens Hidden Acres | 24.9% | 9.6%(+15.3)#88 | 9.3%(+15.5)#1,266 |
| 88. | Gregory | 24.8% | 9.6%(+15.3)#89 | 9.3%(+15.5)#1,267 |
| 89. | Coahoma | 24.7% | 9.6%(+15.1)#90 | 9.3%(+15.4)#1,282 |
| 90. | Commerce | 24.7% | 9.6%(+15.1)#91 | 9.3%(+15.4)#1,285 |
| 91. | Somerset | 24.6% | 9.6%(+15.0)#92 | 9.3%(+15.2)#1,299 |
| 92. | Ozona | 24.2% | 9.6%(+14.6)#93 | 9.3%(+14.9)#1,343 |
| 93. | Benjamin Perez | 24.1% | 9.6%(+14.6)#94 | 9.3%(+14.8)#1,352 |
| 94. | Tradewinds | 24.1% | 9.6%(+14.5)#95 | 9.3%(+14.8)#1,355 |
| 95. | Fort Clark Springs | 23.9% | 9.6%(+14.3)#96 | 9.3%(+14.6)#1,375 |
| 96. | Christine | 23.7% | 9.6%(+14.2)#97 | 9.3%(+14.4)#1,408 |
| 97. | Roma | 23.4% | 9.6%(+13.9)#98 | 9.3%(+14.1)#1,456 |
| 98. | Progreso | 23.3% | 9.6%(+13.7)#99 | 9.3%(+13.9)#1,480 |
| 99. | Monte Alto | 23.3% | 9.6%(+13.7)#100 | 9.3%(+13.9)#1,482 |
| 100. | Mustang Ridge | 23.2% | 9.6%(+13.7)#101 | 9.3%(+13.9)#1,485 |
Common Questions
What are the Top 10 Cities with the Highest Percentage of Population Employed in Educational Services in Texas?
Top 10 Cities with the Highest Percentage of Population Employed in Educational Services in Texas are:
#1
100.0%
#2
100.0%
#3
100.0%
#4
100.0%
#5
100.0%
#6
100.0%
#7
100.0%
#8
100.0%
#9
92.5%
#10
88.1%
What city has the Highest Percentage of Population Employed in Educational Services in Texas?
Chaparrito has the Highest Percentage of Population Employed in Educational Services in Texas with 100.0%.
What is the Percentage of Population Employed in Educational Services in the State of Texas?
Percentage of Population Employed in Educational Services in Texas is 9.6%.
What is the Percentage of Population Employed in Educational Services in the United States?
Percentage of Population Employed in Educational Services in the United States is 9.3%.