Cities with the Highest Percentage of Population Employed in Educational Services in Vermont
RELATED REPORTS & OPTIONS
Educational Services
Vermont
Compare Cities
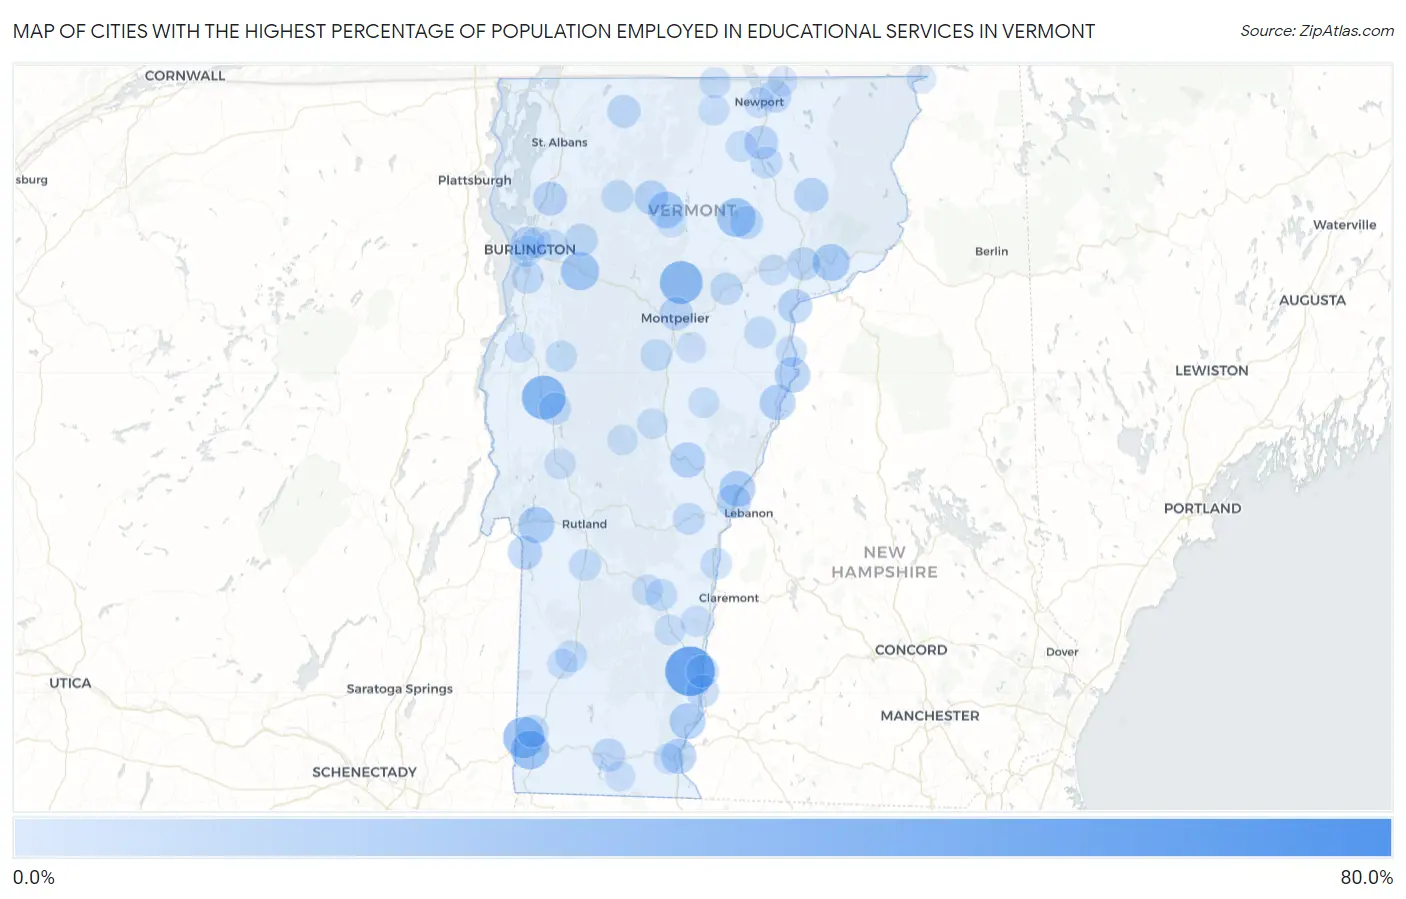
Map of Cities with the Highest Percentage of Population Employed in Educational Services in Vermont
0.0%
80.0%
Cities with the Highest Percentage of Population Employed in Educational Services in Vermont
| City | % Employed | vs State | vs National | |
| 1. | Huntington Center | 68.8% | 13.3%(+55.5)#1 | 9.3%(+59.5)#75 |
| 2. | Saxtons River | 53.0% | 13.3%(+39.7)#2 | 9.3%(+43.7)#173 |
| 3. | Lyndon Center | 44.4% | 13.3%(+31.2)#3 | 9.3%(+35.1)#290 |
| 4. | Peacham | 42.9% | 13.3%(+29.6)#4 | 9.3%(+33.5)#323 |
| 5. | East Poultney | 42.4% | 13.3%(+29.1)#5 | 9.3%(+33.1)#341 |
| 6. | Middlebury | 40.1% | 13.3%(+26.8)#6 | 9.3%(+30.8)#390 |
| 7. | Worcester | 37.8% | 13.3%(+24.5)#7 | 9.3%(+28.5)#453 |
| 8. | North Bennington | 34.1% | 13.3%(+20.8)#8 | 9.3%(+24.8)#612 |
| 9. | South Hero | 31.9% | 13.3%(+18.6)#9 | 9.3%(+22.6)#711 |
| 10. | Bakersfield | 30.2% | 13.3%(+16.9)#10 | 9.3%(+20.9)#815 |
| 11. | Old Bennington | 28.9% | 13.3%(+15.6)#11 | 9.3%(+19.6)#891 |
| 12. | Jamaica | 28.8% | 13.3%(+15.6)#12 | 9.3%(+19.5)#897 |
| 13. | Greensboro | 28.6% | 13.3%(+15.3)#13 | 9.3%(+19.3)#922 |
| 14. | Richmond | 27.9% | 13.3%(+14.6)#14 | 9.3%(+18.6)#977 |
| 15. | Concord | 25.2% | 13.3%(+11.9)#15 | 9.3%(+15.9)#1,224 |
| 16. | Hyde Park | 24.4% | 13.3%(+11.1)#16 | 9.3%(+15.1)#1,315 |
| 17. | Castleton | 23.7% | 13.3%(+10.4)#17 | 9.3%(+14.4)#1,424 |
| 18. | Norwich | 22.8% | 13.3%(+9.54)#18 | 9.3%(+13.5)#1,545 |
| 19. | Putney | 22.8% | 13.3%(+9.54)#19 | 9.3%(+13.5)#1,546 |
| 20. | Bradford | 22.2% | 13.3%(+8.95)#20 | 9.3%(+12.9)#1,644 |
| 21. | Weston | 22.2% | 13.3%(+8.93)#21 | 9.3%(+12.9)#1,655 |
| 22. | Newbury | 21.6% | 13.3%(+8.33)#22 | 9.3%(+12.3)#1,752 |
| 23. | South Royalton | 21.3% | 13.3%(+7.99)#23 | 9.3%(+12.0)#1,817 |
| 24. | Brattleboro | 21.1% | 13.3%(+7.83)#24 | 9.3%(+11.8)#1,850 |
| 25. | Barnet | 19.4% | 13.3%(+6.06)#25 | 9.3%(+10.0)#2,296 |
| 26. | West Burke | 19.1% | 13.3%(+5.83)#26 | 9.3%(+9.80)#2,358 |
| 27. | Poultney | 19.1% | 13.3%(+5.81)#27 | 9.3%(+9.78)#2,363 |
| 28. | Johnson | 19.0% | 13.3%(+5.74)#28 | 9.3%(+9.72)#2,383 |
| 29. | Milton | 19.0% | 13.3%(+5.70)#29 | 9.3%(+9.68)#2,388 |
| 30. | Wilder | 18.8% | 13.3%(+5.53)#30 | 9.3%(+9.51)#2,441 |
| 31. | Burlington | 18.8% | 13.3%(+5.49)#31 | 9.3%(+9.46)#2,460 |
| 32. | Orleans | 17.8% | 13.3%(+4.53)#32 | 9.3%(+8.50)#2,814 |
| 33. | Montpelier | 17.7% | 13.3%(+4.41)#33 | 9.3%(+8.38)#2,865 |
| 34. | Highgate Center | 17.5% | 13.3%(+4.21)#34 | 9.3%(+8.18)#2,939 |
| 35. | Gilman | 17.4% | 13.3%(+4.15)#35 | 9.3%(+8.13)#2,966 |
| 36. | Greensboro Bend | 17.3% | 13.3%(+3.97)#36 | 9.3%(+7.95)#3,051 |
| 37. | St Johnsbury | 17.1% | 13.3%(+3.80)#37 | 9.3%(+7.78)#3,134 |
| 38. | Wilmington | 16.7% | 13.3%(+3.38)#38 | 9.3%(+7.35)#3,331 |
| 39. | West Dummerston | 16.7% | 13.3%(+3.38)#39 | 9.3%(+7.35)#3,363 |
| 40. | Hanksville | 16.7% | 13.3%(+3.38)#40 | 9.3%(+7.35)#3,371 |
| 41. | Enosburg Falls | 16.5% | 13.3%(+3.18)#41 | 9.3%(+7.15)#3,472 |
| 42. | Westminster | 16.0% | 13.3%(+2.69)#42 | 9.3%(+6.67)#3,729 |
| 43. | South Lincoln | 15.9% | 13.3%(+2.60)#43 | 9.3%(+6.57)#3,778 |
| 44. | Jericho | 15.9% | 13.3%(+2.56)#44 | 9.3%(+6.54)#3,796 |
| 45. | Bellows Falls | 15.8% | 13.3%(+2.52)#45 | 9.3%(+6.49)#3,822 |
| 46. | Derby Center | 15.7% | 13.3%(+2.38)#46 | 9.3%(+6.36)#3,897 |
| 47. | Sheffield | 15.6% | 13.3%(+2.33)#47 | 9.3%(+6.31)#3,922 |
| 48. | South Shaftsbury | 15.6% | 13.3%(+2.30)#48 | 9.3%(+6.27)#3,940 |
| 49. | Jeffersonville | 15.3% | 13.3%(+2.06)#49 | 9.3%(+6.03)#4,108 |
| 50. | Marshfield | 15.1% | 13.3%(+1.84)#50 | 9.3%(+5.82)#4,211 |
| 51. | Bolton Valley | 15.0% | 13.3%(+1.75)#51 | 9.3%(+5.72)#4,273 |
| 52. | East Middlebury | 15.0% | 13.3%(+1.74)#52 | 9.3%(+5.72)#4,274 |
| 53. | Shelburne | 14.8% | 13.3%(+1.47)#53 | 9.3%(+5.44)#4,468 |
| 54. | Woodstock | 14.7% | 13.3%(+1.39)#54 | 9.3%(+5.37)#4,529 |
| 55. | East Charlotte | 14.6% | 13.3%(+1.34)#55 | 9.3%(+5.32)#4,561 |
| 56. | Northfield | 14.6% | 13.3%(+1.28)#56 | 9.3%(+5.26)#4,624 |
| 57. | Middletown Springs | 14.5% | 13.3%(+1.18)#57 | 9.3%(+5.16)#4,697 |
| 58. | Barton | 14.2% | 13.3%(+0.935)#58 | 9.3%(+4.91)#4,924 |
| 59. | Proctorsville | 14.1% | 13.3%(+0.786)#59 | 9.3%(+4.76)#5,030 |
| 60. | Manchester Center | 14.0% | 13.3%(+0.738)#60 | 9.3%(+4.71)#5,084 |
| 61. | Wallingford | 14.0% | 13.3%(+0.735)#61 | 9.3%(+4.71)#5,087 |
| 62. | Groton | 13.9% | 13.3%(+0.653)#62 | 9.3%(+4.63)#5,164 |
| 63. | South Burlington | 13.4% | 13.3%(+0.092)#63 | 9.3%(+4.07)#5,628 |
| 64. | Stratton Mountain | 13.3% | 13.3%(+0.042)#64 | 9.3%(+4.02)#5,682 |
| 65. | Bristol | 13.3% | 13.3%(+0.009)#65 | 9.3%(+3.99)#5,714 |
| 66. | Essex Junction | 13.2% | 13.3%(-0.056)#66 | 9.3%(+3.92)#5,779 |
| 67. | Underhill Flats | 13.2% | 13.3%(-0.140)#67 | 9.3%(+3.84)#5,858 |
| 68. | Windsor | 13.1% | 13.3%(-0.212)#68 | 9.3%(+3.76)#5,921 |
| 69. | South Londonderry | 12.9% | 13.3%(-0.388)#69 | 9.3%(+3.59)#6,132 |
| 70. | Westford | 12.9% | 13.3%(-0.388)#70 | 9.3%(+3.59)#6,133 |
| 71. | Wells River | 12.7% | 13.3%(-0.580)#71 | 9.3%(+3.40)#6,316 |
| 72. | Brandon | 12.7% | 13.3%(-0.612)#72 | 9.3%(+3.36)#6,351 |
| 73. | Lunenburg | 12.6% | 13.3%(-0.693)#73 | 9.3%(+3.28)#6,427 |
| 74. | Ludlow | 12.5% | 13.3%(-0.759)#74 | 9.3%(+3.22)#6,500 |
| 75. | Irasburg | 12.5% | 13.3%(-0.791)#75 | 9.3%(+3.18)#6,553 |
| 76. | St. George | 12.4% | 13.3%(-0.851)#76 | 9.3%(+3.12)#6,633 |
| 77. | North Troy | 12.3% | 13.3%(-0.978)#77 | 9.3%(+3.00)#6,771 |
| 78. | Stamford | 12.3% | 13.3%(-1.00)#78 | 9.3%(+2.97)#6,800 |
| 79. | Springfield | 12.3% | 13.3%(-1.03)#79 | 9.3%(+2.94)#6,841 |
| 80. | Troy | 12.2% | 13.3%(-1.10)#80 | 9.3%(+2.88)#6,925 |
| 81. | Chester | 12.2% | 13.3%(-1.12)#81 | 9.3%(+2.85)#6,954 |
| 82. | Winooski | 11.9% | 13.3%(-1.36)#82 | 9.3%(+2.62)#7,263 |
| 83. | Chelsea | 11.8% | 13.3%(-1.53)#83 | 9.3%(+2.45)#7,468 |
| 84. | Randolph | 11.8% | 13.3%(-1.54)#84 | 9.3%(+2.44)#7,498 |
| 85. | Danville | 11.7% | 13.3%(-1.57)#85 | 9.3%(+2.40)#7,544 |
| 86. | West Brattleboro | 11.7% | 13.3%(-1.60)#86 | 9.3%(+2.37)#7,587 |
| 87. | Rochester | 11.7% | 13.3%(-1.64)#87 | 9.3%(+2.34)#7,639 |
| 88. | North Pownal | 11.5% | 13.3%(-1.78)#88 | 9.3%(+2.20)#7,827 |
| 89. | Huntington | 11.5% | 13.3%(-1.79)#89 | 9.3%(+2.18)#7,842 |
| 90. | Manchester | 11.4% | 13.3%(-1.93)#90 | 9.3%(+2.05)#8,034 |
| 91. | Newport | 11.3% | 13.3%(-1.99)#91 | 9.3%(+1.98)#8,119 |
| 92. | South Barre | 11.0% | 13.3%(-2.30)#92 | 9.3%(+1.67)#8,624 |
| 93. | Pawlet | 10.9% | 13.3%(-2.37)#93 | 9.3%(+1.61)#8,713 |
| 94. | Jacksonville | 10.8% | 13.3%(-2.54)#94 | 9.3%(+1.44)#8,992 |
| 95. | Sutton | 10.8% | 13.3%(-2.54)#95 | 9.3%(+1.44)#8,993 |
| 96. | Derby Line | 10.7% | 13.3%(-2.64)#96 | 9.3%(+1.34)#9,128 |
| 97. | Vergennes | 10.4% | 13.3%(-2.85)#97 | 9.3%(+1.13)#9,478 |
| 98. | Morrisville | 10.3% | 13.3%(-2.94)#98 | 9.3%(+1.03)#9,640 |
| 99. | West Woodstock | 10.3% | 13.3%(-2.98)#99 | 9.3%(+0.999)#9,710 |
| 100. | Beecher Falls | 10.3% | 13.3%(-3.03)#100 | 9.3%(+0.941)#9,802 |
1
2Common Questions
What are the Top 10 Cities with the Highest Percentage of Population Employed in Educational Services in Vermont?
Top 10 Cities with the Highest Percentage of Population Employed in Educational Services in Vermont are:
#1
53.0%
#2
40.1%
#3
37.8%
#4
34.1%
#5
28.9%
#6
28.6%
#7
27.9%
#8
25.2%
#9
24.4%
#10
23.7%
What city has the Highest Percentage of Population Employed in Educational Services in Vermont?
Saxtons River has the Highest Percentage of Population Employed in Educational Services in Vermont with 53.0%.
What is the Percentage of Population Employed in Educational Services in the State of Vermont?
Percentage of Population Employed in Educational Services in Vermont is 13.3%.
What is the Percentage of Population Employed in Educational Services in the United States?
Percentage of Population Employed in Educational Services in the United States is 9.3%.