Mira Monte, CA Map & Demographics
Mira Monte Map
Mira Monte Overview
$45,770
PER CAPITA INCOME
$107,250
AVG FAMILY INCOME
$77,847
AVG HOUSEHOLD INCOME
39.9%
WAGE / INCOME GAP [ % ]
60.1¢/ $1
WAGE / INCOME GAP [ $ ]
0.47
INEQUALITY / GINI INDEX
6,837
TOTAL POPULATION
3,331
MALE POPULATION
3,506
FEMALE POPULATION
95.01
MALES / 100 FEMALES
105.25
FEMALES / 100 MALES
53.1
MEDIAN AGE
3.0
AVG FAMILY SIZE
2.4
AVG HOUSEHOLD SIZE
3,092
LABOR FORCE [ PEOPLE ]
50.4%
PERCENT IN LABOR FORCE
8.9%
UNEMPLOYMENT RATE
Income in Mira Monte
Income Overview in Mira Monte
Per Capita Income in Mira Monte is $45,770, while median incomes of families and households are $107,250 and $77,847 respectively.
| Characteristic | Number | Measure |
| Per Capita Income | 6,837 | $45,770 |
| Median Family Income | 1,706 | $107,250 |
| Mean Family Income | 1,706 | $130,328 |
| Median Household Income | 2,838 | $77,847 |
| Mean Household Income | 2,838 | $105,665 |
| Income Deficit | 1,706 | $0 |
| Wage / Income Gap (%) | 6,837 | 39.89% |
| Wage / Income Gap ($) | 6,837 | 60.11¢ per $1 |
| Gini / Inequality Index | 6,837 | 0.47 |
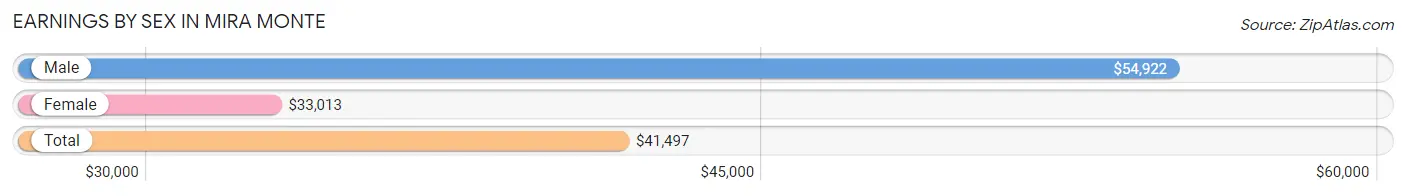
Earnings by Sex in Mira Monte
Average Earnings in Mira Monte are $41,497, $54,922 for men and $33,013 for women, a difference of 39.9%.
| Sex | Number | Average Earnings |
| Male | 1,662 (49.8%) | $54,922 |
| Female | 1,677 (50.2%) | $33,013 |
| Total | 3,339 (100.0%) | $41,497 |
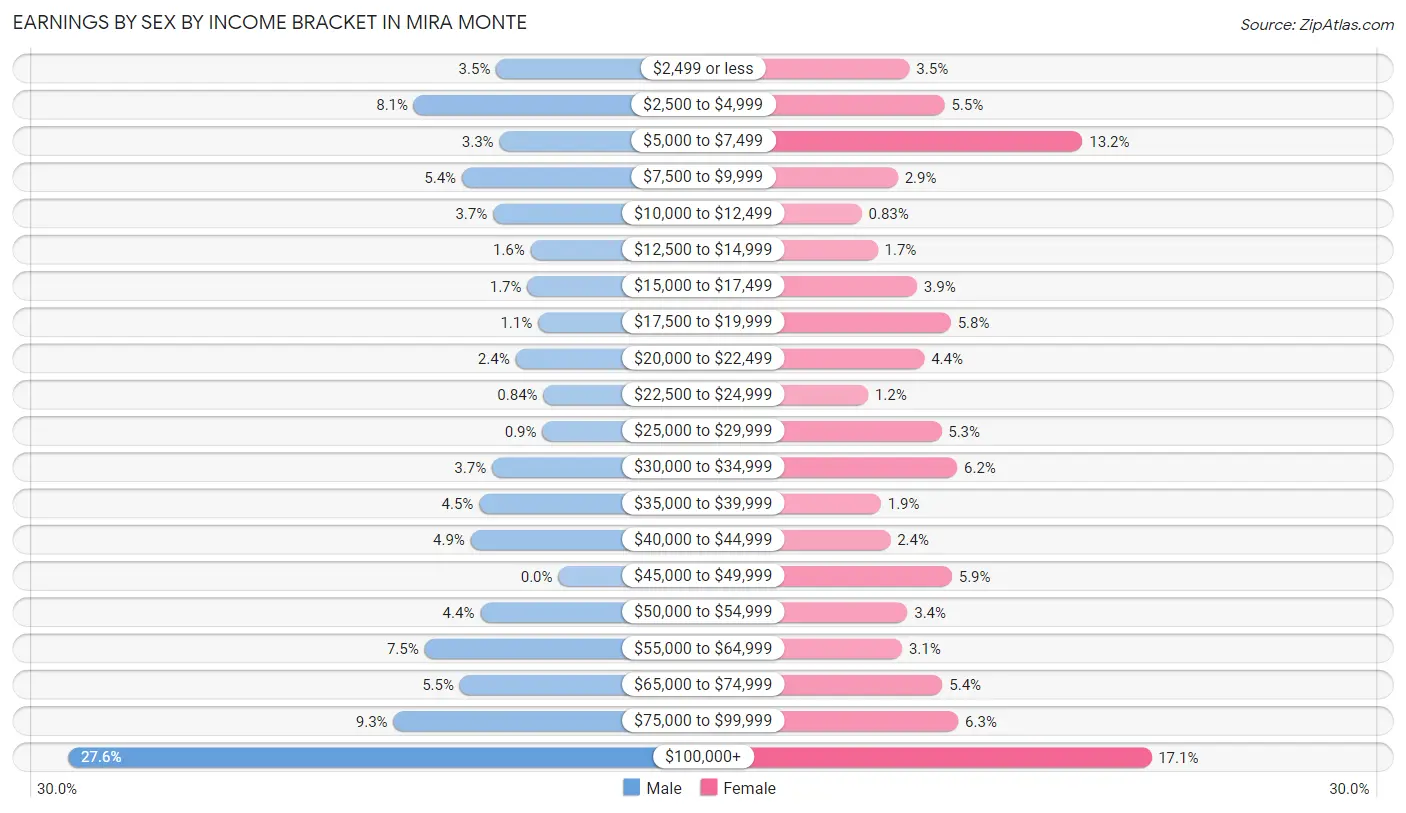
Earnings by Sex by Income Bracket in Mira Monte
The most common earnings brackets in Mira Monte are $100,000+ for men (458 | 27.6%) and $100,000+ for women (287 | 17.1%).
| Income | Male | Female |
| $2,499 or less | 58 (3.5%) | 59 (3.5%) |
| $2,500 to $4,999 | 135 (8.1%) | 92 (5.5%) |
| $5,000 to $7,499 | 55 (3.3%) | 222 (13.2%) |
| $7,500 to $9,999 | 90 (5.4%) | 48 (2.9%) |
| $10,000 to $12,499 | 61 (3.7%) | 14 (0.8%) |
| $12,500 to $14,999 | 26 (1.6%) | 29 (1.7%) |
| $15,000 to $17,499 | 29 (1.7%) | 66 (3.9%) |
| $17,500 to $19,999 | 19 (1.1%) | 98 (5.8%) |
| $20,000 to $22,499 | 40 (2.4%) | 73 (4.3%) |
| $22,500 to $24,999 | 14 (0.8%) | 20 (1.2%) |
| $25,000 to $29,999 | 15 (0.9%) | 89 (5.3%) |
| $30,000 to $34,999 | 62 (3.7%) | 104 (6.2%) |
| $35,000 to $39,999 | 74 (4.4%) | 32 (1.9%) |
| $40,000 to $44,999 | 82 (4.9%) | 41 (2.4%) |
| $45,000 to $49,999 | 0 (0.0%) | 99 (5.9%) |
| $50,000 to $54,999 | 73 (4.4%) | 57 (3.4%) |
| $55,000 to $64,999 | 125 (7.5%) | 52 (3.1%) |
| $65,000 to $74,999 | 92 (5.5%) | 90 (5.4%) |
| $75,000 to $99,999 | 154 (9.3%) | 105 (6.3%) |
| $100,000+ | 458 (27.6%) | 287 (17.1%) |
| Total | 1,662 (100.0%) | 1,677 (100.0%) |
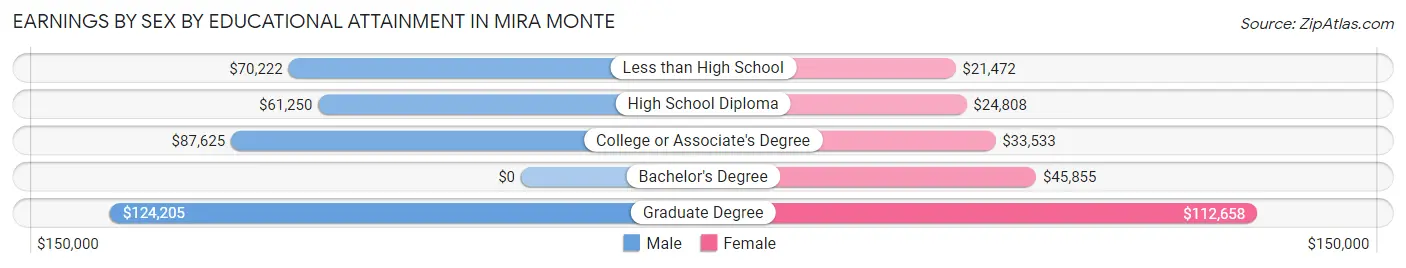
Earnings by Sex by Educational Attainment in Mira Monte
Average earnings in Mira Monte are $67,697 for men and $40,726 for women, a difference of 39.8%. Men with an educational attainment of graduate degree enjoy the highest average annual earnings of $124,205, while those with high school diploma education earn the least with $61,250. Women with an educational attainment of graduate degree earn the most with the average annual earnings of $112,658, while those with less than high school education have the smallest earnings of $21,472.
| Educational Attainment | Male Income | Female Income |
| Less than High School | $70,222 | $21,472 |
| High School Diploma | $61,250 | $24,808 |
| College or Associate's Degree | $87,625 | $33,533 |
| Bachelor's Degree | - | - |
| Graduate Degree | $124,205 | $112,658 |
| Total | $67,697 | $40,726 |
Family Income in Mira Monte
Family Income Brackets in Mira Monte
According to the Mira Monte family income data, there are 370 families falling into the $200,000+ income range, which is the most common income bracket and makes up 21.7% of all families. Conversely, the $10,000 to $14,999 income bracket is the least frequent group with only 31 families (1.8%) belonging to this category.
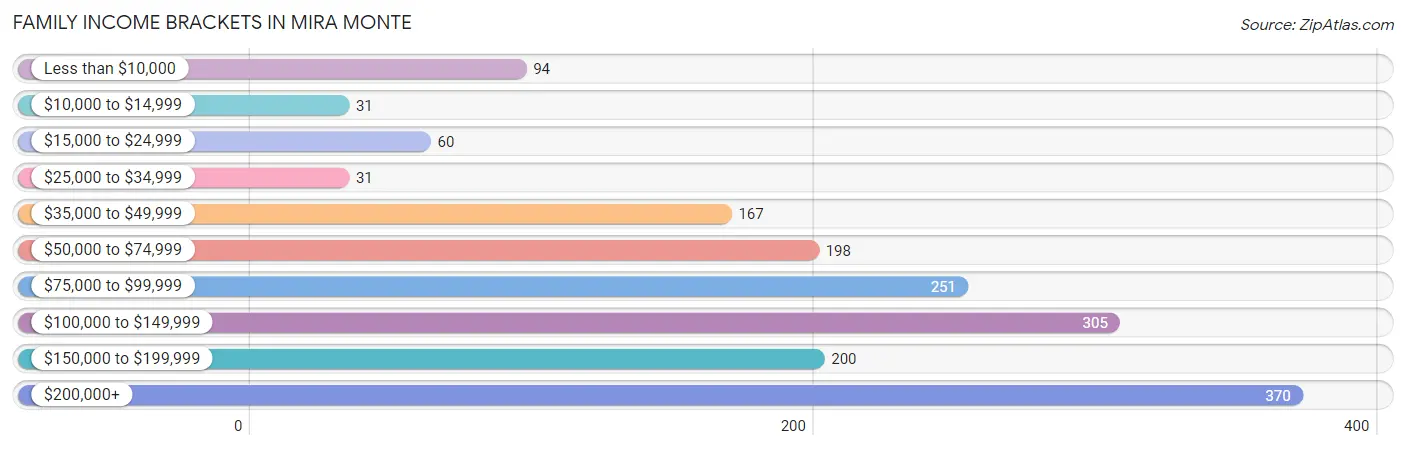
| Income Bracket | # Families | % Families |
| Less than $10,000 | 94 | 5.5% |
| $10,000 to $14,999 | 31 | 1.8% |
| $15,000 to $24,999 | 60 | 3.5% |
| $25,000 to $34,999 | 31 | 1.8% |
| $35,000 to $49,999 | 167 | 9.8% |
| $50,000 to $74,999 | 198 | 11.6% |
| $75,000 to $99,999 | 251 | 14.7% |
| $100,000 to $149,999 | 305 | 17.9% |
| $150,000 to $199,999 | 200 | 11.7% |
| $200,000+ | 370 | 21.7% |
Family Income by Famaliy Size in Mira Monte
4-person families (291 | 17.1%) account for the highest median family income in Mira Monte with $250,001 per family, while 4-person families (291 | 17.1%) have the highest median income of $62,500 per family member.
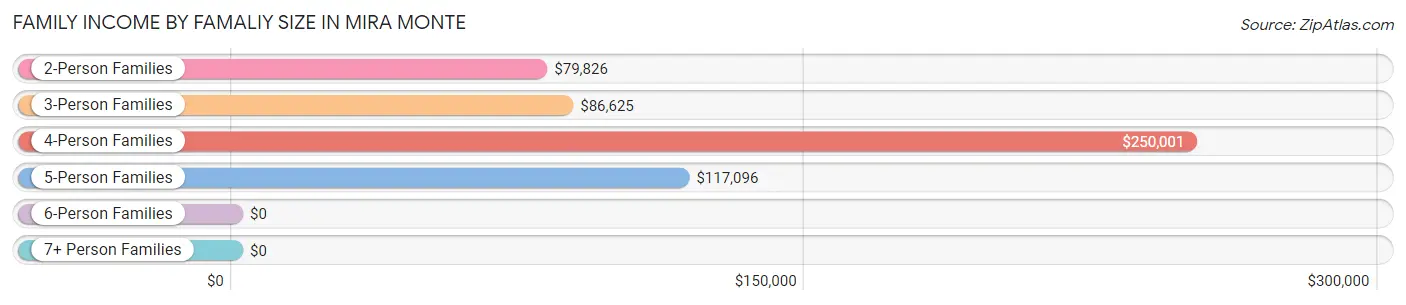
| Income Bracket | # Families | Median Income |
| 2-Person Families | 905 (53.0%) | $79,826 |
| 3-Person Families | 350 (20.5%) | $86,625 |
| 4-Person Families | 291 (17.1%) | $250,001 |
| 5-Person Families | 131 (7.7%) | $117,096 |
| 6-Person Families | 29 (1.7%) | $0 |
| 7+ Person Families | 0 (0.0%) | $0 |
| Total | 1,706 (100.0%) | $107,250 |
Family Income by Number of Earners in Mira Monte
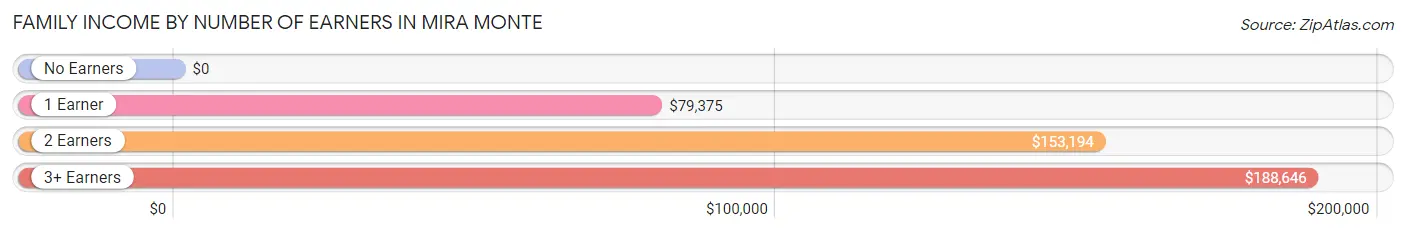
| Number of Earners | # Families | Median Income |
| No Earners | 496 (29.1%) | $0 |
| 1 Earner | 448 (26.3%) | $79,375 |
| 2 Earners | 513 (30.1%) | $153,194 |
| 3+ Earners | 249 (14.6%) | $188,646 |
| Total | 1,706 (100.0%) | $107,250 |
Household Income in Mira Monte
Household Income Brackets in Mira Monte
With 497 households falling in the category, the $100,000 to $149,999 income range is the most frequent in Mira Monte, accounting for 17.5% of all households. In contrast, only 65 households (2.3%) fall into the $10,000 to $14,999 income bracket, making it the least populous group.
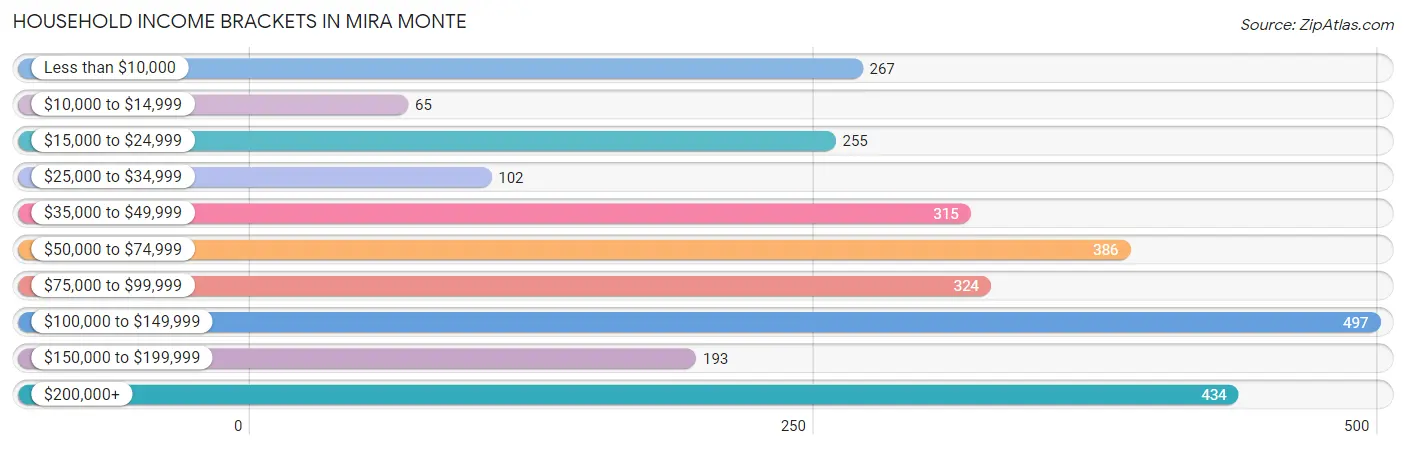
| Income Bracket | # Households | % Households |
| Less than $10,000 | 267 | 9.4% |
| $10,000 to $14,999 | 65 | 2.3% |
| $15,000 to $24,999 | 255 | 9.0% |
| $25,000 to $34,999 | 102 | 3.6% |
| $35,000 to $49,999 | 315 | 11.1% |
| $50,000 to $74,999 | 386 | 13.6% |
| $75,000 to $99,999 | 324 | 11.4% |
| $100,000 to $149,999 | 497 | 17.5% |
| $150,000 to $199,999 | 193 | 6.8% |
| $200,000+ | 434 | 15.3% |
Household Income by Householder Age in Mira Monte
The median household income in Mira Monte is $77,847, with the highest median household income of $116,875 found in the 25 to 44 years age bracket for the primary householder. A total of 286 households (10.1%) fall into this category. Meanwhile, the 15 to 24 years age bracket for the primary householder has the lowest median household income of $0, with 8 households (0.3%) in this group.
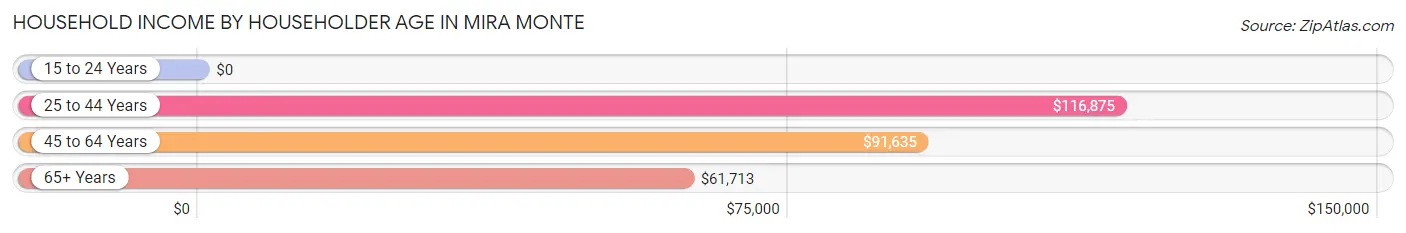
| Income Bracket | # Households | Median Income |
| 15 to 24 Years | 8 (0.3%) | $0 |
| 25 to 44 Years | 286 (10.1%) | $116,875 |
| 45 to 64 Years | 1,147 (40.4%) | $91,635 |
| 65+ Years | 1,397 (49.2%) | $61,713 |
| Total | 2,838 (100.0%) | $77,847 |
Poverty in Mira Monte
Income Below Poverty by Sex and Age in Mira Monte
With 13.6% poverty level for males and 17.9% for females among the residents of Mira Monte, 12 to 14 year old males and 16 and 17 year old females are the most vulnerable to poverty, with 46 males (36.8%) and 51 females (59.3%) in their respective age groups living below the poverty level.
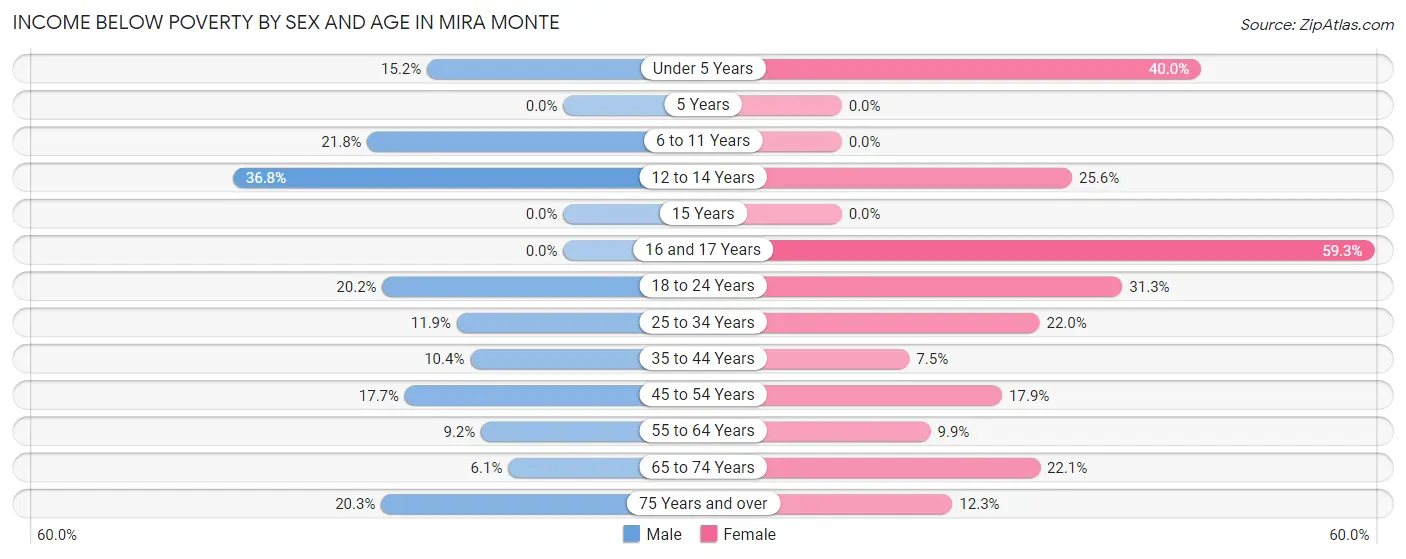
| Age Bracket | Male | Female |
| Under 5 Years | 27 (15.2%) | 24 (40.0%) |
| 5 Years | 0 (0.0%) | 0 (0.0%) |
| 6 to 11 Years | 24 (21.8%) | 0 (0.0%) |
| 12 to 14 Years | 46 (36.8%) | 20 (25.6%) |
| 15 Years | 0 (0.0%) | 0 (0.0%) |
| 16 and 17 Years | 0 (0.0%) | 51 (59.3%) |
| 18 to 24 Years | 82 (20.2%) | 80 (31.2%) |
| 25 to 34 Years | 21 (11.9%) | 48 (22.0%) |
| 35 to 44 Years | 39 (10.4%) | 25 (7.5%) |
| 45 to 54 Years | 78 (17.6%) | 92 (17.9%) |
| 55 to 64 Years | 34 (9.2%) | 71 (9.9%) |
| 65 to 74 Years | 45 (6.1%) | 166 (22.1%) |
| 75 Years and over | 58 (20.3%) | 51 (12.3%) |
| Total | 454 (13.6%) | 628 (17.9%) |
Income Above Poverty by Sex and Age in Mira Monte
According to the poverty statistics in Mira Monte, males aged 5 years and females aged 6 to 11 years are the age groups that are most secure financially, with 100.0% of males and 100.0% of females in these age groups living above the poverty line.
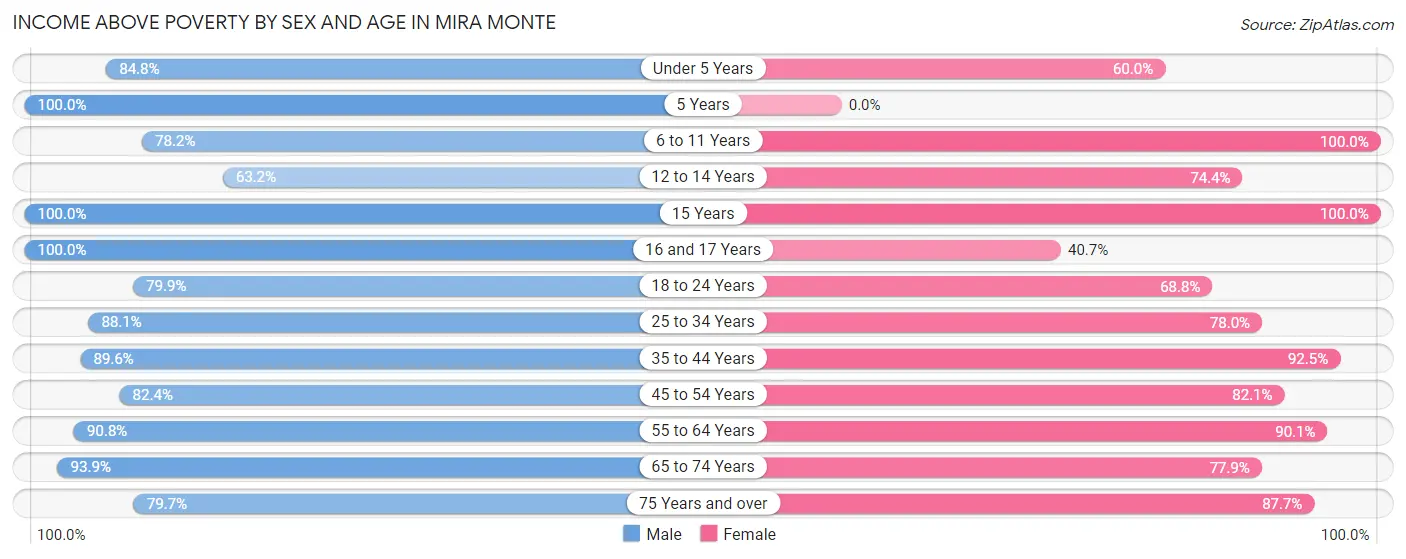
| Age Bracket | Male | Female |
| Under 5 Years | 151 (84.8%) | 36 (60.0%) |
| 5 Years | 45 (100.0%) | 0 (0.0%) |
| 6 to 11 Years | 86 (78.2%) | 55 (100.0%) |
| 12 to 14 Years | 79 (63.2%) | 58 (74.4%) |
| 15 Years | 28 (100.0%) | 22 (100.0%) |
| 16 and 17 Years | 50 (100.0%) | 35 (40.7%) |
| 18 to 24 Years | 325 (79.8%) | 176 (68.8%) |
| 25 to 34 Years | 156 (88.1%) | 170 (78.0%) |
| 35 to 44 Years | 337 (89.6%) | 307 (92.5%) |
| 45 to 54 Years | 364 (82.4%) | 423 (82.1%) |
| 55 to 64 Years | 337 (90.8%) | 647 (90.1%) |
| 65 to 74 Years | 688 (93.9%) | 586 (77.9%) |
| 75 Years and over | 228 (79.7%) | 363 (87.7%) |
| Total | 2,874 (86.4%) | 2,878 (82.1%) |
Income Below Poverty Among Married-Couple Families in Mira Monte
The poverty statistics for married-couple families in Mira Monte show that 6.0% or 80 of the total 1,329 families live below the poverty line. Families with 3 or 4 children have the highest poverty rate of 36.8%, comprising of 21 families. On the other hand, families with 1 or 2 children have the lowest poverty rate of 0.0%, which includes 0 families.
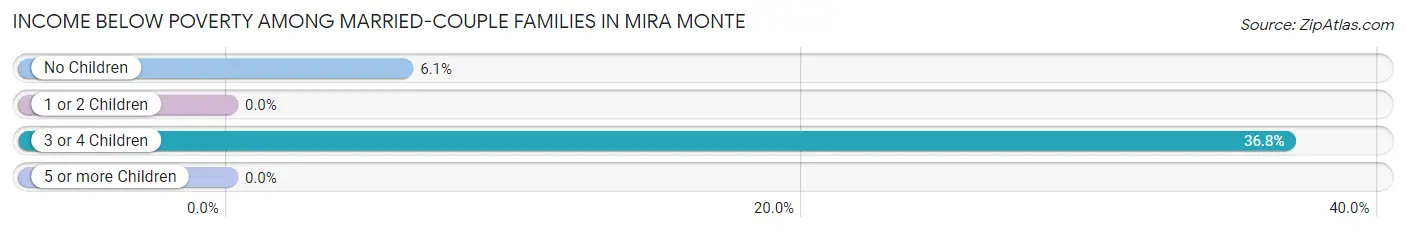
| Children | Above Poverty | Below Poverty |
| No Children | 909 (93.9%) | 59 (6.1%) |
| 1 or 2 Children | 304 (100.0%) | 0 (0.0%) |
| 3 or 4 Children | 36 (63.2%) | 21 (36.8%) |
| 5 or more Children | 0 (0.0%) | 0 (0.0%) |
| Total | 1,249 (94.0%) | 80 (6.0%) |
Income Below Poverty Among Single-Parent Households in Mira Monte
According to the poverty data in Mira Monte, 21.6% or 21 single-father households and 27.1% or 76 single-mother households are living below the poverty line. Among single-father households, those with 1 or 2 children have the highest poverty rate, with 21 households (100.0%) experiencing poverty. Likewise, among single-mother households, those with 1 or 2 children have the highest poverty rate, with 66 households (60.0%) falling below the poverty line.
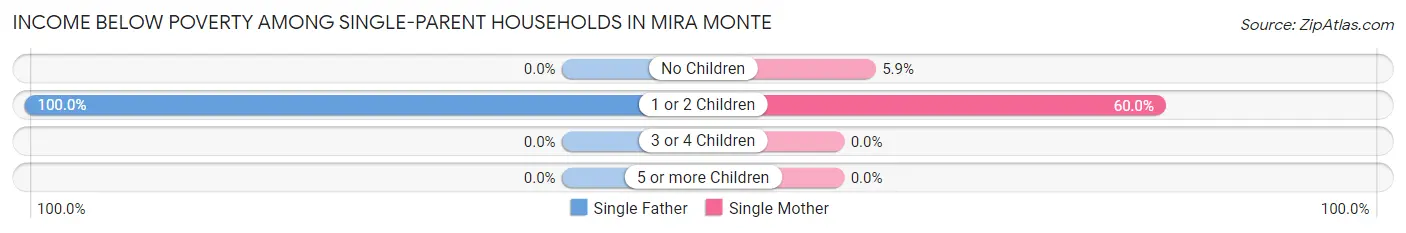
| Children | Single Father | Single Mother |
| No Children | 0 (0.0%) | 10 (5.9%) |
| 1 or 2 Children | 21 (100.0%) | 66 (60.0%) |
| 3 or 4 Children | 0 (0.0%) | 0 (0.0%) |
| 5 or more Children | 0 (0.0%) | 0 (0.0%) |
| Total | 21 (21.6%) | 76 (27.1%) |
Income Below Poverty Among Married-Couple vs Single-Parent Households in Mira Monte
The poverty data for Mira Monte shows that 80 of the married-couple family households (6.0%) and 97 of the single-parent households (25.7%) are living below the poverty level. Within the married-couple family households, those with 3 or 4 children have the highest poverty rate, with 21 households (36.8%) falling below the poverty line. Among the single-parent households, those with 1 or 2 children have the highest poverty rate, with 87 household (66.4%) living below poverty.
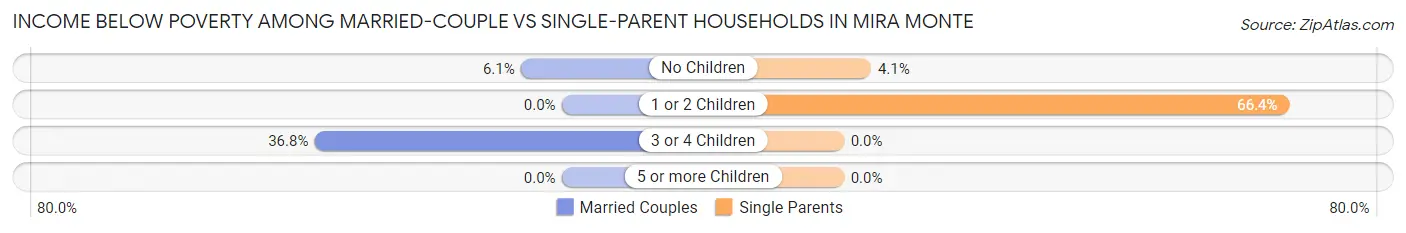
| Children | Married-Couple Families | Single-Parent Households |
| No Children | 59 (6.1%) | 10 (4.1%) |
| 1 or 2 Children | 0 (0.0%) | 87 (66.4%) |
| 3 or 4 Children | 21 (36.8%) | 0 (0.0%) |
| 5 or more Children | 0 (0.0%) | 0 (0.0%) |
| Total | 80 (6.0%) | 97 (25.7%) |
Race in Mira Monte
The most populous races in Mira Monte are White / Caucasian (6,090 | 89.1%), Hispanic or Latino (1,279 | 18.7%), and Two or more Races (329 | 4.8%).
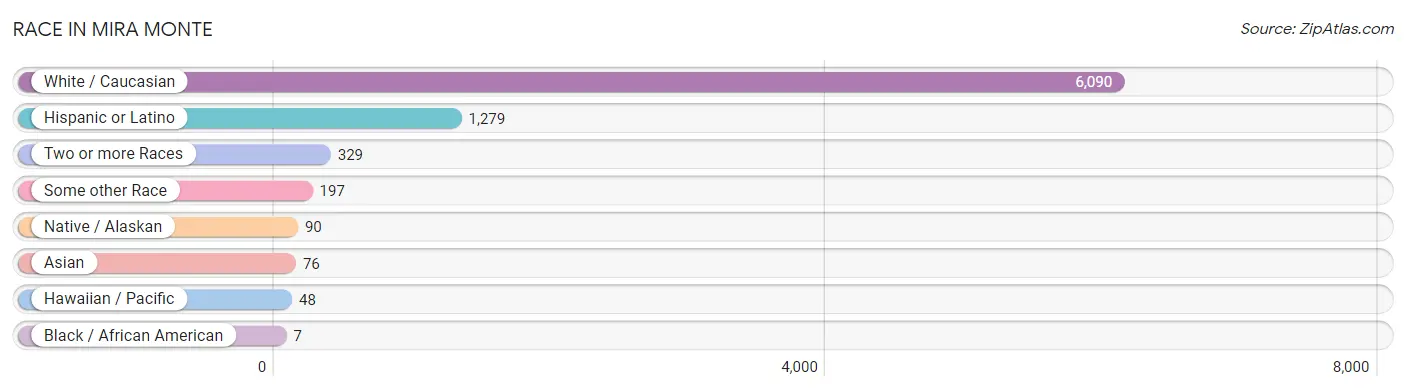
| Race | # Population | % Population |
| Asian | 76 | 1.1% |
| Black / African American | 7 | 0.1% |
| Hawaiian / Pacific | 48 | 0.7% |
| Hispanic or Latino | 1,279 | 18.7% |
| Native / Alaskan | 90 | 1.3% |
| White / Caucasian | 6,090 | 89.1% |
| Two or more Races | 329 | 4.8% |
| Some other Race | 197 | 2.9% |
| Total | 6,837 | 100.0% |
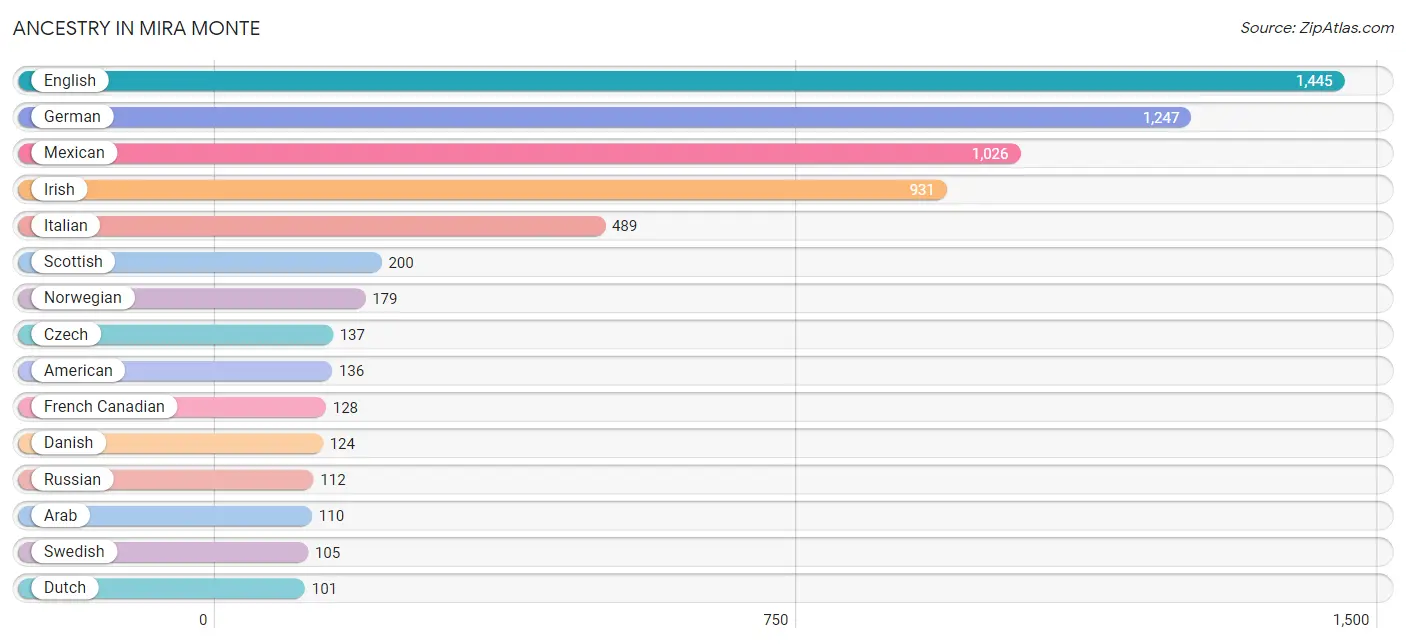
Ancestry in Mira Monte
The most populous ancestries reported in Mira Monte are English (1,445 | 21.1%), German (1,247 | 18.2%), Mexican (1,026 | 15.0%), Irish (931 | 13.6%), and Italian (489 | 7.1%), together accounting for 75.2% of all Mira Monte residents.
| Ancestry | # Population | % Population |
| American | 136 | 2.0% |
| Apache | 25 | 0.4% |
| Arab | 110 | 1.6% |
| Armenian | 19 | 0.3% |
| Barbadian | 38 | 0.6% |
| Basque | 11 | 0.2% |
| Belgian | 70 | 1.0% |
| Bhutanese | 29 | 0.4% |
| British | 53 | 0.8% |
| Burmese | 35 | 0.5% |
| Canadian | 7 | 0.1% |
| Celtic | 13 | 0.2% |
| Central American | 45 | 0.7% |
| Cherokee | 74 | 1.1% |
| Colombian | 2 | 0.0% |
| Czech | 137 | 2.0% |
| Danish | 124 | 1.8% |
| Dominican | 30 | 0.4% |
| Dutch | 101 | 1.5% |
| English | 1,445 | 21.1% |
| European | 82 | 1.2% |
| Finnish | 8 | 0.1% |
| French | 95 | 1.4% |
| French American Indian | 22 | 0.3% |
| French Canadian | 128 | 1.9% |
| German | 1,247 | 18.2% |
| Greek | 23 | 0.3% |
| Hungarian | 23 | 0.3% |
| Icelander | 52 | 0.8% |
| Indian (Asian) | 9 | 0.1% |
| Iranian | 9 | 0.1% |
| Irish | 931 | 13.6% |
| Italian | 489 | 7.1% |
| Korean | 28 | 0.4% |
| Mexican | 1,026 | 15.0% |
| Moroccan | 87 | 1.3% |
| Native Hawaiian | 2 | 0.0% |
| Northern European | 18 | 0.3% |
| Norwegian | 179 | 2.6% |
| Panamanian | 24 | 0.4% |
| Polish | 73 | 1.1% |
| Portuguese | 31 | 0.4% |
| Puerto Rican | 9 | 0.1% |
| Russian | 112 | 1.6% |
| Salvadoran | 21 | 0.3% |
| Scotch-Irish | 78 | 1.1% |
| Scottish | 200 | 2.9% |
| Sioux | 44 | 0.6% |
| Slavic | 28 | 0.4% |
| South American | 2 | 0.0% |
| Spaniard | 93 | 1.4% |
| Spanish | 57 | 0.8% |
| Swedish | 105 | 1.5% |
| Swiss | 58 | 0.9% |
| Syrian | 23 | 0.3% |
| Ukrainian | 25 | 0.4% |
| Welsh | 43 | 0.6% | View All 57 Rows |
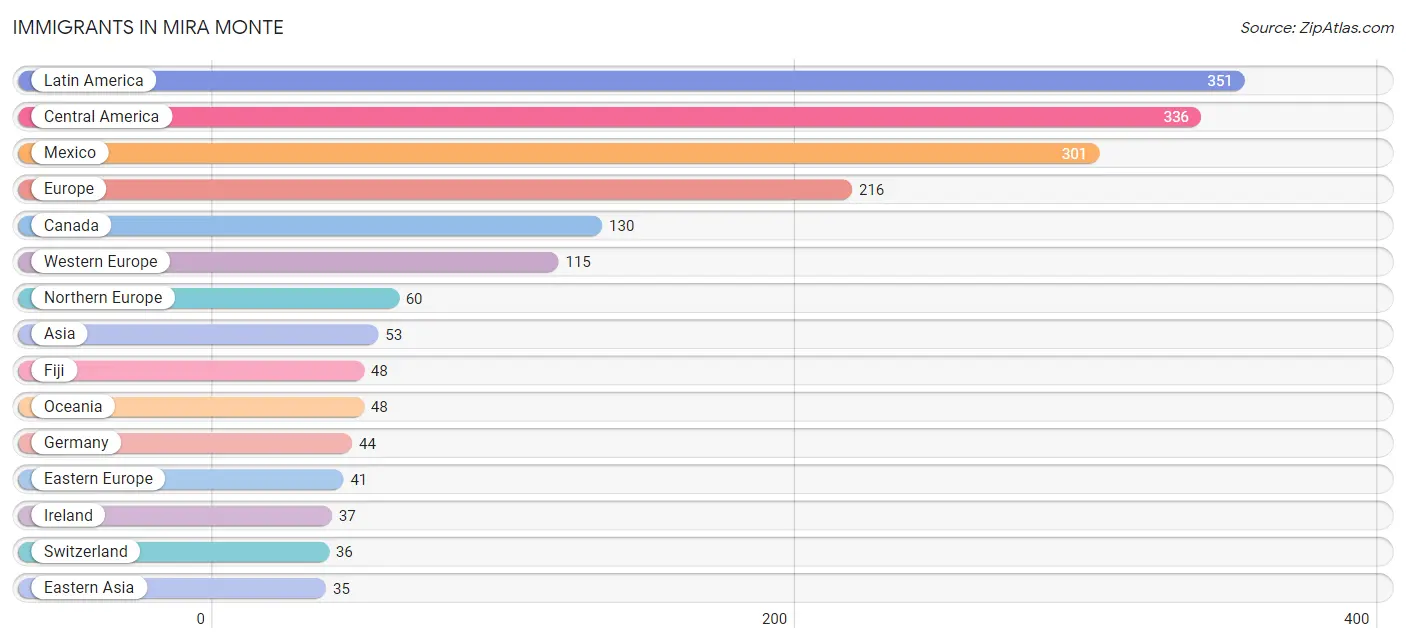
Immigrants in Mira Monte
The most numerous immigrant groups reported in Mira Monte came from Latin America (351 | 5.1%), Central America (336 | 4.9%), Mexico (301 | 4.4%), Europe (216 | 3.2%), and Canada (130 | 1.9%), together accounting for 19.5% of all Mira Monte residents.
| Immigration Origin | # Population | % Population |
| Asia | 53 | 0.8% |
| Belgium | 20 | 0.3% |
| Canada | 130 | 1.9% |
| Caribbean | 13 | 0.2% |
| Central America | 336 | 4.9% |
| Colombia | 2 | 0.0% |
| Dominican Republic | 13 | 0.2% |
| Eastern Asia | 35 | 0.5% |
| Eastern Europe | 41 | 0.6% |
| England | 9 | 0.1% |
| Europe | 216 | 3.2% |
| Fiji | 48 | 0.7% |
| France | 8 | 0.1% |
| Germany | 44 | 0.6% |
| Iran | 9 | 0.1% |
| Ireland | 37 | 0.5% |
| Korea | 35 | 0.5% |
| Latin America | 351 | 5.1% |
| Mexico | 301 | 4.4% |
| Netherlands | 7 | 0.1% |
| Nicaragua | 11 | 0.2% |
| Northern Europe | 60 | 0.9% |
| Oceania | 48 | 0.7% |
| Panama | 24 | 0.4% |
| Philippines | 9 | 0.1% |
| Scotland | 14 | 0.2% |
| South America | 2 | 0.0% |
| South Central Asia | 9 | 0.1% |
| South Eastern Asia | 9 | 0.1% |
| Switzerland | 36 | 0.5% |
| Western Europe | 115 | 1.7% | View All 31 Rows |
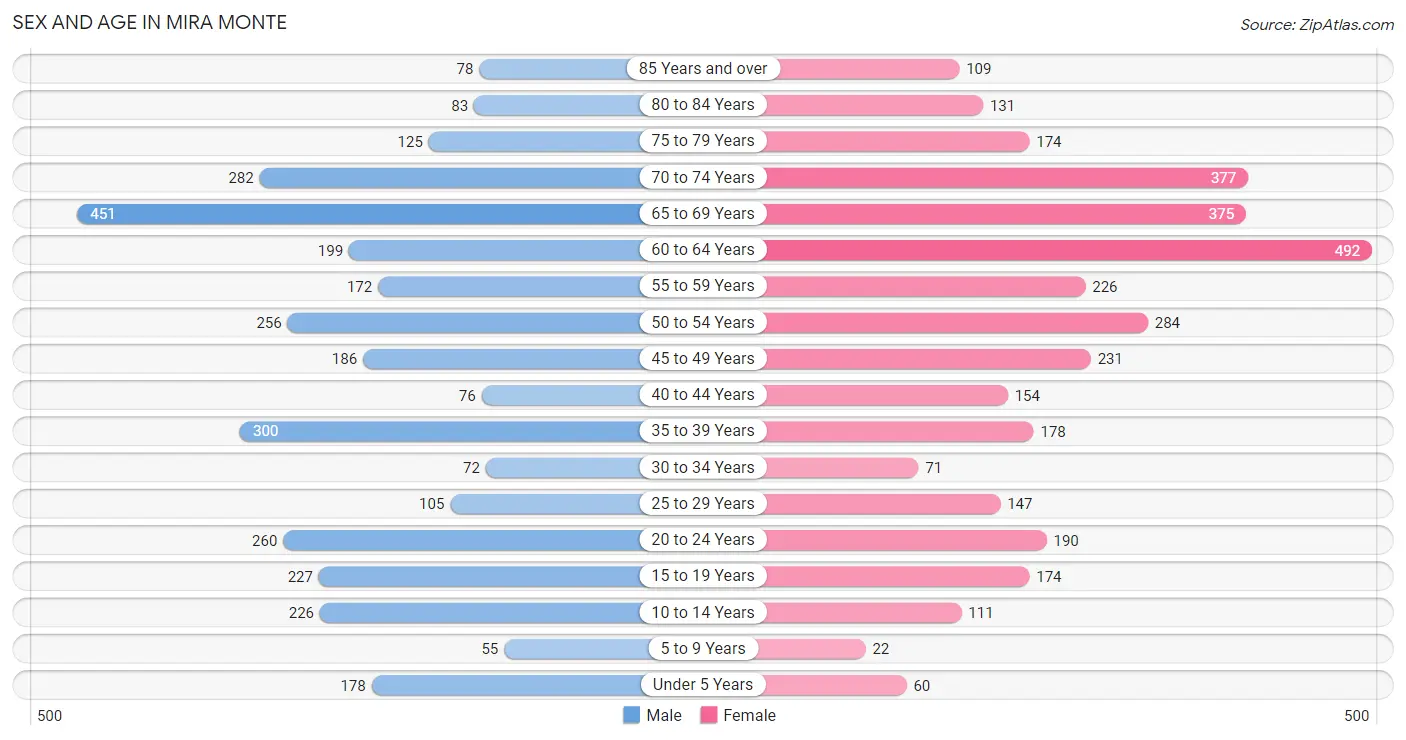
Sex and Age in Mira Monte
Sex and Age in Mira Monte
The most populous age groups in Mira Monte are 65 to 69 Years (451 | 13.5%) for men and 60 to 64 Years (492 | 14.0%) for women.
| Age Bracket | Male | Female |
| Under 5 Years | 178 (5.3%) | 60 (1.7%) |
| 5 to 9 Years | 55 (1.7%) | 22 (0.6%) |
| 10 to 14 Years | 226 (6.8%) | 111 (3.2%) |
| 15 to 19 Years | 227 (6.8%) | 174 (5.0%) |
| 20 to 24 Years | 260 (7.8%) | 190 (5.4%) |
| 25 to 29 Years | 105 (3.2%) | 147 (4.2%) |
| 30 to 34 Years | 72 (2.2%) | 71 (2.0%) |
| 35 to 39 Years | 300 (9.0%) | 178 (5.1%) |
| 40 to 44 Years | 76 (2.3%) | 154 (4.4%) |
| 45 to 49 Years | 186 (5.6%) | 231 (6.6%) |
| 50 to 54 Years | 256 (7.7%) | 284 (8.1%) |
| 55 to 59 Years | 172 (5.2%) | 226 (6.5%) |
| 60 to 64 Years | 199 (6.0%) | 492 (14.0%) |
| 65 to 69 Years | 451 (13.5%) | 375 (10.7%) |
| 70 to 74 Years | 282 (8.5%) | 377 (10.7%) |
| 75 to 79 Years | 125 (3.7%) | 174 (5.0%) |
| 80 to 84 Years | 83 (2.5%) | 131 (3.7%) |
| 85 Years and over | 78 (2.3%) | 109 (3.1%) |
| Total | 3,331 (100.0%) | 3,506 (100.0%) |
Families and Households in Mira Monte
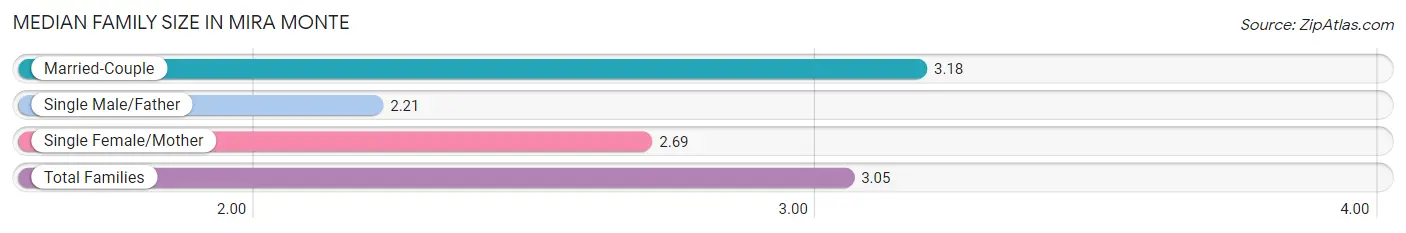
Median Family Size in Mira Monte
The median family size in Mira Monte is 3.05 persons per family, with married-couple families (1,329 | 77.9%) accounting for the largest median family size of 3.18 persons per family. On the other hand, single male/father families (97 | 5.7%) represent the smallest median family size with 2.21 persons per family.
| Family Type | # Families | Family Size |
| Married-Couple | 1,329 (77.9%) | 3.18 |
| Single Male/Father | 97 (5.7%) | 2.21 |
| Single Female/Mother | 280 (16.4%) | 2.69 |
| Total Families | 1,706 (100.0%) | 3.05 |
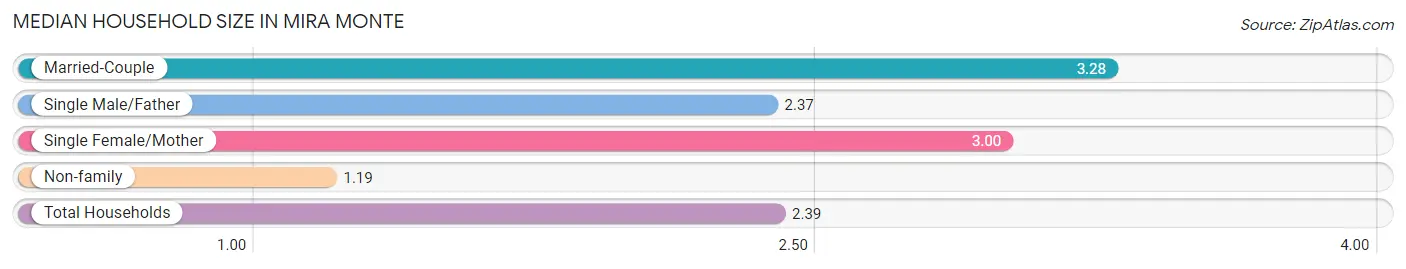
Median Household Size in Mira Monte
The median household size in Mira Monte is 2.39 persons per household, with married-couple households (1,329 | 46.8%) accounting for the largest median household size of 3.28 persons per household. non-family households (1,132 | 39.9%) represent the smallest median household size with 1.19 persons per household.
| Household Type | # Households | Household Size |
| Married-Couple | 1,329 (46.8%) | 3.28 |
| Single Male/Father | 97 (3.4%) | 2.37 |
| Single Female/Mother | 280 (9.9%) | 3.00 |
| Non-family | 1,132 (39.9%) | 1.19 |
| Total Households | 2,838 (100.0%) | 2.39 |
Household Size by Marriage Status in Mira Monte
Out of a total of 2,838 households in Mira Monte, 1,706 (60.1%) are family households, while 1,132 (39.9%) are nonfamily households. The most numerous type of family households are 2-person households, comprising 809, and the most common type of nonfamily households are 1-person households, comprising 975.
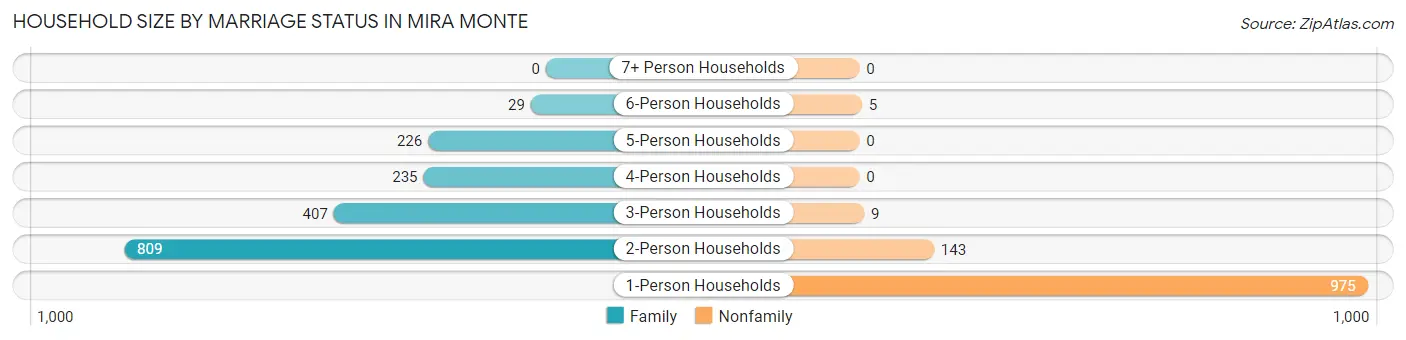
| Household Size | Family Households | Nonfamily Households |
| 1-Person Households | - | 975 (34.4%) |
| 2-Person Households | 809 (28.5%) | 143 (5.0%) |
| 3-Person Households | 407 (14.3%) | 9 (0.3%) |
| 4-Person Households | 235 (8.3%) | 0 (0.0%) |
| 5-Person Households | 226 (8.0%) | 0 (0.0%) |
| 6-Person Households | 29 (1.0%) | 5 (0.2%) |
| 7+ Person Households | 0 (0.0%) | 0 (0.0%) |
| Total | 1,706 (60.1%) | 1,132 (39.9%) |
Female Fertility in Mira Monte
Fertility by Age in Mira Monte
Average fertility rate in Mira Monte is 90.0 births per 1,000 women. Women in the age bracket of 35 to 50 years have the highest fertility rate with 146.0 births per 1,000 women. Women in the age bracket of 35 to 50 years acount for 80.9% of all women with births.
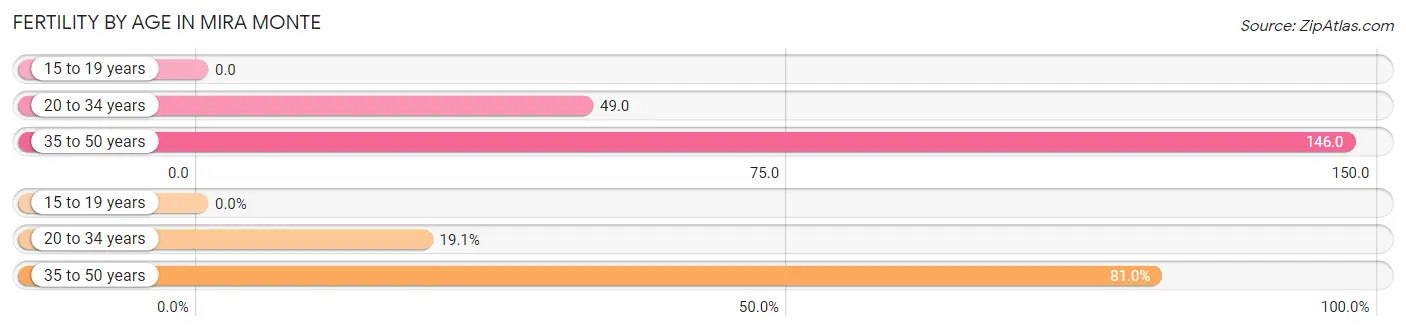
| Age Bracket | Women with Births | Births / 1,000 Women |
| 15 to 19 years | 0 (0.0%) | 0.0 |
| 20 to 34 years | 20 (19.1%) | 49.0 |
| 35 to 50 years | 85 (80.9%) | 146.0 |
| Total | 105 (100.0%) | 90.0 |
Fertility by Age by Marriage Status in Mira Monte
66.7% of women with births (105) in Mira Monte are married. The highest percentage of unmarried women with births falls into 35 to 50 years age bracket with 41.2% of them unmarried at the time of birth, while the lowest percentage of unmarried women with births belong to 20 to 34 years age bracket with 0.0% of them unmarried.
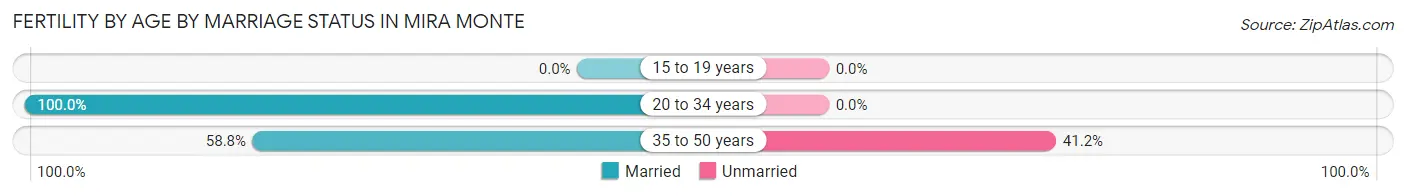
| Age Bracket | Married | Unmarried |
| 15 to 19 years | 0 (0.0%) | 0 (0.0%) |
| 20 to 34 years | 20 (100.0%) | 0 (0.0%) |
| 35 to 50 years | 50 (58.8%) | 35 (41.2%) |
| Total | 70 (66.7%) | 35 (33.3%) |
Fertility by Education in Mira Monte
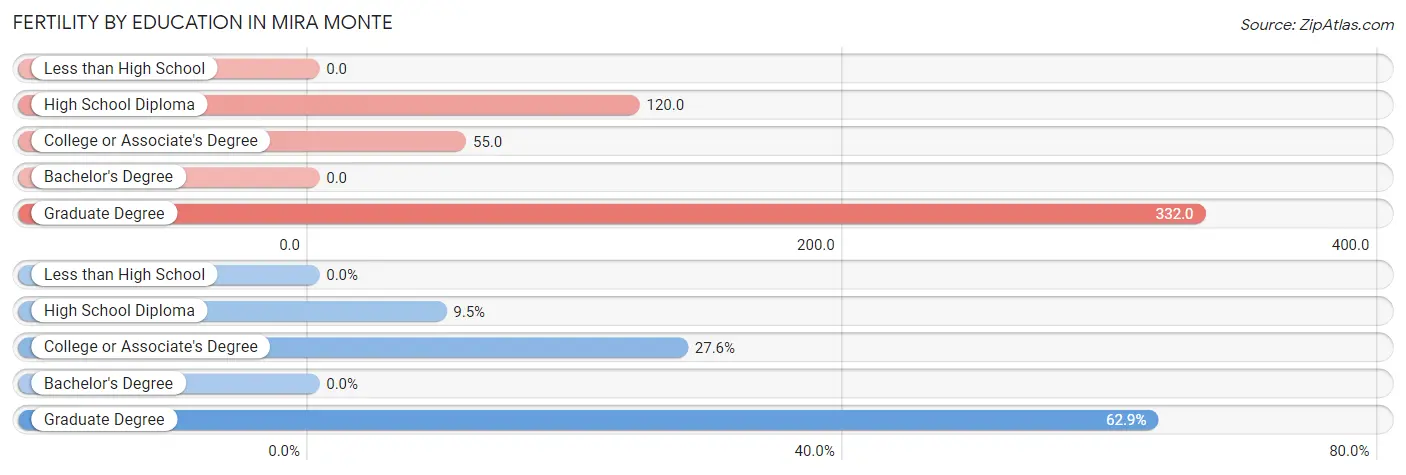
| Educational Attainment | Women with Births | Births / 1,000 Women |
| Less than High School | 0 (0.0%) | 0.0 |
| High School Diploma | 10 (9.5%) | 120.0 |
| College or Associate's Degree | 29 (27.6%) | 55.0 |
| Bachelor's Degree | 0 (0.0%) | 0.0 |
| Graduate Degree | 66 (62.9%) | 332.0 |
| Total | 105 (100.0%) | 90.0 |
Fertility by Education by Marriage Status in Mira Monte
33.3% of women with births in Mira Monte are unmarried. Women with the educational attainment of college or associate's degree are most likely to be married with 100.0% of them married at childbirth, while women with the educational attainment of high school diploma are least likely to be married with 100.0% of them unmarried at childbirth.
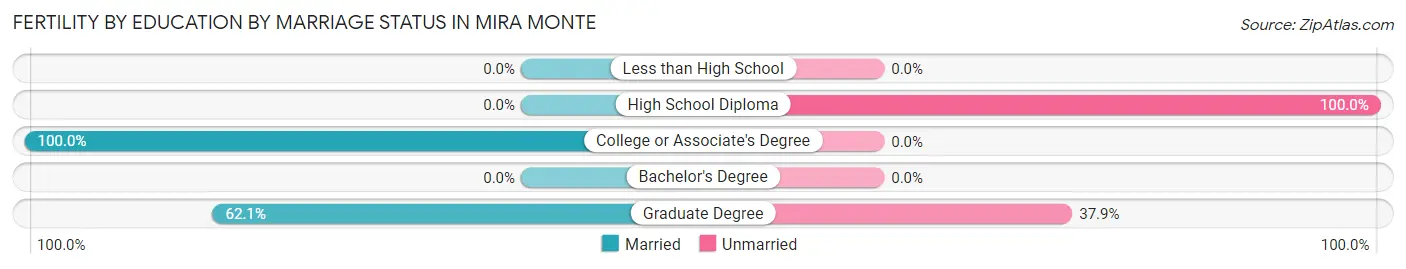
| Educational Attainment | Married | Unmarried |
| Less than High School | 0 (0.0%) | 0 (0.0%) |
| High School Diploma | 0 (0.0%) | 10 (100.0%) |
| College or Associate's Degree | 29 (100.0%) | 0 (0.0%) |
| Bachelor's Degree | 0 (0.0%) | 0 (0.0%) |
| Graduate Degree | 41 (62.1%) | 25 (37.9%) |
| Total | 70 (66.7%) | 35 (33.3%) |
Employment Characteristics in Mira Monte
Employment by Class of Employer in Mira Monte
Among the 2,703 employed individuals in Mira Monte, private company employees (1,163 | 43.0%), local government employees (576 | 21.3%), and self-employed (not incorporated) (493 | 18.2%) make up the most common classes of employment.
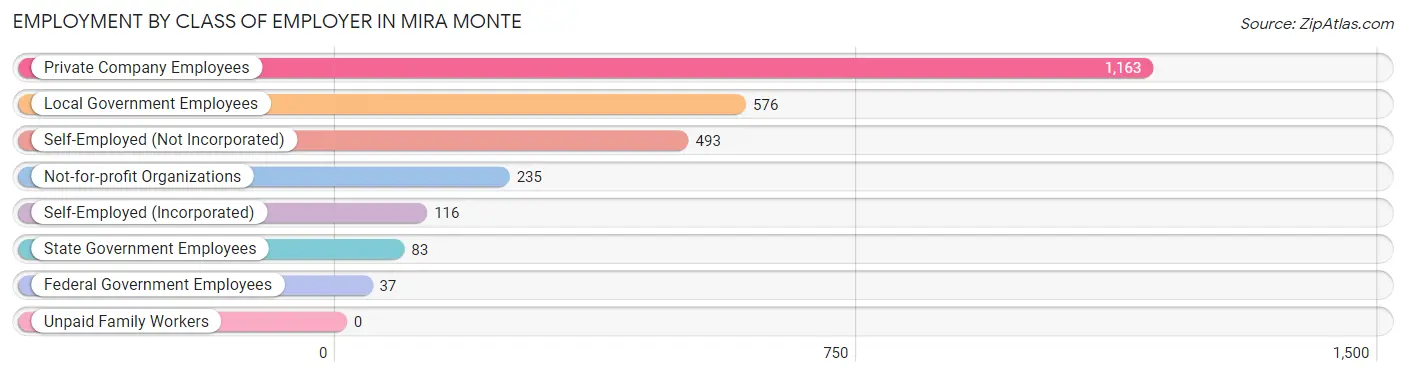
| Employer Class | # Employees | % Employees |
| Private Company Employees | 1,163 | 43.0% |
| Self-Employed (Incorporated) | 116 | 4.3% |
| Self-Employed (Not Incorporated) | 493 | 18.2% |
| Not-for-profit Organizations | 235 | 8.7% |
| Local Government Employees | 576 | 21.3% |
| State Government Employees | 83 | 3.1% |
| Federal Government Employees | 37 | 1.4% |
| Unpaid Family Workers | 0 | 0.0% |
| Total | 2,703 | 100.0% |
Employment Status by Age in Mira Monte
According to the labor force statistics for Mira Monte, out of the total population over 16 years of age (6,135), 50.4% or 3,092 individuals are in the labor force, with 8.9% or 275 of them unemployed. The age group with the highest labor force participation rate is 30 to 34 years, with 100.0% or 143 individuals in the labor force. Within the labor force, the 20 to 24 years age range has the highest percentage of unemployed individuals, with 44.3% or 109 of them being unemployed.
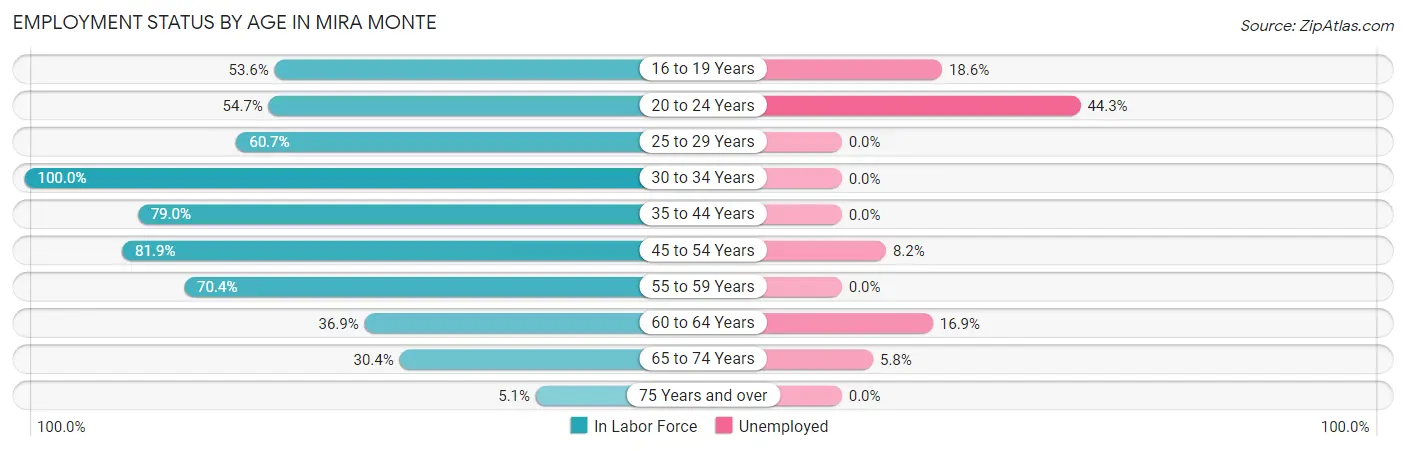
| Age Bracket | In Labor Force | Unemployed |
| 16 to 19 Years | 188 (53.6%) | 35 (18.6%) |
| 20 to 24 Years | 246 (54.7%) | 109 (44.3%) |
| 25 to 29 Years | 153 (60.7%) | 0 (0.0%) |
| 30 to 34 Years | 143 (100.0%) | 0 (0.0%) |
| 35 to 44 Years | 559 (79.0%) | 0 (0.0%) |
| 45 to 54 Years | 784 (81.9%) | 64 (8.2%) |
| 55 to 59 Years | 280 (70.4%) | 0 (0.0%) |
| 60 to 64 Years | 255 (36.9%) | 43 (16.9%) |
| 65 to 74 Years | 451 (30.4%) | 26 (5.8%) |
| 75 Years and over | 36 (5.1%) | 0 (0.0%) |
| Total | 3,092 (50.4%) | 275 (8.9%) |
Employment Status by Educational Attainment in Mira Monte
According to labor force statistics for Mira Monte, 69.0% of individuals (2,173) out of the total population between 25 and 64 years of age (3,149) are in the labor force, with 4.9% or 106 of them being unemployed. The group with the highest labor force participation rate are those with the educational attainment of less than high school, with 78.4% or 145 individuals in the labor force. Within the labor force, individuals with high school diploma education have the highest percentage of unemployment, with 8.6% or 27 of them being unemployed.
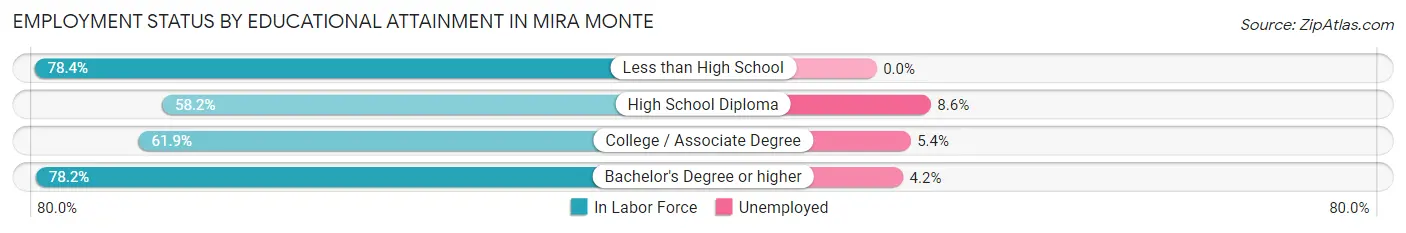
| Educational Attainment | In Labor Force | Unemployed |
| Less than High School | 145 (78.4%) | 0 (0.0%) |
| High School Diploma | 313 (58.2%) | 46 (8.6%) |
| College / Associate Degree | 691 (61.9%) | 60 (5.4%) |
| Bachelor's Degree or higher | 1,024 (78.2%) | 55 (4.2%) |
| Total | 2,173 (69.0%) | 154 (4.9%) |
Employment Occupations by Sex in Mira Monte
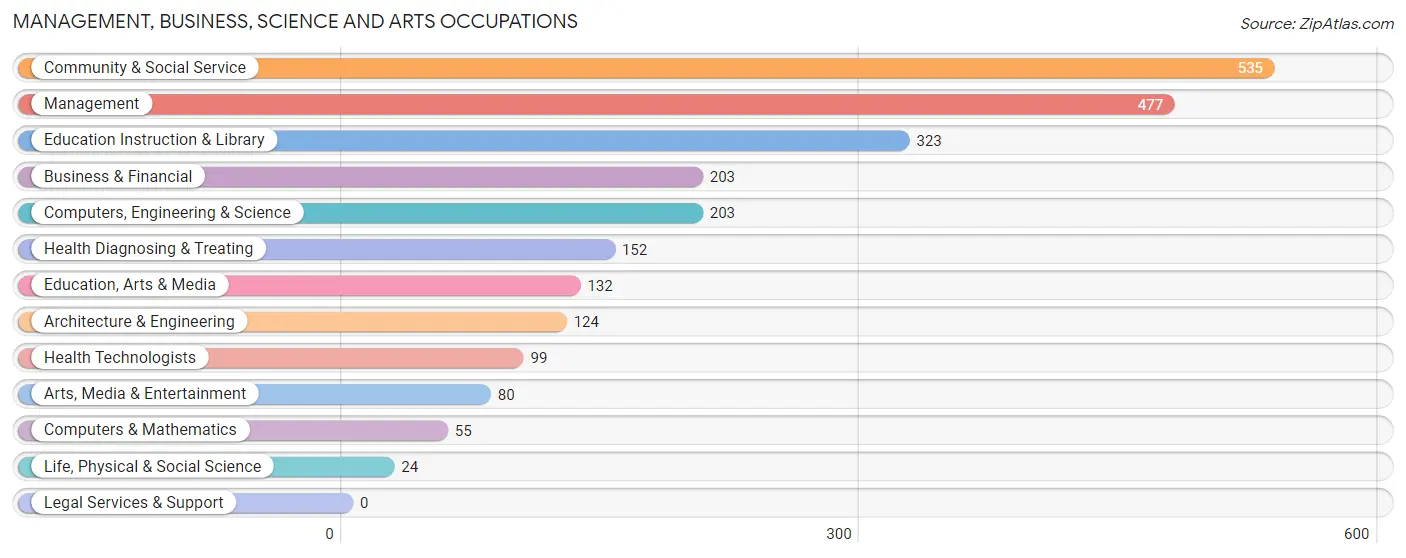
Management, Business, Science and Arts Occupations
The most common Management, Business, Science and Arts occupations in Mira Monte are Community & Social Service (535 | 19.0%), Management (477 | 16.9%), Education Instruction & Library (323 | 11.5%), Business & Financial (203 | 7.2%), and Computers, Engineering & Science (203 | 7.2%).
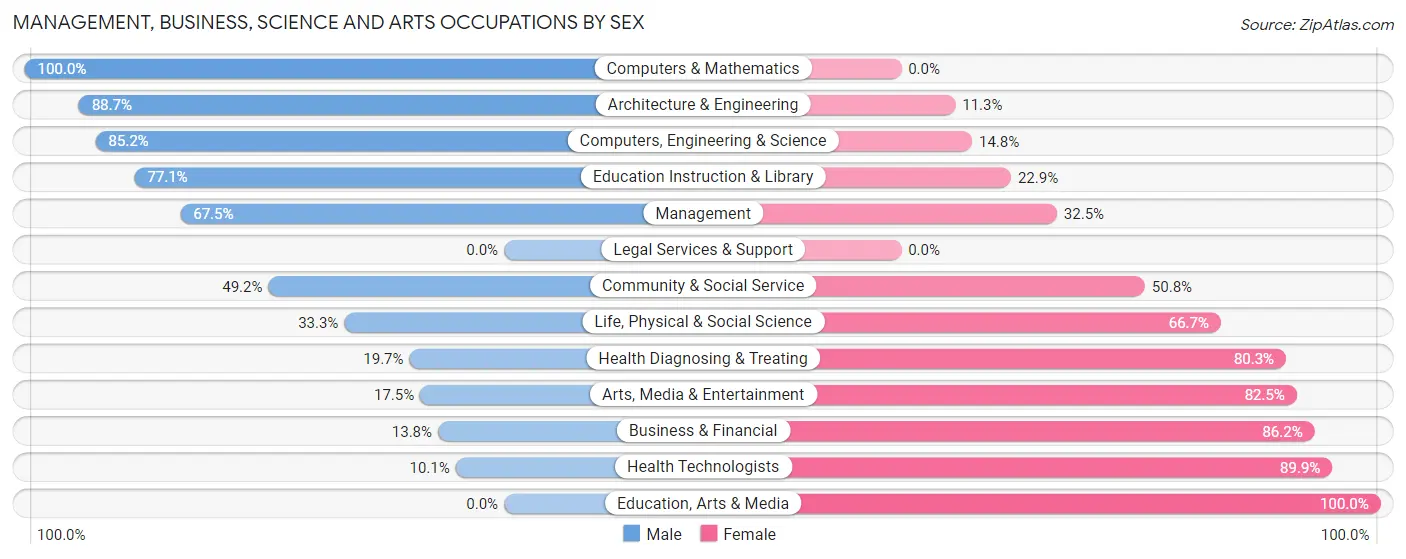
Management, Business, Science and Arts Occupations by Sex
Within the Management, Business, Science and Arts occupations in Mira Monte, the most male-oriented occupations are Computers & Mathematics (100.0%), Architecture & Engineering (88.7%), and Computers, Engineering & Science (85.2%), while the most female-oriented occupations are Education, Arts & Media (100.0%), Health Technologists (89.9%), and Business & Financial (86.2%).
| Occupation | Male | Female |
| Management | 322 (67.5%) | 155 (32.5%) |
| Business & Financial | 28 (13.8%) | 175 (86.2%) |
| Computers, Engineering & Science | 173 (85.2%) | 30 (14.8%) |
| Computers & Mathematics | 55 (100.0%) | 0 (0.0%) |
| Architecture & Engineering | 110 (88.7%) | 14 (11.3%) |
| Life, Physical & Social Science | 8 (33.3%) | 16 (66.7%) |
| Community & Social Service | 263 (49.2%) | 272 (50.8%) |
| Education, Arts & Media | 0 (0.0%) | 132 (100.0%) |
| Legal Services & Support | 0 (0.0%) | 0 (0.0%) |
| Education Instruction & Library | 249 (77.1%) | 74 (22.9%) |
| Arts, Media & Entertainment | 14 (17.5%) | 66 (82.5%) |
| Health Diagnosing & Treating | 30 (19.7%) | 122 (80.3%) |
| Health Technologists | 10 (10.1%) | 89 (89.9%) |
| Total (Category) | 816 (52.0%) | 754 (48.0%) |
| Total (Overall) | 1,472 (52.2%) | 1,346 (47.8%) |
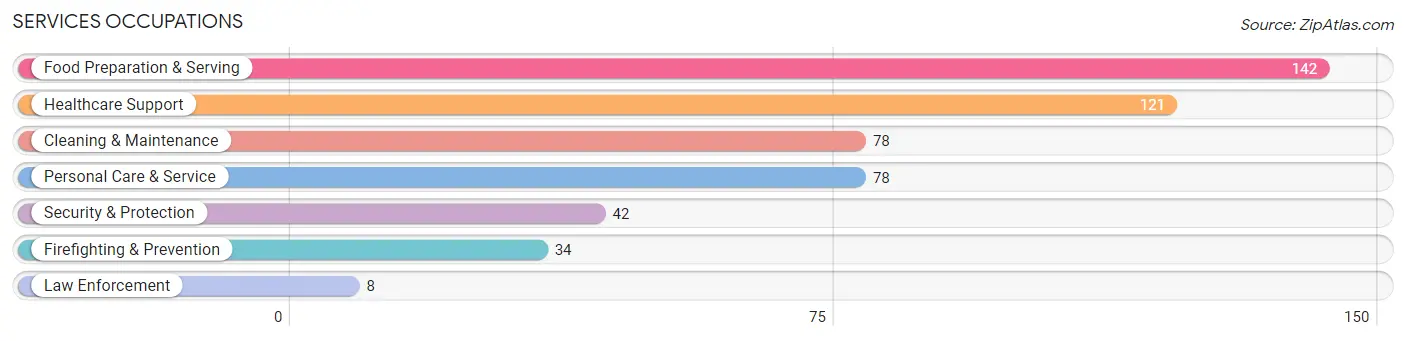
Services Occupations
The most common Services occupations in Mira Monte are Food Preparation & Serving (142 | 5.0%), Healthcare Support (121 | 4.3%), Cleaning & Maintenance (78 | 2.8%), Personal Care & Service (78 | 2.8%), and Security & Protection (42 | 1.5%).
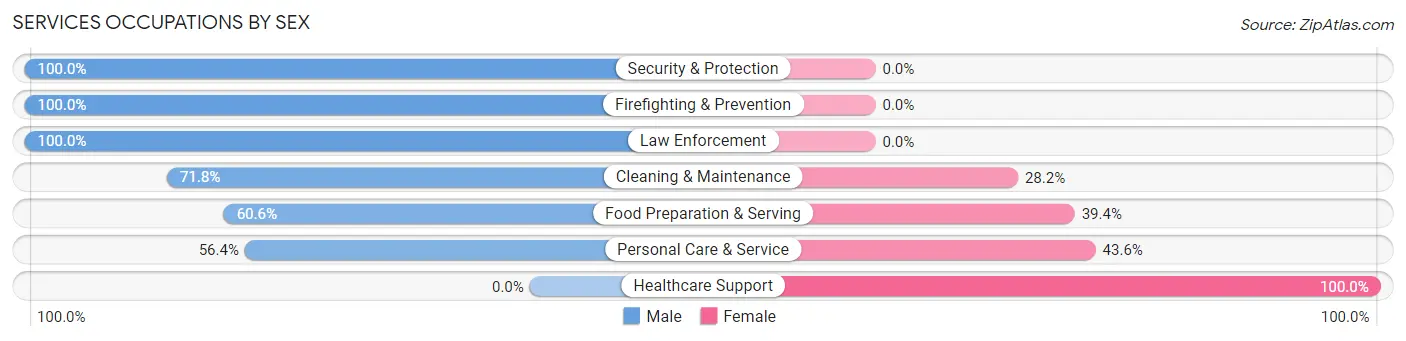
Services Occupations by Sex
Within the Services occupations in Mira Monte, the most male-oriented occupations are Security & Protection (100.0%), Firefighting & Prevention (100.0%), and Law Enforcement (100.0%), while the most female-oriented occupations are Healthcare Support (100.0%), Personal Care & Service (43.6%), and Food Preparation & Serving (39.4%).
| Occupation | Male | Female |
| Healthcare Support | 0 (0.0%) | 121 (100.0%) |
| Security & Protection | 42 (100.0%) | 0 (0.0%) |
| Firefighting & Prevention | 34 (100.0%) | 0 (0.0%) |
| Law Enforcement | 8 (100.0%) | 0 (0.0%) |
| Food Preparation & Serving | 86 (60.6%) | 56 (39.4%) |
| Cleaning & Maintenance | 56 (71.8%) | 22 (28.2%) |
| Personal Care & Service | 44 (56.4%) | 34 (43.6%) |
| Total (Category) | 228 (49.5%) | 233 (50.5%) |
| Total (Overall) | 1,472 (52.2%) | 1,346 (47.8%) |
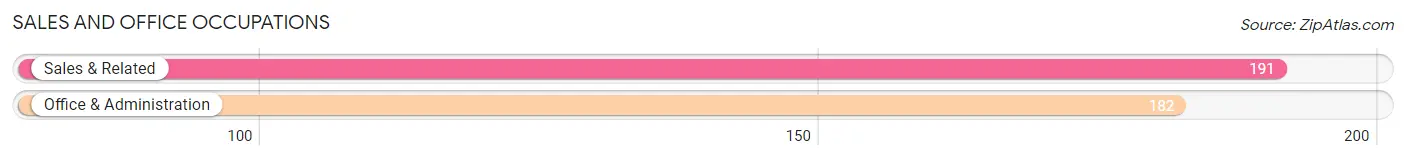
Sales and Office Occupations
The most common Sales and Office occupations in Mira Monte are Sales & Related (191 | 6.8%), and Office & Administration (182 | 6.5%).
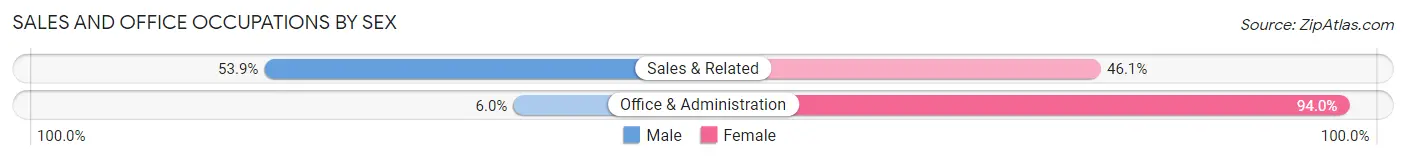
Sales and Office Occupations by Sex
| Occupation | Male | Female |
| Sales & Related | 103 (53.9%) | 88 (46.1%) |
| Office & Administration | 11 (6.0%) | 171 (94.0%) |
| Total (Category) | 114 (30.6%) | 259 (69.4%) |
| Total (Overall) | 1,472 (52.2%) | 1,346 (47.8%) |
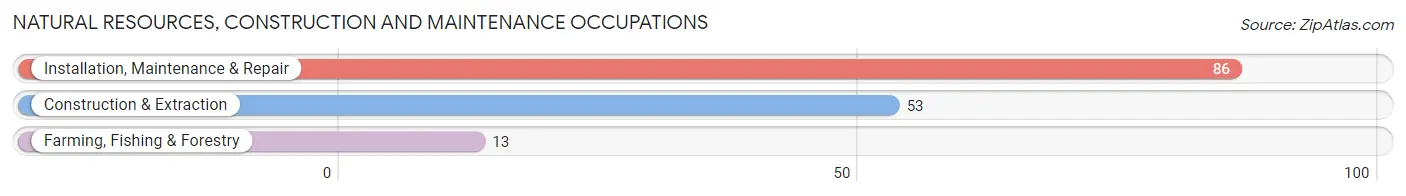
Natural Resources, Construction and Maintenance Occupations
The most common Natural Resources, Construction and Maintenance occupations in Mira Monte are Installation, Maintenance & Repair (86 | 3.0%), Construction & Extraction (53 | 1.9%), and Farming, Fishing & Forestry (13 | 0.5%).
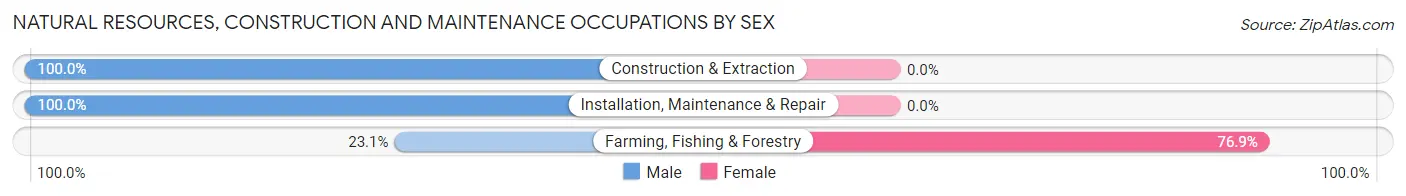
Natural Resources, Construction and Maintenance Occupations by Sex
| Occupation | Male | Female |
| Farming, Fishing & Forestry | 3 (23.1%) | 10 (76.9%) |
| Construction & Extraction | 53 (100.0%) | 0 (0.0%) |
| Installation, Maintenance & Repair | 86 (100.0%) | 0 (0.0%) |
| Total (Category) | 142 (93.4%) | 10 (6.6%) |
| Total (Overall) | 1,472 (52.2%) | 1,346 (47.8%) |
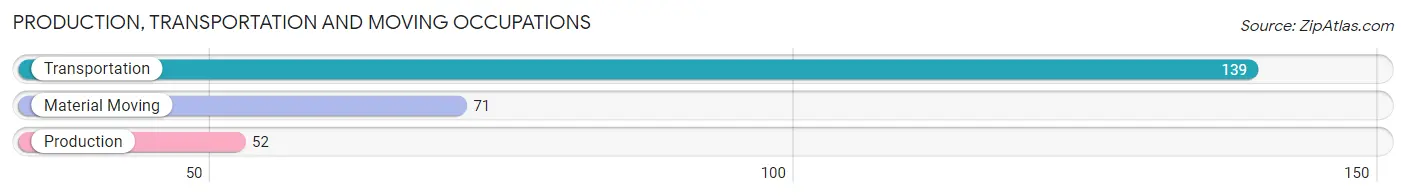
Production, Transportation and Moving Occupations
The most common Production, Transportation and Moving occupations in Mira Monte are Transportation (139 | 4.9%), Material Moving (71 | 2.5%), and Production (52 | 1.8%).
Production, Transportation and Moving Occupations by Sex
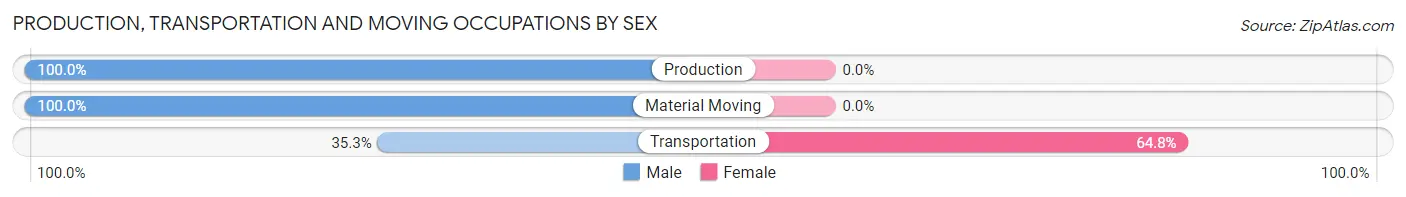
| Occupation | Male | Female |
| Production | 52 (100.0%) | 0 (0.0%) |
| Transportation | 49 (35.2%) | 90 (64.7%) |
| Material Moving | 71 (100.0%) | 0 (0.0%) |
| Total (Category) | 172 (65.6%) | 90 (34.4%) |
| Total (Overall) | 1,472 (52.2%) | 1,346 (47.8%) |
Employment Industries by Sex in Mira Monte
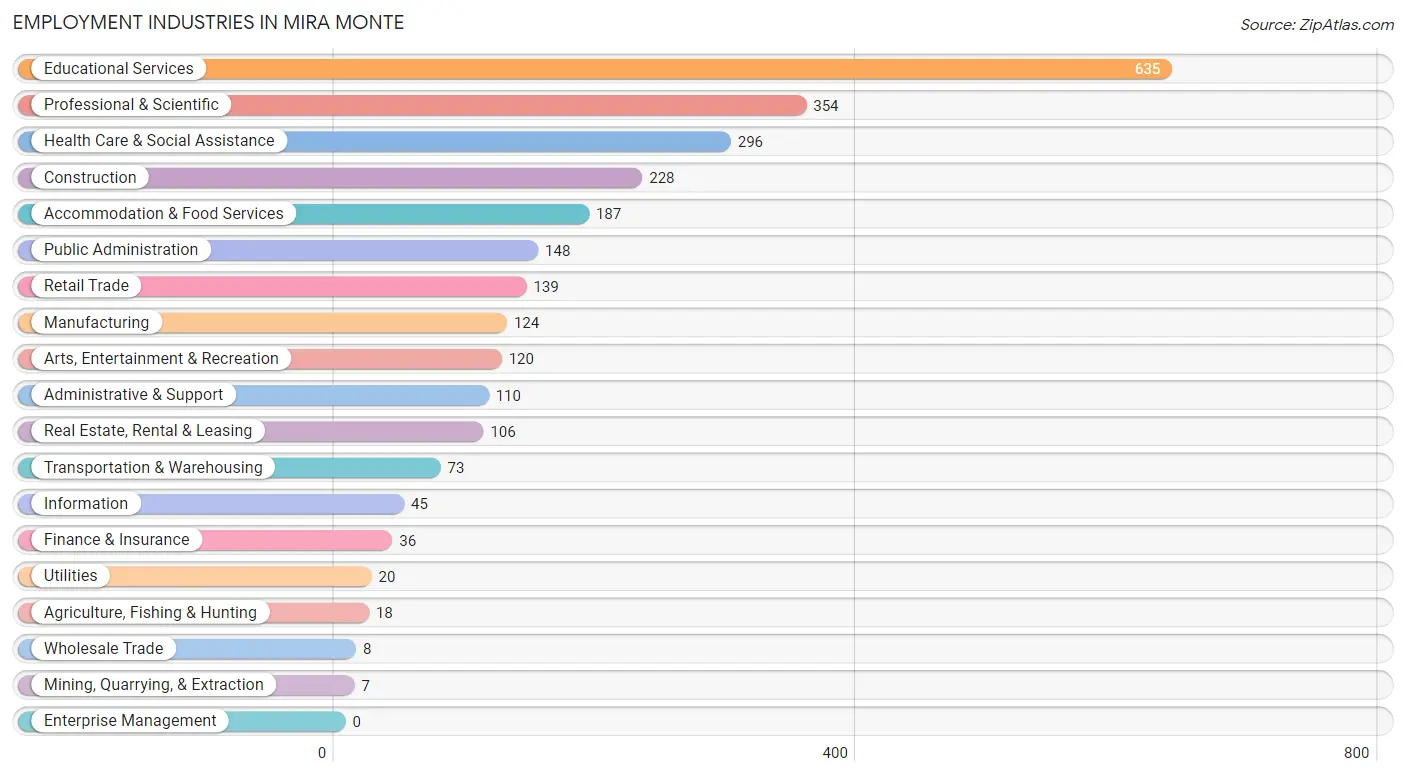
Employment Industries in Mira Monte
The major employment industries in Mira Monte include Educational Services (635 | 22.5%), Professional & Scientific (354 | 12.6%), Health Care & Social Assistance (296 | 10.5%), Construction (228 | 8.1%), and Accommodation & Food Services (187 | 6.6%).
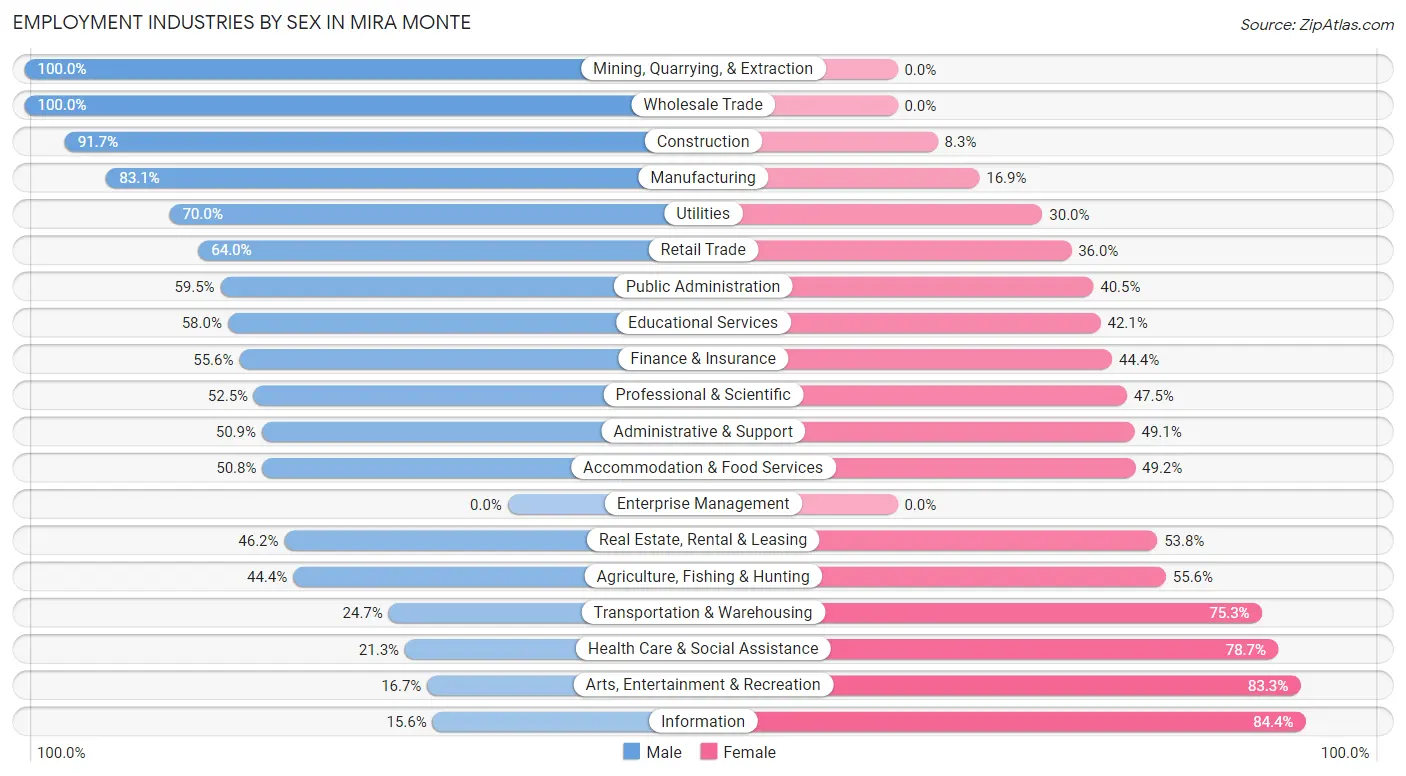
Employment Industries by Sex in Mira Monte
The Mira Monte industries that see more men than women are Mining, Quarrying, & Extraction (100.0%), Wholesale Trade (100.0%), and Construction (91.7%), whereas the industries that tend to have a higher number of women are Information (84.4%), Arts, Entertainment & Recreation (83.3%), and Health Care & Social Assistance (78.7%).
| Industry | Male | Female |
| Agriculture, Fishing & Hunting | 8 (44.4%) | 10 (55.6%) |
| Mining, Quarrying, & Extraction | 7 (100.0%) | 0 (0.0%) |
| Construction | 209 (91.7%) | 19 (8.3%) |
| Manufacturing | 103 (83.1%) | 21 (16.9%) |
| Wholesale Trade | 8 (100.0%) | 0 (0.0%) |
| Retail Trade | 89 (64.0%) | 50 (36.0%) |
| Transportation & Warehousing | 18 (24.7%) | 55 (75.3%) |
| Utilities | 14 (70.0%) | 6 (30.0%) |
| Information | 7 (15.6%) | 38 (84.4%) |
| Finance & Insurance | 20 (55.6%) | 16 (44.4%) |
| Real Estate, Rental & Leasing | 49 (46.2%) | 57 (53.8%) |
| Professional & Scientific | 186 (52.5%) | 168 (47.5%) |
| Enterprise Management | 0 (0.0%) | 0 (0.0%) |
| Administrative & Support | 56 (50.9%) | 54 (49.1%) |
| Educational Services | 368 (58.0%) | 267 (42.0%) |
| Health Care & Social Assistance | 63 (21.3%) | 233 (78.7%) |
| Arts, Entertainment & Recreation | 20 (16.7%) | 100 (83.3%) |
| Accommodation & Food Services | 95 (50.8%) | 92 (49.2%) |
| Public Administration | 88 (59.5%) | 60 (40.5%) |
| Total | 1,472 (52.2%) | 1,346 (47.8%) |
Education in Mira Monte
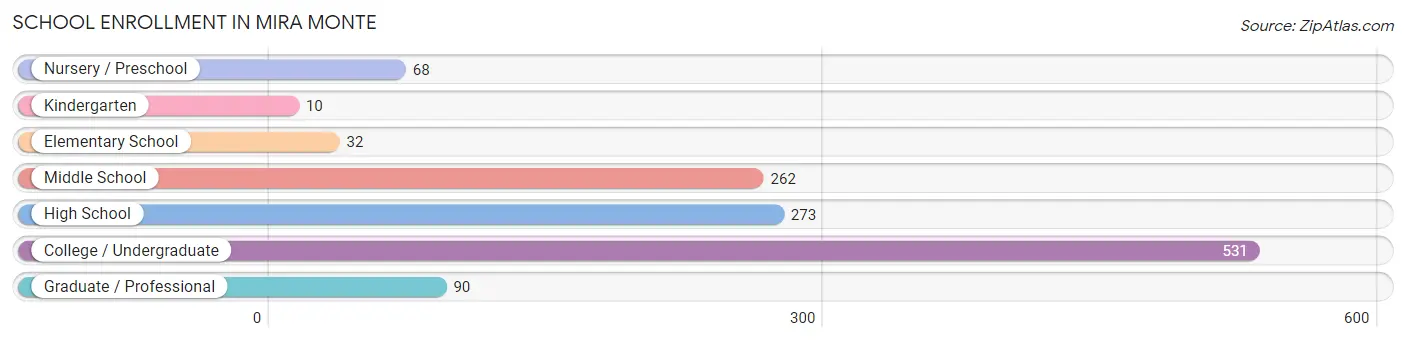
School Enrollment in Mira Monte
The most common levels of schooling among the 1,266 students in Mira Monte are college / undergraduate (531 | 41.9%), high school (273 | 21.6%), and middle school (262 | 20.7%).
| School Level | # Students | % Students |
| Nursery / Preschool | 68 | 5.4% |
| Kindergarten | 10 | 0.8% |
| Elementary School | 32 | 2.5% |
| Middle School | 262 | 20.7% |
| High School | 273 | 21.6% |
| College / Undergraduate | 531 | 41.9% |
| Graduate / Professional | 90 | 7.1% |
| Total | 1,266 | 100.0% |
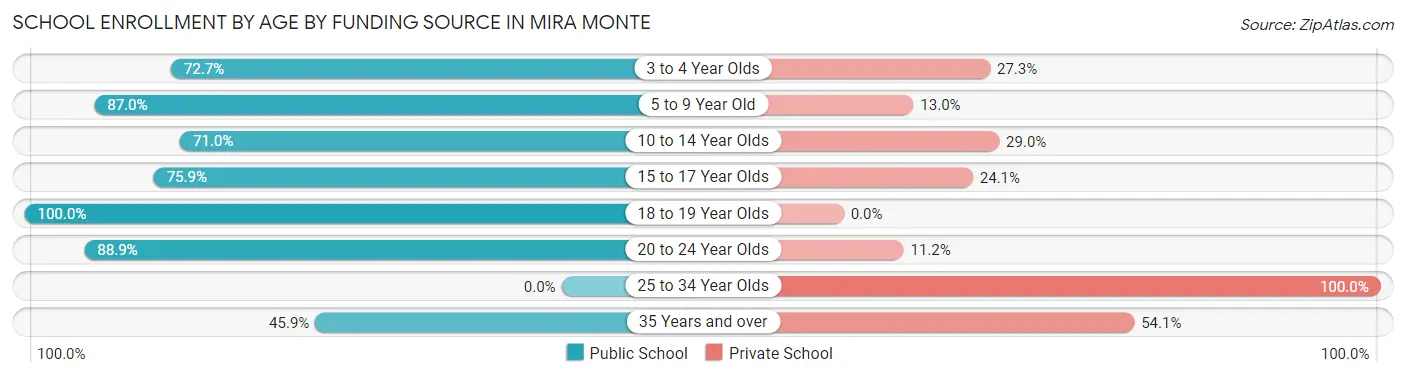
School Enrollment by Age by Funding Source in Mira Monte
Out of a total of 1,266 students who are enrolled in schools in Mira Monte, 300 (23.7%) attend a private institution, while the remaining 966 (76.3%) are enrolled in public schools. The age group of 25 to 34 year olds has the highest likelihood of being enrolled in private schools, with 59 (100.0% in the age bracket) enrolled. Conversely, the age group of 18 to 19 year olds has the lowest likelihood of being enrolled in a private school, with 174 (100.0% in the age bracket) attending a public institution.
| Age Bracket | Public School | Private School |
| 3 to 4 Year Olds | 24 (72.7%) | 9 (27.3%) |
| 5 to 9 Year Old | 67 (87.0%) | 10 (13.0%) |
| 10 to 14 Year Olds | 233 (71.0%) | 95 (29.0%) |
| 15 to 17 Year Olds | 142 (75.9%) | 45 (24.1%) |
| 18 to 19 Year Olds | 174 (100.0%) | 0 (0.0%) |
| 20 to 24 Year Olds | 287 (88.8%) | 36 (11.2%) |
| 25 to 34 Year Olds | 0 (0.0%) | 59 (100.0%) |
| 35 Years and over | 39 (45.9%) | 46 (54.1%) |
| Total | 966 (76.3%) | 300 (23.7%) |
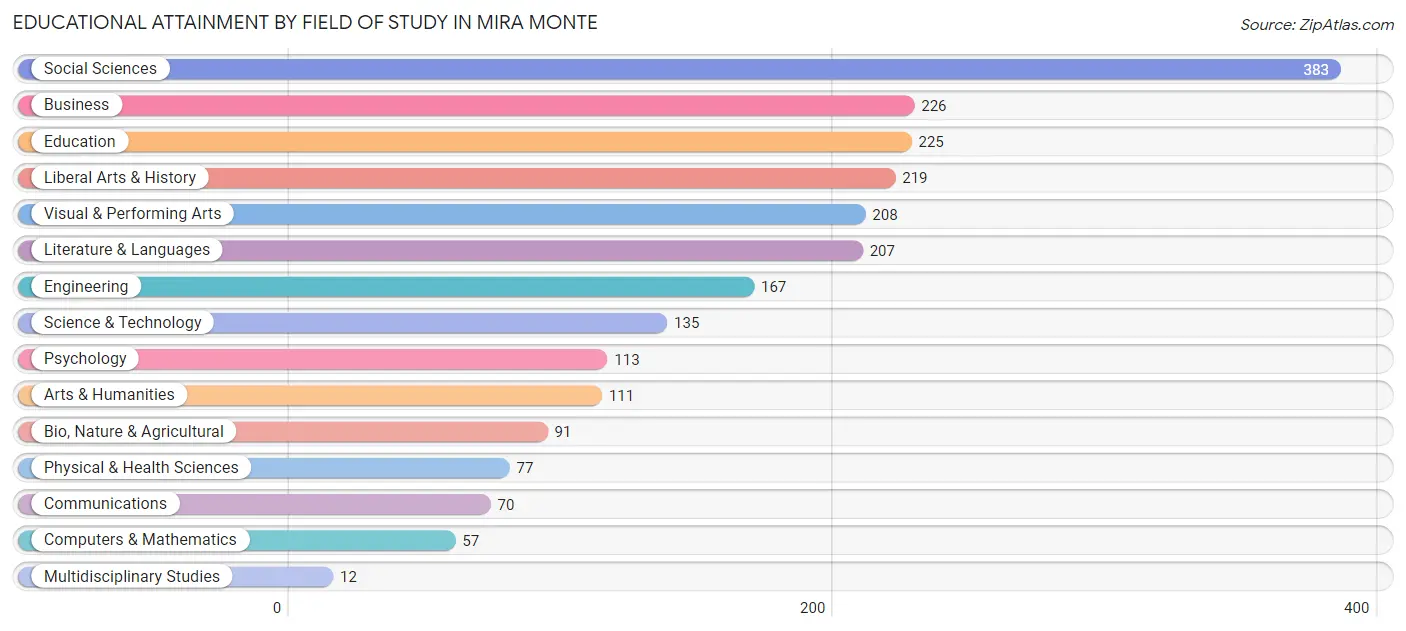
Educational Attainment by Field of Study in Mira Monte
Social sciences (383 | 16.6%), business (226 | 9.8%), education (225 | 9.8%), liberal arts & history (219 | 9.5%), and visual & performing arts (208 | 9.0%) are the most common fields of study among 2,301 individuals in Mira Monte who have obtained a bachelor's degree or higher.
| Field of Study | # Graduates | % Graduates |
| Computers & Mathematics | 57 | 2.5% |
| Bio, Nature & Agricultural | 91 | 4.0% |
| Physical & Health Sciences | 77 | 3.4% |
| Psychology | 113 | 4.9% |
| Social Sciences | 383 | 16.6% |
| Engineering | 167 | 7.3% |
| Multidisciplinary Studies | 12 | 0.5% |
| Science & Technology | 135 | 5.9% |
| Business | 226 | 9.8% |
| Education | 225 | 9.8% |
| Literature & Languages | 207 | 9.0% |
| Liberal Arts & History | 219 | 9.5% |
| Visual & Performing Arts | 208 | 9.0% |
| Communications | 70 | 3.0% |
| Arts & Humanities | 111 | 4.8% |
| Total | 2,301 | 100.0% |
Transportation & Commute in Mira Monte
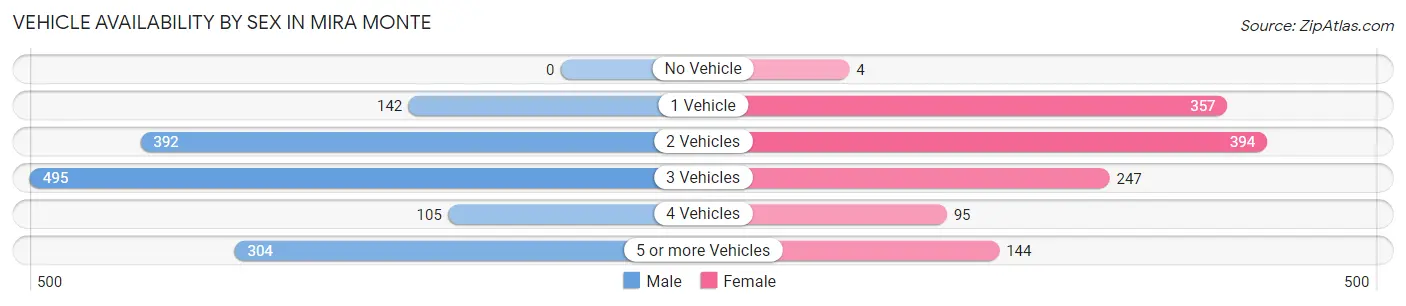
Vehicle Availability by Sex in Mira Monte
The most prevalent vehicle ownership categories in Mira Monte are males with 3 vehicles (495, accounting for 34.4%) and females with 3 vehicles (247, making up 39.9%).
| Vehicles Available | Male | Female |
| No Vehicle | 0 (0.0%) | 4 (0.3%) |
| 1 Vehicle | 142 (9.9%) | 357 (28.8%) |
| 2 Vehicles | 392 (27.3%) | 394 (31.8%) |
| 3 Vehicles | 495 (34.4%) | 247 (19.9%) |
| 4 Vehicles | 105 (7.3%) | 95 (7.7%) |
| 5 or more Vehicles | 304 (21.1%) | 144 (11.6%) |
| Total | 1,438 (100.0%) | 1,241 (100.0%) |
Commute Time in Mira Monte
The most frequently occuring commute durations in Mira Monte are 20 to 24 minutes (435 commuters, 20.4%), 10 to 14 minutes (324 commuters, 15.2%), and 15 to 19 minutes (308 commuters, 14.4%).
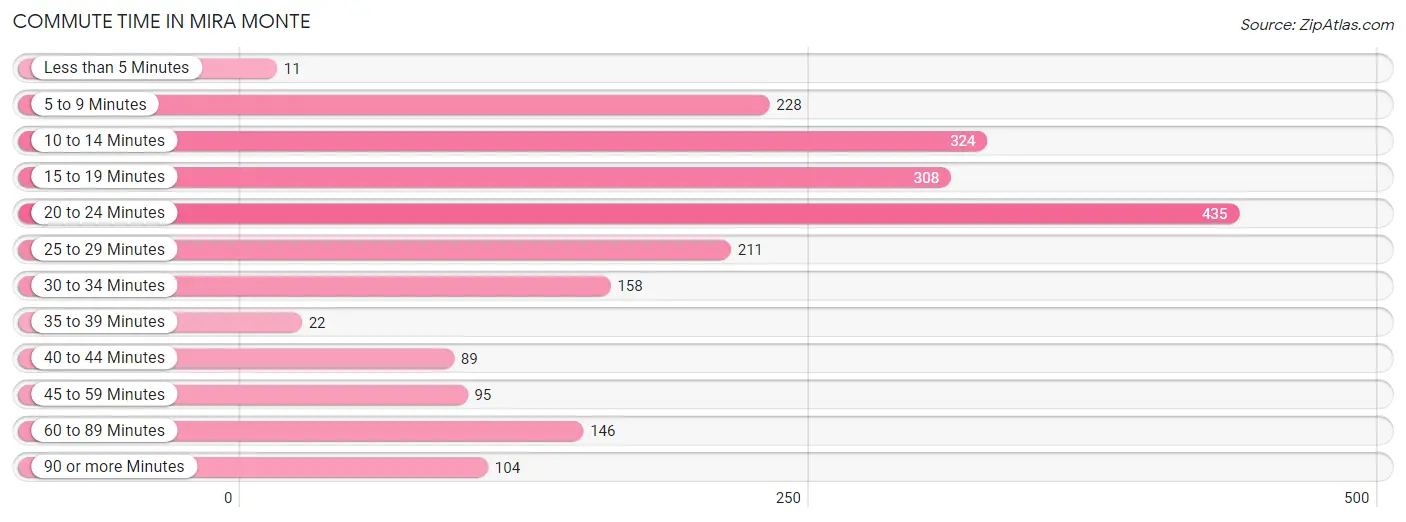
| Commute Time | # Commuters | % Commuters |
| Less than 5 Minutes | 11 | 0.5% |
| 5 to 9 Minutes | 228 | 10.7% |
| 10 to 14 Minutes | 324 | 15.2% |
| 15 to 19 Minutes | 308 | 14.4% |
| 20 to 24 Minutes | 435 | 20.4% |
| 25 to 29 Minutes | 211 | 9.9% |
| 30 to 34 Minutes | 158 | 7.4% |
| 35 to 39 Minutes | 22 | 1.0% |
| 40 to 44 Minutes | 89 | 4.2% |
| 45 to 59 Minutes | 95 | 4.5% |
| 60 to 89 Minutes | 146 | 6.9% |
| 90 or more Minutes | 104 | 4.9% |
Commute Time by Sex in Mira Monte
The most common commute times in Mira Monte are 20 to 24 minutes (203 commuters, 17.3%) for males and 20 to 24 minutes (232 commuters, 24.2%) for females.
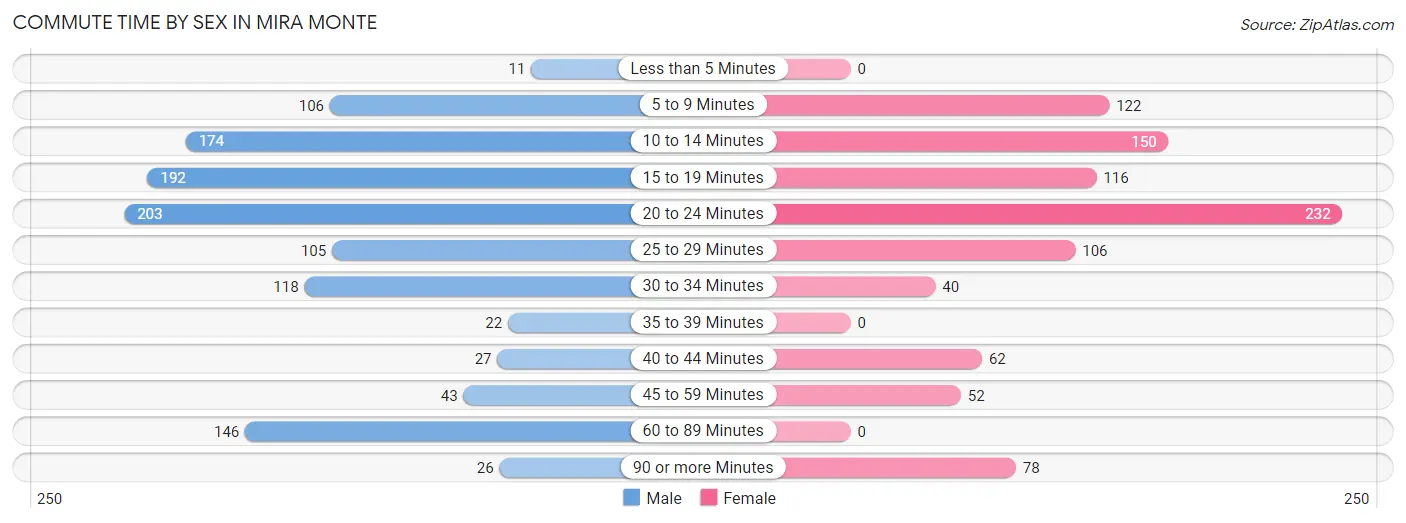
| Commute Time | Male | Female |
| Less than 5 Minutes | 11 (0.9%) | 0 (0.0%) |
| 5 to 9 Minutes | 106 (9.0%) | 122 (12.7%) |
| 10 to 14 Minutes | 174 (14.8%) | 150 (15.7%) |
| 15 to 19 Minutes | 192 (16.4%) | 116 (12.1%) |
| 20 to 24 Minutes | 203 (17.3%) | 232 (24.2%) |
| 25 to 29 Minutes | 105 (8.9%) | 106 (11.1%) |
| 30 to 34 Minutes | 118 (10.1%) | 40 (4.2%) |
| 35 to 39 Minutes | 22 (1.9%) | 0 (0.0%) |
| 40 to 44 Minutes | 27 (2.3%) | 62 (6.5%) |
| 45 to 59 Minutes | 43 (3.7%) | 52 (5.4%) |
| 60 to 89 Minutes | 146 (12.4%) | 0 (0.0%) |
| 90 or more Minutes | 26 (2.2%) | 78 (8.1%) |
Time of Departure to Work by Sex in Mira Monte
The most frequent times of departure to work in Mira Monte are 8:30 AM to 8:59 AM (229, 19.5%) for males and 9:00 AM to 9:59 AM (209, 21.8%) for females.
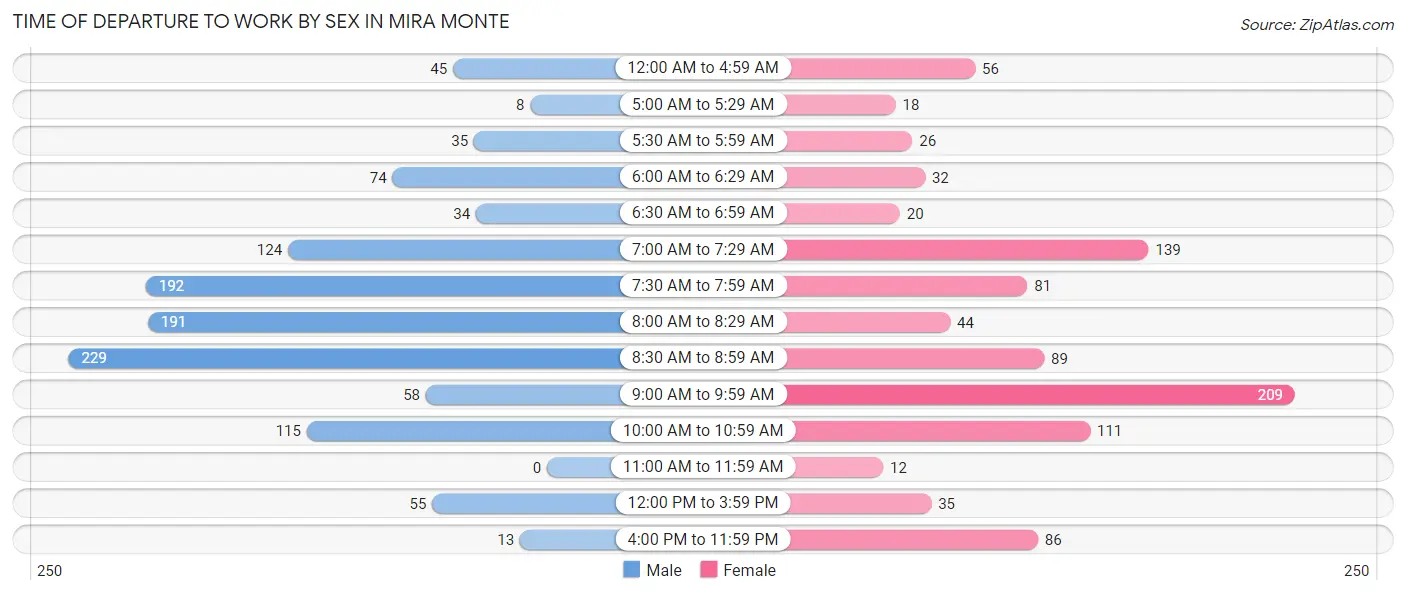
| Time of Departure | Male | Female |
| 12:00 AM to 4:59 AM | 45 (3.8%) | 56 (5.9%) |
| 5:00 AM to 5:29 AM | 8 (0.7%) | 18 (1.9%) |
| 5:30 AM to 5:59 AM | 35 (3.0%) | 26 (2.7%) |
| 6:00 AM to 6:29 AM | 74 (6.3%) | 32 (3.3%) |
| 6:30 AM to 6:59 AM | 34 (2.9%) | 20 (2.1%) |
| 7:00 AM to 7:29 AM | 124 (10.6%) | 139 (14.5%) |
| 7:30 AM to 7:59 AM | 192 (16.4%) | 81 (8.5%) |
| 8:00 AM to 8:29 AM | 191 (16.3%) | 44 (4.6%) |
| 8:30 AM to 8:59 AM | 229 (19.5%) | 89 (9.3%) |
| 9:00 AM to 9:59 AM | 58 (4.9%) | 209 (21.8%) |
| 10:00 AM to 10:59 AM | 115 (9.8%) | 111 (11.6%) |
| 11:00 AM to 11:59 AM | 0 (0.0%) | 12 (1.3%) |
| 12:00 PM to 3:59 PM | 55 (4.7%) | 35 (3.6%) |
| 4:00 PM to 11:59 PM | 13 (1.1%) | 86 (9.0%) |
| Total | 1,173 (100.0%) | 958 (100.0%) |
Housing Occupancy in Mira Monte
Occupancy by Ownership in Mira Monte
Of the total 2,838 dwellings in Mira Monte, owner-occupied units account for 2,445 (86.2%), while renter-occupied units make up 393 (13.9%).
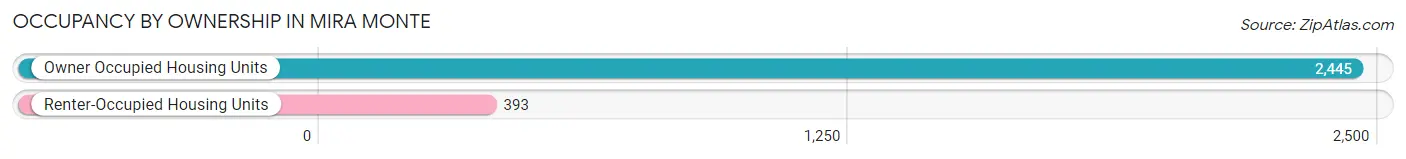
| Occupancy | # Housing Units | % Housing Units |
| Owner Occupied Housing Units | 2,445 | 86.2% |
| Renter-Occupied Housing Units | 393 | 13.9% |
| Total Occupied Housing Units | 2,838 | 100.0% |
Occupancy by Household Size in Mira Monte
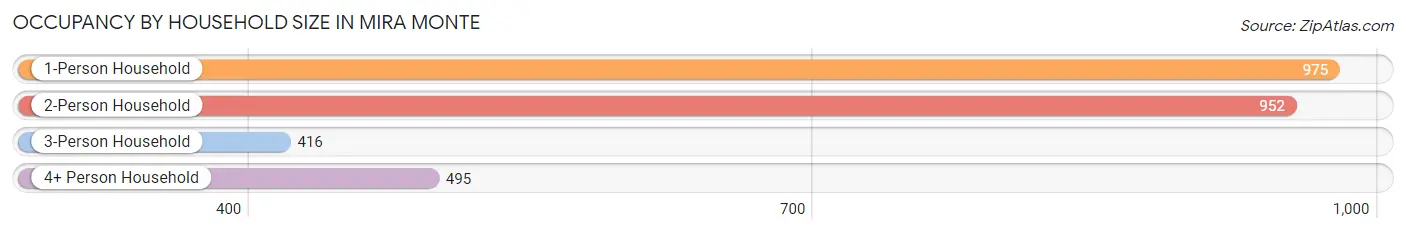
| Household Size | # Housing Units | % Housing Units |
| 1-Person Household | 975 | 34.4% |
| 2-Person Household | 952 | 33.5% |
| 3-Person Household | 416 | 14.7% |
| 4+ Person Household | 495 | 17.4% |
| Total Housing Units | 2,838 | 100.0% |
Occupancy by Ownership by Household Size in Mira Monte
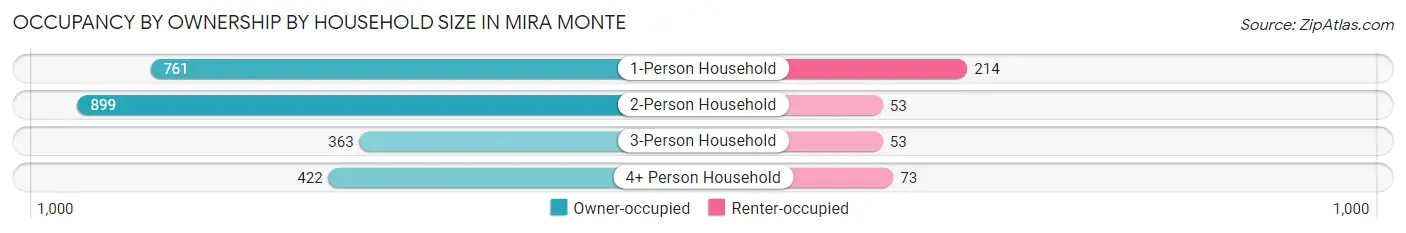
| Household Size | Owner-occupied | Renter-occupied |
| 1-Person Household | 761 (78.0%) | 214 (22.0%) |
| 2-Person Household | 899 (94.4%) | 53 (5.6%) |
| 3-Person Household | 363 (87.3%) | 53 (12.7%) |
| 4+ Person Household | 422 (85.3%) | 73 (14.7%) |
| Total Housing Units | 2,445 (86.2%) | 393 (13.9%) |
Occupancy by Educational Attainment in Mira Monte
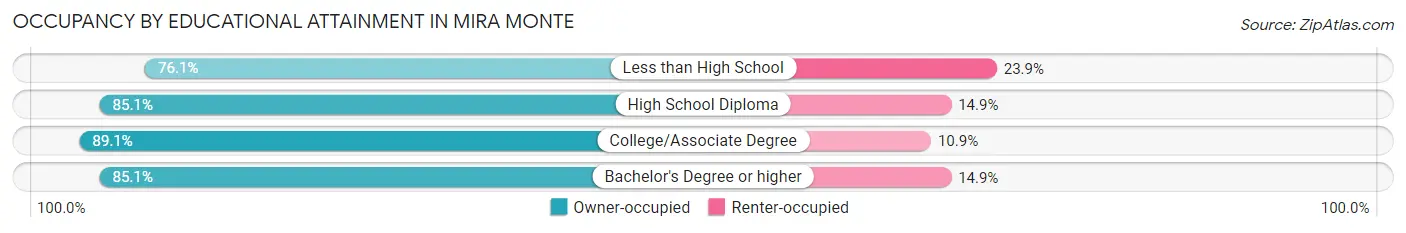
| Household Size | Owner-occupied | Renter-occupied |
| Less than High School | 140 (76.1%) | 44 (23.9%) |
| High School Diploma | 286 (85.1%) | 50 (14.9%) |
| College/Associate Degree | 1,017 (89.1%) | 124 (10.9%) |
| Bachelor's Degree or higher | 1,002 (85.1%) | 175 (14.9%) |
Occupancy by Age of Householder in Mira Monte
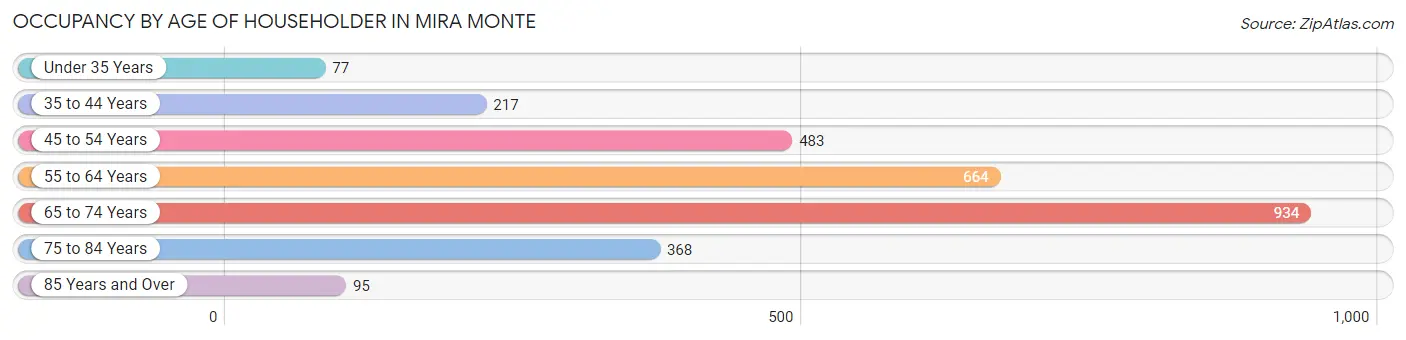
| Age Bracket | # Households | % Households |
| Under 35 Years | 77 | 2.7% |
| 35 to 44 Years | 217 | 7.6% |
| 45 to 54 Years | 483 | 17.0% |
| 55 to 64 Years | 664 | 23.4% |
| 65 to 74 Years | 934 | 32.9% |
| 75 to 84 Years | 368 | 13.0% |
| 85 Years and Over | 95 | 3.4% |
| Total | 2,838 | 100.0% |
Housing Finances in Mira Monte
Median Income by Occupancy in Mira Monte
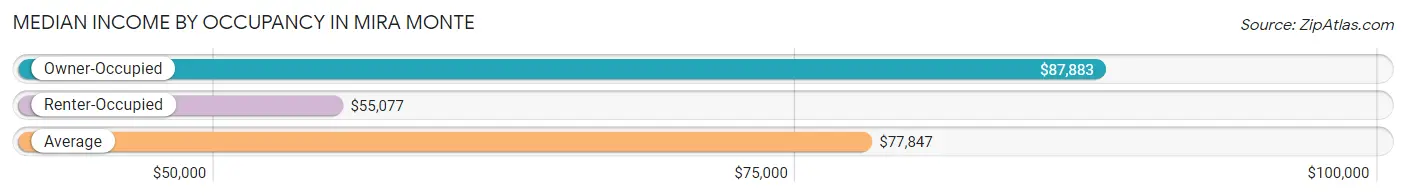
| Occupancy Type | # Households | Median Income |
| Owner-Occupied | 2,445 (86.2%) | $87,883 |
| Renter-Occupied | 393 (13.9%) | $55,077 |
| Average | 2,838 (100.0%) | $77,847 |
Occupancy by Householder Income Bracket in Mira Monte
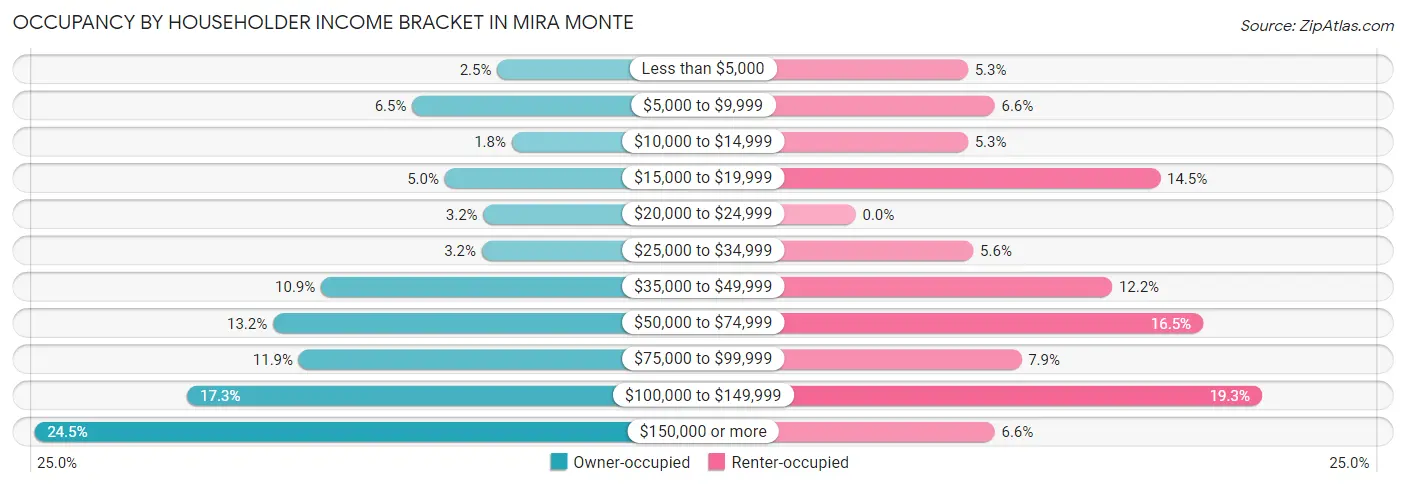
| Income Bracket | Owner-occupied | Renter-occupied |
| Less than $5,000 | 61 (2.5%) | 21 (5.3%) |
| $5,000 to $9,999 | 160 (6.5%) | 26 (6.6%) |
| $10,000 to $14,999 | 44 (1.8%) | 21 (5.3%) |
| $15,000 to $19,999 | 122 (5.0%) | 57 (14.5%) |
| $20,000 to $24,999 | 77 (3.2%) | 0 (0.0%) |
| $25,000 to $34,999 | 79 (3.2%) | 22 (5.6%) |
| $35,000 to $49,999 | 266 (10.9%) | 48 (12.2%) |
| $50,000 to $74,999 | 322 (13.2%) | 65 (16.5%) |
| $75,000 to $99,999 | 292 (11.9%) | 31 (7.9%) |
| $100,000 to $149,999 | 422 (17.3%) | 76 (19.3%) |
| $150,000 or more | 600 (24.5%) | 26 (6.6%) |
| Total | 2,445 (100.0%) | 393 (100.0%) |
Monthly Housing Cost Tiers in Mira Monte
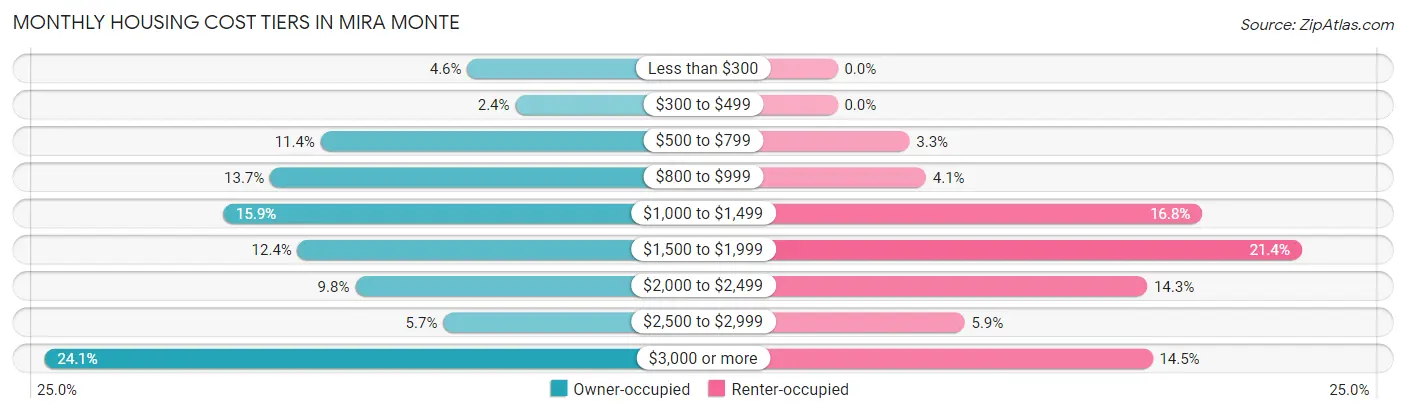
| Monthly Cost | Owner-occupied | Renter-occupied |
| Less than $300 | 113 (4.6%) | 0 (0.0%) |
| $300 to $499 | 59 (2.4%) | 0 (0.0%) |
| $500 to $799 | 278 (11.4%) | 13 (3.3%) |
| $800 to $999 | 335 (13.7%) | 16 (4.1%) |
| $1,000 to $1,499 | 388 (15.9%) | 66 (16.8%) |
| $1,500 to $1,999 | 304 (12.4%) | 84 (21.4%) |
| $2,000 to $2,499 | 239 (9.8%) | 56 (14.2%) |
| $2,500 to $2,999 | 140 (5.7%) | 23 (5.9%) |
| $3,000 or more | 589 (24.1%) | 57 (14.5%) |
| Total | 2,445 (100.0%) | 393 (100.0%) |
Physical Housing Characteristics in Mira Monte
Housing Structures in Mira Monte
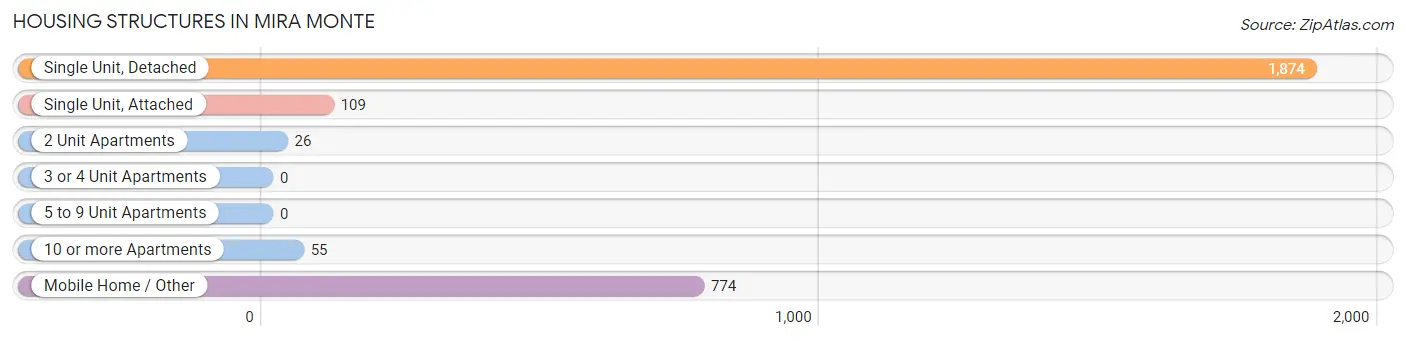
| Structure Type | # Housing Units | % Housing Units |
| Single Unit, Detached | 1,874 | 66.0% |
| Single Unit, Attached | 109 | 3.8% |
| 2 Unit Apartments | 26 | 0.9% |
| 3 or 4 Unit Apartments | 0 | 0.0% |
| 5 to 9 Unit Apartments | 0 | 0.0% |
| 10 or more Apartments | 55 | 1.9% |
| Mobile Home / Other | 774 | 27.3% |
| Total | 2,838 | 100.0% |
Housing Structures by Occupancy in Mira Monte
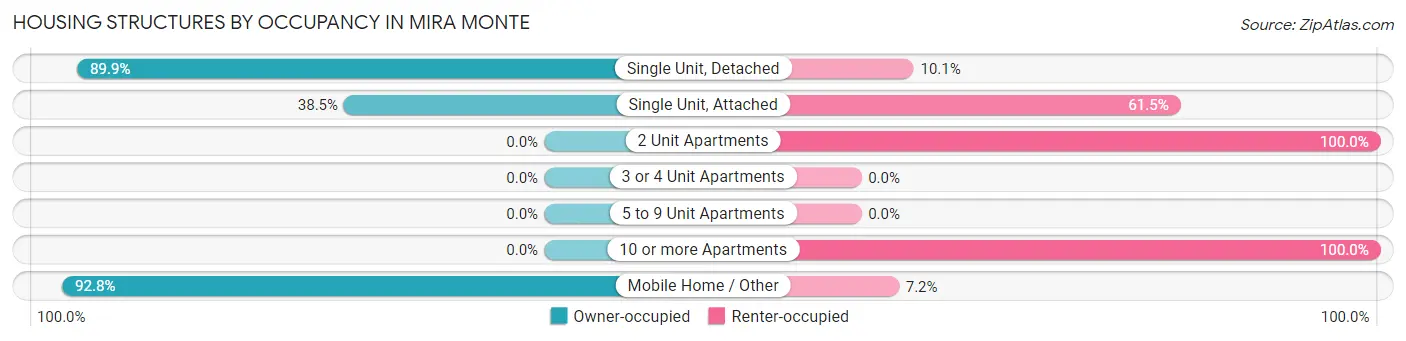
| Structure Type | Owner-occupied | Renter-occupied |
| Single Unit, Detached | 1,685 (89.9%) | 189 (10.1%) |
| Single Unit, Attached | 42 (38.5%) | 67 (61.5%) |
| 2 Unit Apartments | 0 (0.0%) | 26 (100.0%) |
| 3 or 4 Unit Apartments | 0 (0.0%) | 0 (0.0%) |
| 5 to 9 Unit Apartments | 0 (0.0%) | 0 (0.0%) |
| 10 or more Apartments | 0 (0.0%) | 55 (100.0%) |
| Mobile Home / Other | 718 (92.8%) | 56 (7.2%) |
| Total | 2,445 (86.2%) | 393 (13.9%) |
Housing Structures by Number of Rooms in Mira Monte
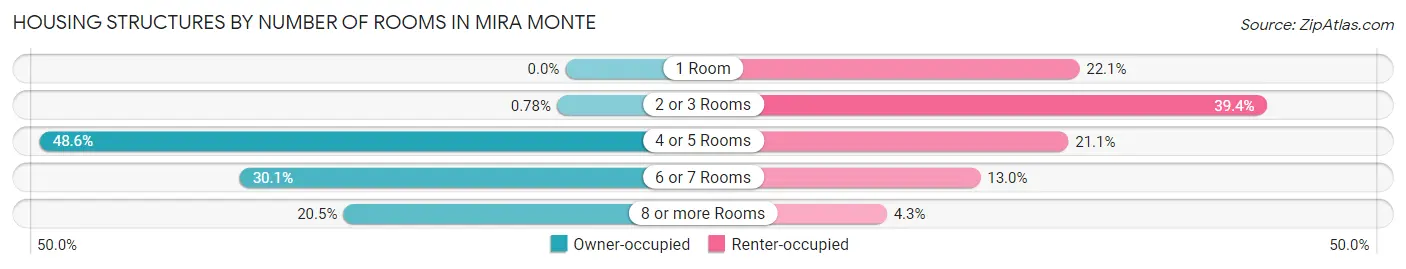
| Number of Rooms | Owner-occupied | Renter-occupied |
| 1 Room | 0 (0.0%) | 87 (22.1%) |
| 2 or 3 Rooms | 19 (0.8%) | 155 (39.4%) |
| 4 or 5 Rooms | 1,188 (48.6%) | 83 (21.1%) |
| 6 or 7 Rooms | 736 (30.1%) | 51 (13.0%) |
| 8 or more Rooms | 502 (20.5%) | 17 (4.3%) |
| Total | 2,445 (100.0%) | 393 (100.0%) |
Housing Structure by Heating Type in Mira Monte
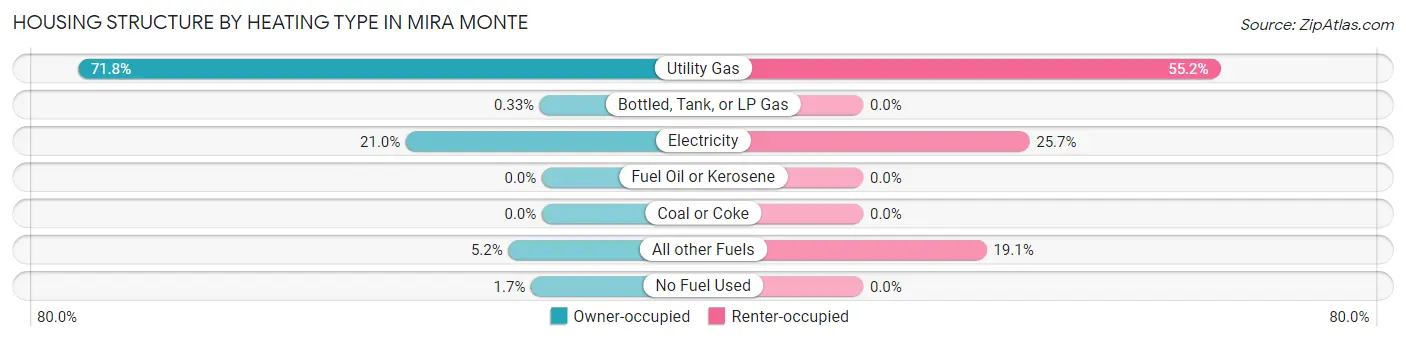
| Heating Type | Owner-occupied | Renter-occupied |
| Utility Gas | 1,755 (71.8%) | 217 (55.2%) |
| Bottled, Tank, or LP Gas | 8 (0.3%) | 0 (0.0%) |
| Electricity | 514 (21.0%) | 101 (25.7%) |
| Fuel Oil or Kerosene | 0 (0.0%) | 0 (0.0%) |
| Coal or Coke | 0 (0.0%) | 0 (0.0%) |
| All other Fuels | 127 (5.2%) | 75 (19.1%) |
| No Fuel Used | 41 (1.7%) | 0 (0.0%) |
| Total | 2,445 (100.0%) | 393 (100.0%) |
Household Vehicle Usage in Mira Monte
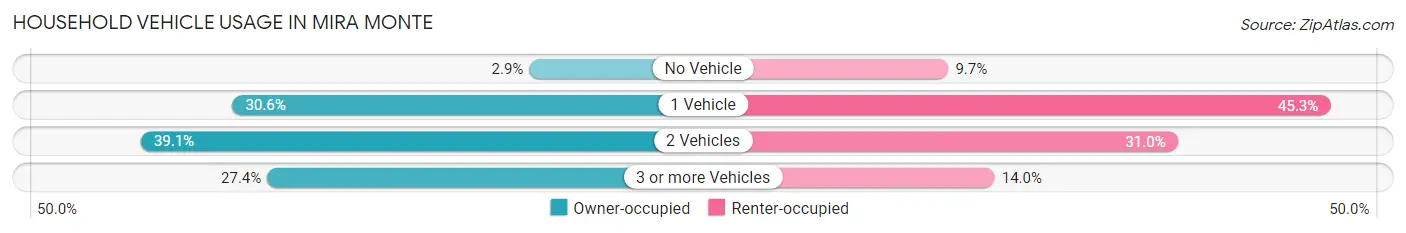
| Vehicles per Household | Owner-occupied | Renter-occupied |
| No Vehicle | 71 (2.9%) | 38 (9.7%) |
| 1 Vehicle | 748 (30.6%) | 178 (45.3%) |
| 2 Vehicles | 957 (39.1%) | 122 (31.0%) |
| 3 or more Vehicles | 669 (27.4%) | 55 (14.0%) |
| Total | 2,445 (100.0%) | 393 (100.0%) |
Real Estate & Mortgages in Mira Monte
Real Estate and Mortgage Overview in Mira Monte
| Characteristic | Without Mortgage | With Mortgage |
| Housing Units | 1,249 | 1,196 |
| Median Property Value | $758,200 | $822,200 |
| Median Household Income | $45,886 | $429 |
| Monthly Housing Costs | $949 | $542 |
| Real Estate Taxes | $2,652 | $9 |
Property Value by Mortgage Status in Mira Monte
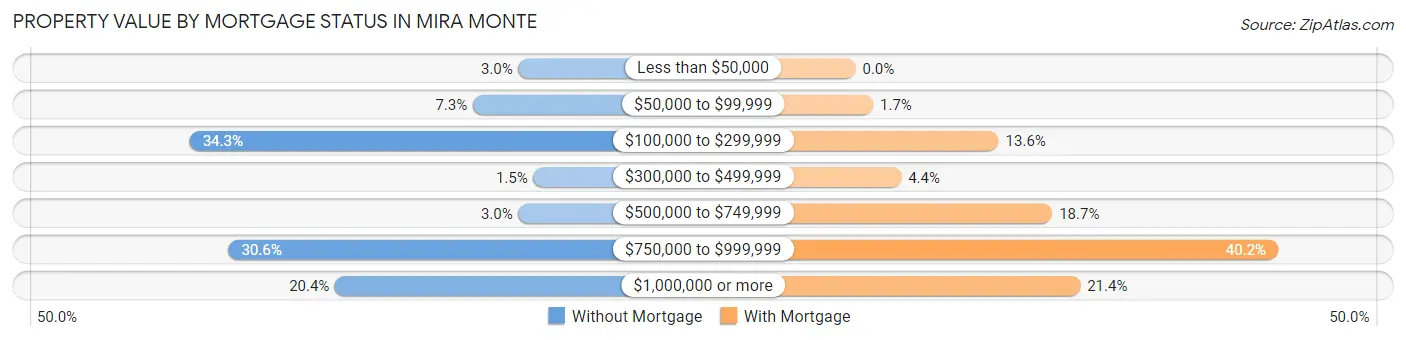
| Property Value | Without Mortgage | With Mortgage |
| Less than $50,000 | 37 (3.0%) | 0 (0.0%) |
| $50,000 to $99,999 | 91 (7.3%) | 20 (1.7%) |
| $100,000 to $299,999 | 428 (34.3%) | 163 (13.6%) |
| $300,000 to $499,999 | 19 (1.5%) | 52 (4.3%) |
| $500,000 to $749,999 | 37 (3.0%) | 224 (18.7%) |
| $750,000 to $999,999 | 382 (30.6%) | 481 (40.2%) |
| $1,000,000 or more | 255 (20.4%) | 256 (21.4%) |
| Total | 1,249 (100.0%) | 1,196 (100.0%) |
Household Income by Mortgage Status in Mira Monte
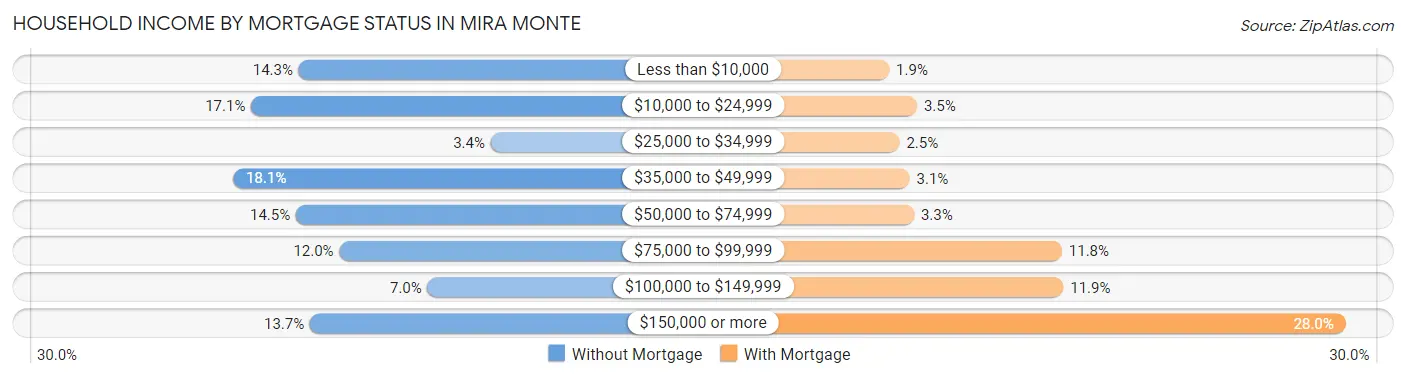
| Household Income | Without Mortgage | With Mortgage |
| Less than $10,000 | 179 (14.3%) | 23 (1.9%) |
| $10,000 to $24,999 | 213 (17.1%) | 42 (3.5%) |
| $25,000 to $34,999 | 42 (3.4%) | 30 (2.5%) |
| $35,000 to $49,999 | 226 (18.1%) | 37 (3.1%) |
| $50,000 to $74,999 | 181 (14.5%) | 40 (3.3%) |
| $75,000 to $99,999 | 150 (12.0%) | 141 (11.8%) |
| $100,000 to $149,999 | 87 (7.0%) | 142 (11.9%) |
| $150,000 or more | 171 (13.7%) | 335 (28.0%) |
| Total | 1,249 (100.0%) | 1,196 (100.0%) |
Property Value to Household Income Ratio in Mira Monte
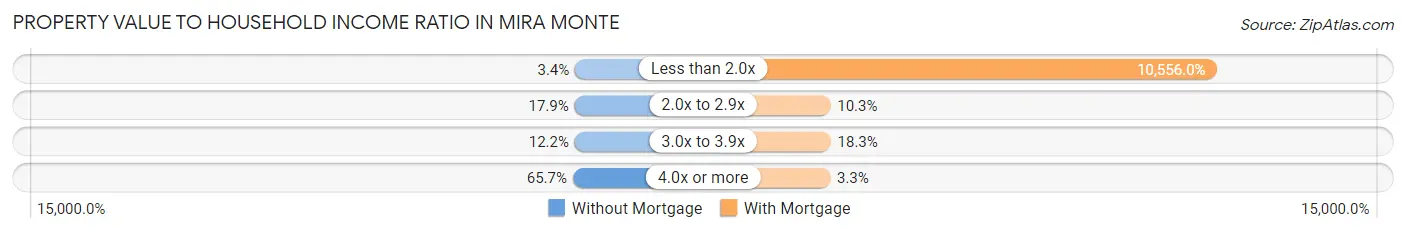
| Value-to-Income Ratio | Without Mortgage | With Mortgage |
| Less than 2.0x | 43 (3.4%) | 126,250 (10,556.0%) |
| 2.0x to 2.9x | 224 (17.9%) | 123 (10.3%) |
| 3.0x to 3.9x | 152 (12.2%) | 219 (18.3%) |
| 4.0x or more | 820 (65.6%) | 40 (3.3%) |
| Total | 1,249 (100.0%) | 1,196 (100.0%) |
Real Estate Taxes by Mortgage Status in Mira Monte
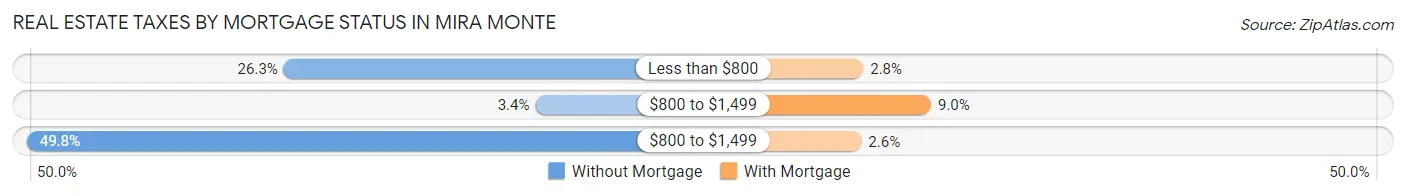
| Property Taxes | Without Mortgage | With Mortgage |
| Less than $800 | 329 (26.3%) | 33 (2.8%) |
| $800 to $1,499 | 42 (3.4%) | 107 (8.9%) |
| $800 to $1,499 | 622 (49.8%) | 31 (2.6%) |
| Total | 1,249 (100.0%) | 1,196 (100.0%) |
Health & Disability in Mira Monte
Health Insurance Coverage by Age in Mira Monte
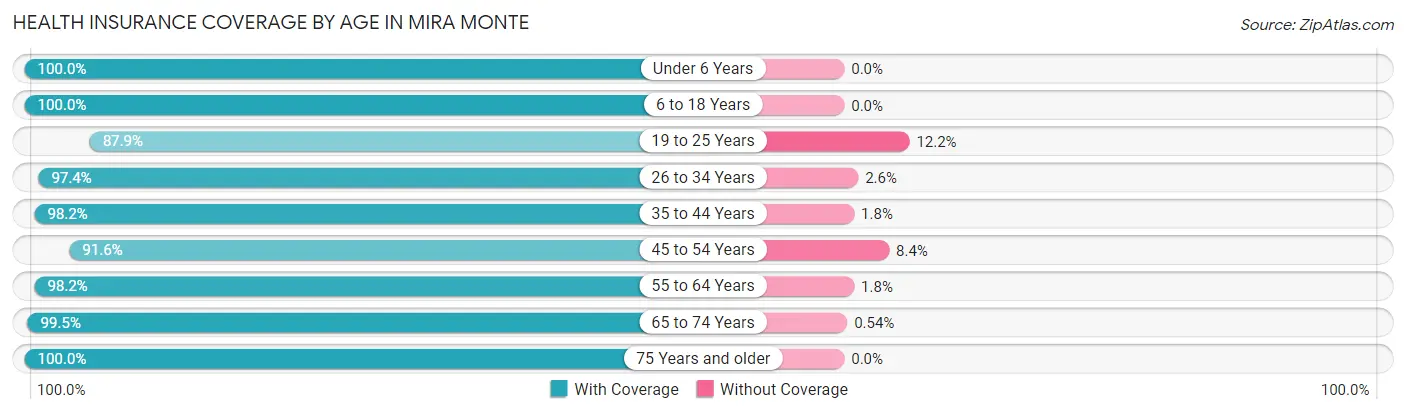
| Age Bracket | With Coverage | Without Coverage |
| Under 6 Years | 283 (100.0%) | 0 (0.0%) |
| 6 to 18 Years | 590 (100.0%) | 0 (0.0%) |
| 19 to 25 Years | 593 (87.8%) | 82 (12.1%) |
| 26 to 34 Years | 338 (97.4%) | 9 (2.6%) |
| 35 to 44 Years | 695 (98.2%) | 13 (1.8%) |
| 45 to 54 Years | 877 (91.6%) | 80 (8.4%) |
| 55 to 64 Years | 1,069 (98.2%) | 20 (1.8%) |
| 65 to 74 Years | 1,477 (99.5%) | 8 (0.5%) |
| 75 Years and older | 700 (100.0%) | 0 (0.0%) |
| Total | 6,622 (96.9%) | 212 (3.1%) |
Health Insurance Coverage by Citizenship Status in Mira Monte
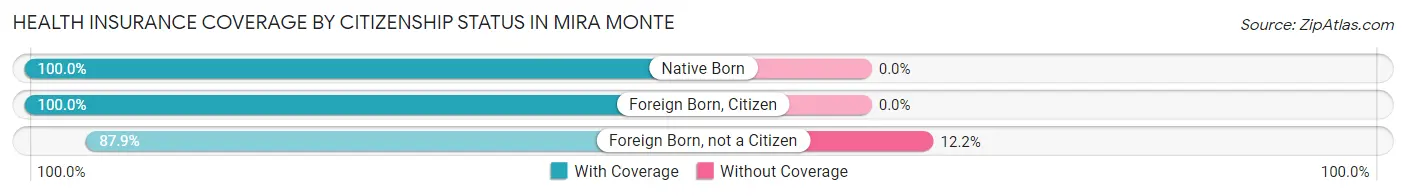
| Citizenship Status | With Coverage | Without Coverage |
| Native Born | 283 (100.0%) | 0 (0.0%) |
| Foreign Born, Citizen | 590 (100.0%) | 0 (0.0%) |
| Foreign Born, not a Citizen | 593 (87.8%) | 82 (12.1%) |
Health Insurance Coverage by Household Income in Mira Monte
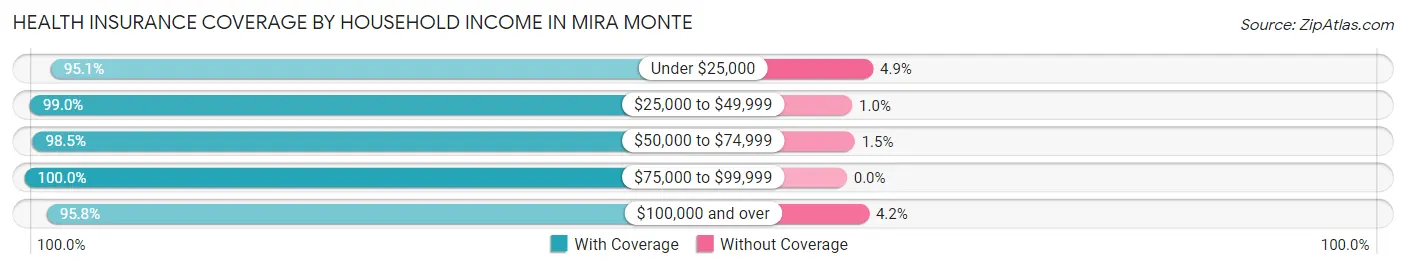
| Household Income | With Coverage | Without Coverage |
| Under $25,000 | 888 (95.1%) | 46 (4.9%) |
| $25,000 to $49,999 | 791 (99.0%) | 8 (1.0%) |
| $50,000 to $74,999 | 595 (98.5%) | 9 (1.5%) |
| $75,000 to $99,999 | 857 (100.0%) | 0 (0.0%) |
| $100,000 and over | 3,433 (95.8%) | 149 (4.2%) |
Public vs Private Health Insurance Coverage by Age in Mira Monte
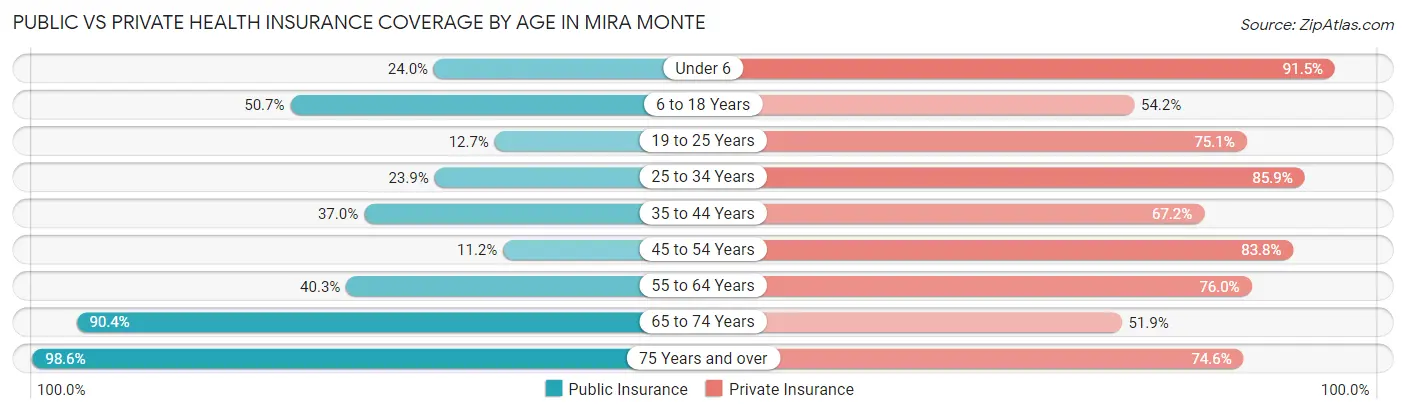
| Age Bracket | Public Insurance | Private Insurance |
| Under 6 | 68 (24.0%) | 259 (91.5%) |
| 6 to 18 Years | 299 (50.7%) | 320 (54.2%) |
| 19 to 25 Years | 86 (12.7%) | 507 (75.1%) |
| 25 to 34 Years | 83 (23.9%) | 298 (85.9%) |
| 35 to 44 Years | 262 (37.0%) | 476 (67.2%) |
| 45 to 54 Years | 107 (11.2%) | 802 (83.8%) |
| 55 to 64 Years | 439 (40.3%) | 828 (76.0%) |
| 65 to 74 Years | 1,342 (90.4%) | 771 (51.9%) |
| 75 Years and over | 690 (98.6%) | 522 (74.6%) |
| Total | 3,376 (49.4%) | 4,783 (70.0%) |
Disability Status by Sex by Age in Mira Monte
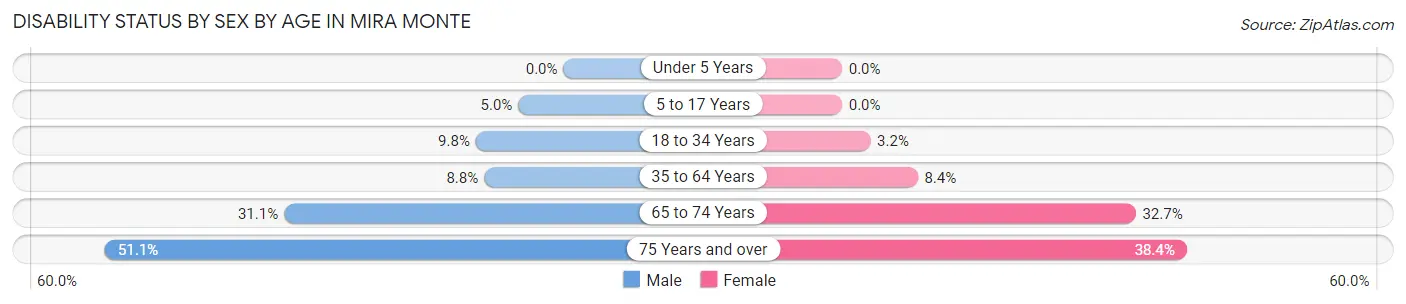
| Age Bracket | Male | Female |
| Under 5 Years | 0 (0.0%) | 0 (0.0%) |
| 5 to 17 Years | 18 (5.0%) | 0 (0.0%) |
| 18 to 34 Years | 57 (9.8%) | 15 (3.2%) |
| 35 to 64 Years | 105 (8.8%) | 132 (8.4%) |
| 65 to 74 Years | 228 (31.1%) | 246 (32.7%) |
| 75 Years and over | 146 (51.0%) | 159 (38.4%) |
Disability Class by Sex by Age in Mira Monte
Disability Class: Hearing Difficulty
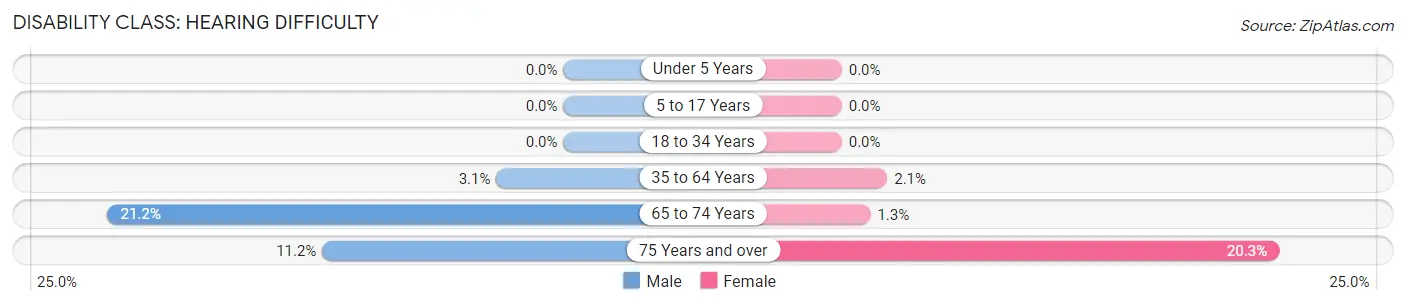
| Age Bracket | Male | Female |
| Under 5 Years | 0 (0.0%) | 0 (0.0%) |
| 5 to 17 Years | 0 (0.0%) | 0 (0.0%) |
| 18 to 34 Years | 0 (0.0%) | 0 (0.0%) |
| 35 to 64 Years | 37 (3.1%) | 33 (2.1%) |
| 65 to 74 Years | 155 (21.1%) | 10 (1.3%) |
| 75 Years and over | 32 (11.2%) | 84 (20.3%) |
Disability Class: Vision Difficulty
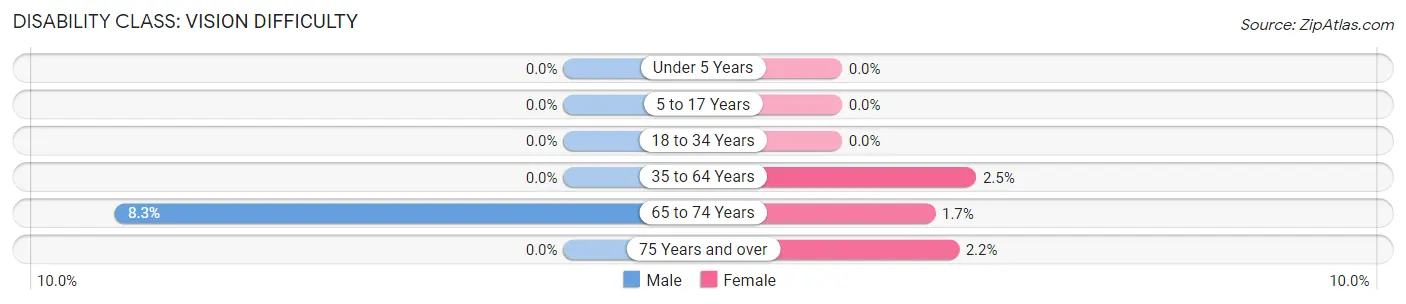
| Age Bracket | Male | Female |
| Under 5 Years | 0 (0.0%) | 0 (0.0%) |
| 5 to 17 Years | 0 (0.0%) | 0 (0.0%) |
| 18 to 34 Years | 0 (0.0%) | 0 (0.0%) |
| 35 to 64 Years | 0 (0.0%) | 39 (2.5%) |
| 65 to 74 Years | 61 (8.3%) | 13 (1.7%) |
| 75 Years and over | 0 (0.0%) | 9 (2.2%) |
Disability Class: Cognitive Difficulty
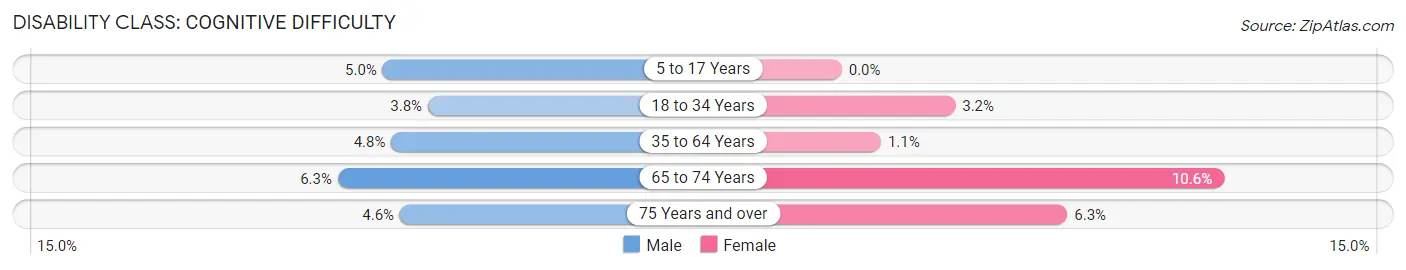
| Age Bracket | Male | Female |
| 5 to 17 Years | 18 (5.0%) | 0 (0.0%) |
| 18 to 34 Years | 22 (3.8%) | 15 (3.2%) |
| 35 to 64 Years | 57 (4.8%) | 17 (1.1%) |
| 65 to 74 Years | 46 (6.3%) | 80 (10.6%) |
| 75 Years and over | 13 (4.5%) | 26 (6.3%) |
Disability Class: Ambulatory Difficulty
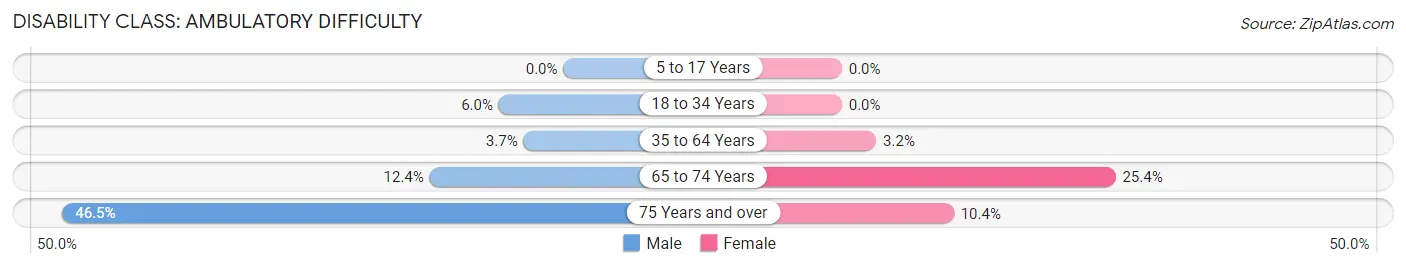
| Age Bracket | Male | Female |
| 5 to 17 Years | 0 (0.0%) | 0 (0.0%) |
| 18 to 34 Years | 35 (6.0%) | 0 (0.0%) |
| 35 to 64 Years | 44 (3.7%) | 50 (3.2%) |
| 65 to 74 Years | 91 (12.4%) | 191 (25.4%) |
| 75 Years and over | 133 (46.5%) | 43 (10.4%) |
Disability Class: Self-Care Difficulty
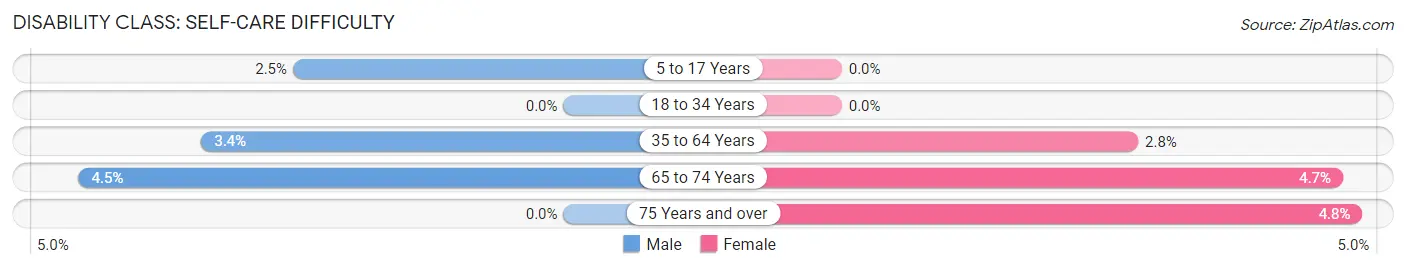
| Age Bracket | Male | Female |
| 5 to 17 Years | 9 (2.5%) | 0 (0.0%) |
| 18 to 34 Years | 0 (0.0%) | 0 (0.0%) |
| 35 to 64 Years | 40 (3.4%) | 43 (2.8%) |
| 65 to 74 Years | 33 (4.5%) | 35 (4.6%) |
| 75 Years and over | 0 (0.0%) | 20 (4.8%) |
Technology Access in Mira Monte
Computing Device Access in Mira Monte
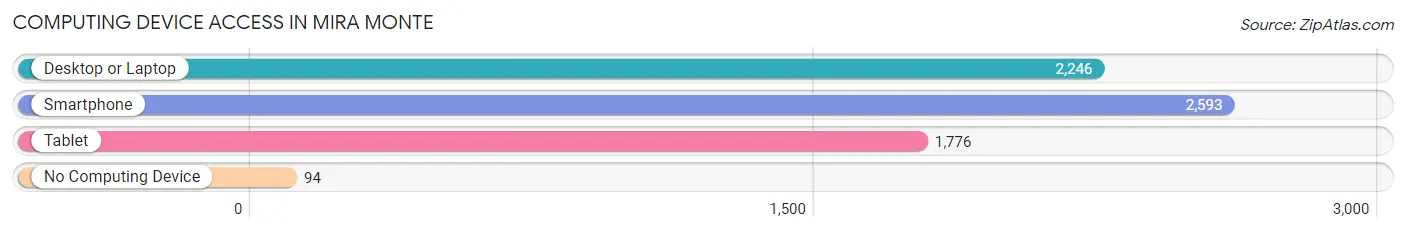
| Device Type | # Households | % Households |
| Desktop or Laptop | 2,246 | 79.1% |
| Smartphone | 2,593 | 91.4% |
| Tablet | 1,776 | 62.6% |
| No Computing Device | 94 | 3.3% |
| Total | 2,838 | 100.0% |
Internet Access in Mira Monte
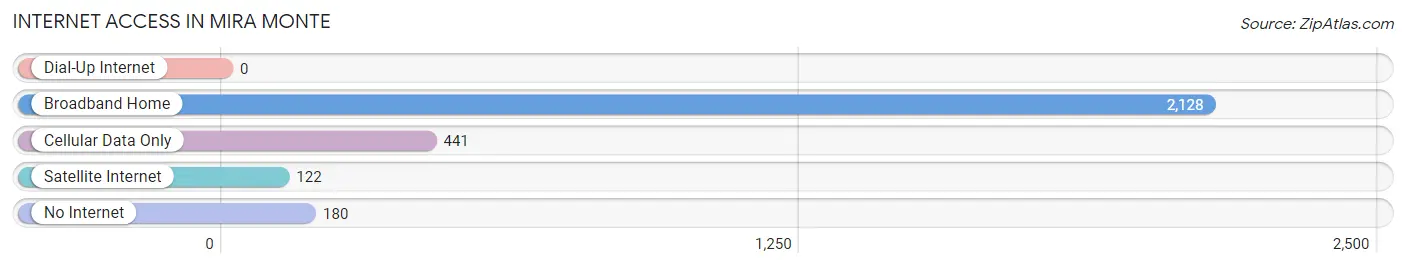
| Internet Type | # Households | % Households |
| Dial-Up Internet | 0 | 0.0% |
| Broadband Home | 2,128 | 75.0% |
| Cellular Data Only | 441 | 15.5% |
| Satellite Internet | 122 | 4.3% |
| No Internet | 180 | 6.3% |
| Total | 2,838 | 100.0% |
Mira Monte Summary
Mira Monte is a small unincorporated community located in the foothills of the San Bernardino Mountains in San Bernardino County, California. The community is situated in the San Bernardino Valley, approximately 25 miles east of the city of San Bernardino. The population of Mira Monte is estimated to be around 1,000 people.
History
Mira Monte was originally inhabited by the Serrano Indians, who were the original inhabitants of the San Bernardino Valley. The Serrano Indians were a peaceful tribe who lived in the area for thousands of years before the arrival of the Spanish in the late 1700s. The Spanish established a mission in the area in 1810, which was the first European settlement in the San Bernardino Valley. The mission was named Mission San Bernardino de Sena Estancia and was located near what is now the city of San Bernardino.
In 1851, the area was opened up to American settlers and the first settlers in the area were the families of William and Mary Ann Smith and William and Mary Ann Miller. The Smiths and Millers were the first settlers to establish a homestead in the area and they named their homestead Mira Monte, which means “look at the mountain” in Spanish. The Smiths and Millers were followed by other settlers who established homesteads in the area and the community of Mira Monte began to grow.
Geography
Mira Monte is located in the foothills of the San Bernardino Mountains in San Bernardino County, California. The community is situated in the San Bernardino Valley, approximately 25 miles east of the city of San Bernardino. The area is characterized by rolling hills and valleys, with elevations ranging from 1,000 to 4,000 feet. The climate in the area is semi-arid, with hot summers and mild winters.
Economy
Mira Monte is a small, rural community with a primarily agricultural economy. The area is known for its citrus and avocado groves, as well as its vineyards and wineries. The area is also home to several small businesses, including a few restaurants, a gas station, and a few small retail stores.
Demographics
The population of Mira Monte is estimated to be around 1,000 people. The majority of the population is of Hispanic or Latino descent, with a small percentage of African American and Asian residents. The median household income in the area is around $50,000, and the median home value is around $250,000. The area is served by the San Bernardino County Sheriff’s Department and the San Bernardino County Fire Department.
Common Questions
What is Per Capita Income in Mira Monte?
Per Capita income in Mira Monte is $45,770.
What is the Median Family Income in Mira Monte?
Median Family Income in Mira Monte is $107,250.
What is the Median Household income in Mira Monte?
Median Household Income in Mira Monte is $77,847.
What is Income or Wage Gap in Mira Monte?
Income or Wage Gap in Mira Monte is 39.9%.
Women in Mira Monte earn 60.1 cents for every dollar earned by a man.
What is Inequality or Gini Index in Mira Monte?
Inequality or Gini Index in Mira Monte is 0.47.
What is the Total Population of Mira Monte?
Total Population of Mira Monte is 6,837.
What is the Total Male Population of Mira Monte?
Total Male Population of Mira Monte is 3,331.
What is the Total Female Population of Mira Monte?
Total Female Population of Mira Monte is 3,506.
What is the Ratio of Males per 100 Females in Mira Monte?
There are 95.01 Males per 100 Females in Mira Monte.
What is the Ratio of Females per 100 Males in Mira Monte?
There are 105.25 Females per 100 Males in Mira Monte.
What is the Median Population Age in Mira Monte?
Median Population Age in Mira Monte is 53.1 Years.
What is the Average Family Size in Mira Monte
Average Family Size in Mira Monte is 3.0 People.
What is the Average Household Size in Mira Monte
Average Household Size in Mira Monte is 2.4 People.
How Large is the Labor Force in Mira Monte?
There are 3,092 People in the Labor Forcein in Mira Monte.
What is the Percentage of People in the Labor Force in Mira Monte?
50.4% of People are in the Labor Force in Mira Monte.
What is the Unemployment Rate in Mira Monte?
Unemployment Rate in Mira Monte is 8.9%.